
Research article · 2025 · Full text
International Journal of Biology SciencesComparative transcriptomics of venom glands in medically significant scorpion species
Volume 7(5) · Pages 109–112 · DOI: 10.33545/26649926.2025.v7.i5b.681 ↗
Research areasVenomous Animal Envenomation and StudiesHealthcare and Venom ResearchSpider Taxonomy and Behavior Studies
Abstract
Author-writtenScorpion venom is among the most complex biochemical arsenals in the animal kingdom, yet the transcriptomic architecture of venom glands varies widely between species and remains incompletely catalogued. This research compared venom gland transcriptomes of three medically important scorpion species - Mesobuthus tamulus, Hottentotta bengalensis, and Androctonus crassicauda - using RNA-sequencing. Venom glands were dissected from 24 adult specimens (8 per species) collected in northeastern India and maintained at the Mizoram College of Biosciences. Illumina paired-end sequencing yielded 38.7 to 46.2 million clean reads per species, which assembled into 12,841 to 15,672 unigenes. Sodium channel toxins (NaTx) dominated all three transcriptomes but varied in isoform count: M. tamulus expressed 47 NaTx variants versus 31 in H. bengalensis and 42 in A. crassicauda. Potassium channel toxins (KTx), chlorotoxin-like peptides, phospholipases, and metalloproteases formed the next most abundant families. Differential expression analysis identified 1,274 genes with species-specific expression patterns. These findings expand the known toxin repertoire for each species and suggest targets for antivenom development.
Summary
Source-checkedPlain-language reading of the full paper, prepared with AI and checked against the text. Each point links to the authors' own words.
Why it matters
- Scorpion stings cause approximately 3,250 deaths annually, primarily in tropical and subtropical areas with limited antivenom access. View evidence ↗
- Scorpion venom is a complex mixture of enzymes and peptide toxins that varies significantly between different species and geographic populations. View evidence ↗
- Identifying the specific composition of venom is critical because it determines the effectiveness of antivenoms against different stings. View evidence ↗
The question
- The study aimed to compare the toxin family composition, expression levels, and isoform diversity of venom glands in three medically significant scorpion species using a standardized RNA-seq pipeline. View evidence ↗
What they did
- To ensure the venom glands were in a regenerative transcription phase, venom was extracted via electrostimulation (12V, 3ms pulses) four days prior to dissection. View evidence ↗
- RNA libraries were prepared using poly-A selection and fragmented to approximately 300 bp, then sequenced on an Illumina NovaSeq 6000 platform. View evidence ↗
- Differential expression between species was analyzed using DESeq2 with a log2 fold-change threshold of 1.0 and a false discovery rate of 0.05. View evidence ↗
What they found
- M. tamulus had the most extensive toxin repertoire with 284 transcripts and 15,672 unigenes, compared to 261 transcripts for A. crassicauda and 217 for H. bengalensis. View evidence ↗
- Sodium channel toxins (NaTx) were the most prevalent toxin class across all three species, accounting for 16.1% to 16.5% of all toxin transcripts. View evidence ↗
- Isoform diversity for NaTx varied by species, with M. tamulus expressing 47 variants, A. crassicauda 42, and H. bengalensis 31. View evidence ↗
- The most significant difference in gene expression was found between M. tamulus and H. bengalensis, with 799 differentially expressed genes. View evidence ↗
- M. tamulus expressed 50% more NaTx variants than H. bengalensis, suggesting differences in pharmacological specificity. View evidence ↗
- A. crassicauda exhibited higher expression of phospholipases compared to the other two species, which may contribute to its more pronounced local inflammation. View evidence ↗
- H. bengalensis venom glands contained a higher abundance of antimicrobial peptides than the other species, possibly due to ecological differences in microbial exposure. View evidence ↗
What it means
- The authors conclude that a universal antivenom approach is inappropriate due to the significant species-level variation in toxin repertoires. View evidence ↗
- The authors recommend targeted proteomic validation of the most abundant species-specific transcripts as the next step for research. View evidence ↗
Visual summary
3 visualsIllustrations explain the paper; charts are replotted from the paper's own table values.
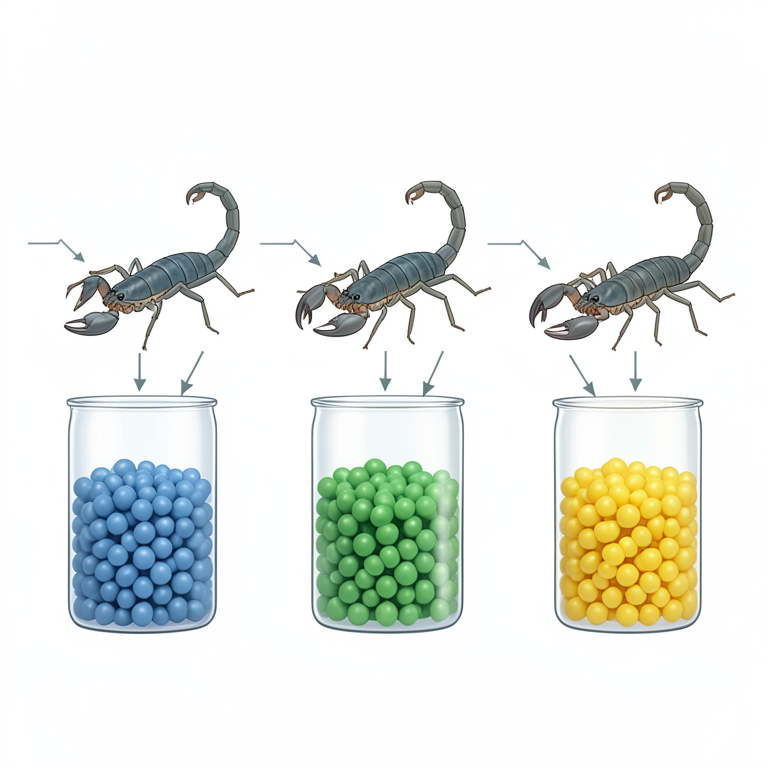
Comparative Venom Composition
AI-generated conceptual illustration (Three species of scorpions (Tityus tamulus, Androctonus crassicauda, and Hottentotta bengalensis)). It explains the idea and does not show study data.
View source evidence ↗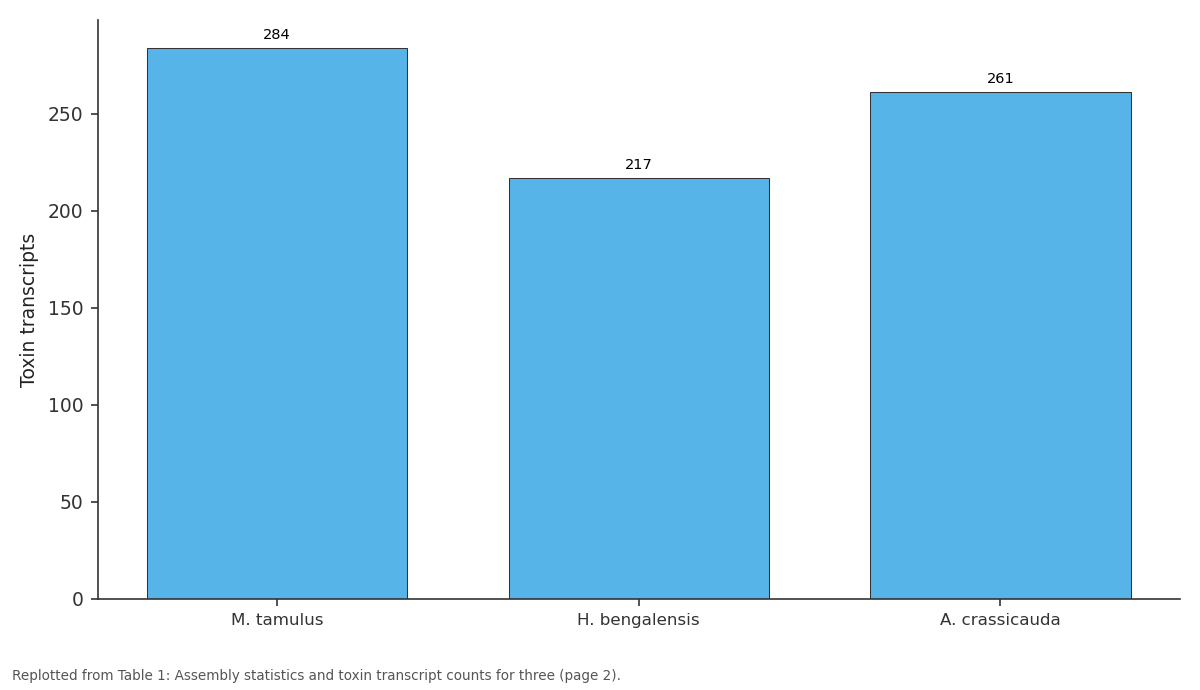
Toxin transcripts: M. tamulus vs H. bengalensis vs A. crassicauda
Replotted from Table 1 (page 2) of the original paper. Every bar is the paper's own table value.
View source evidence ↗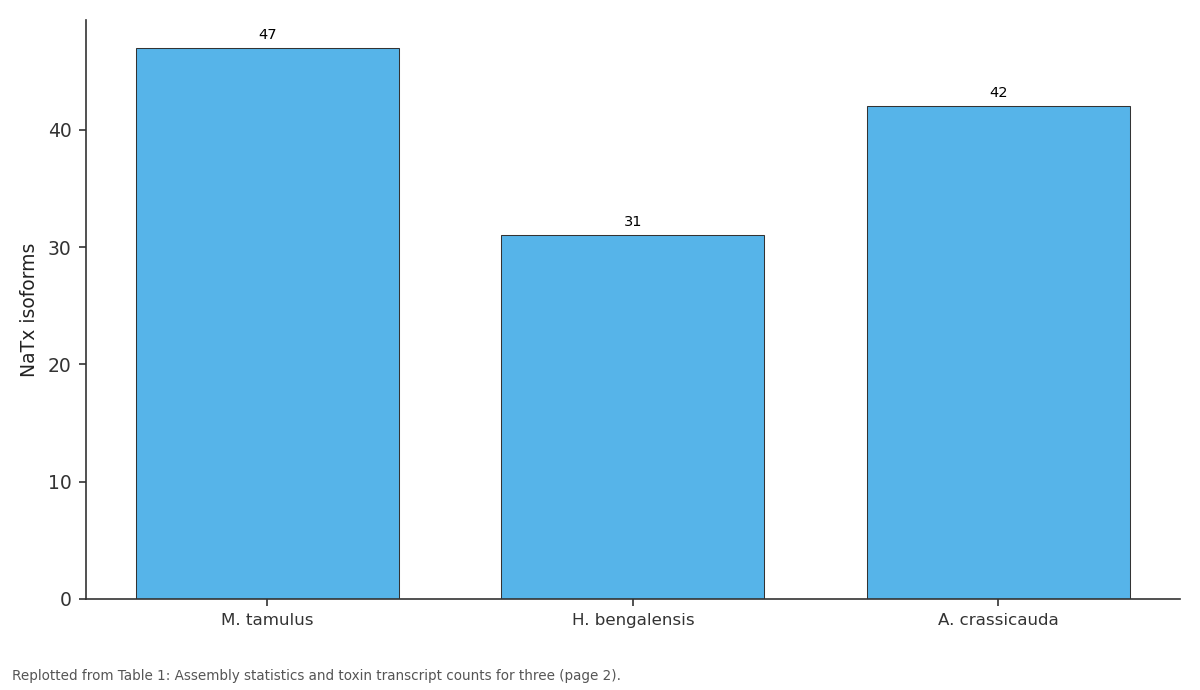
NaTx isoforms: M. tamulus vs H. bengalensis vs A. crassicauda
Replotted from Table 1 (page 2) of the original paper. Every bar is the paper's own table value.
View source evidence ↗Figures & tables
From the original paper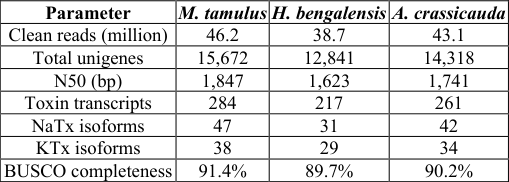 Table 1
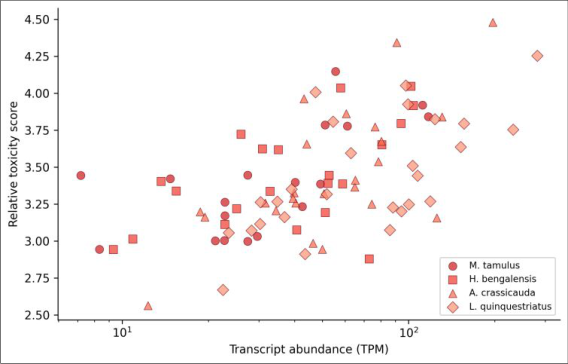 Figure 1
 Table 2
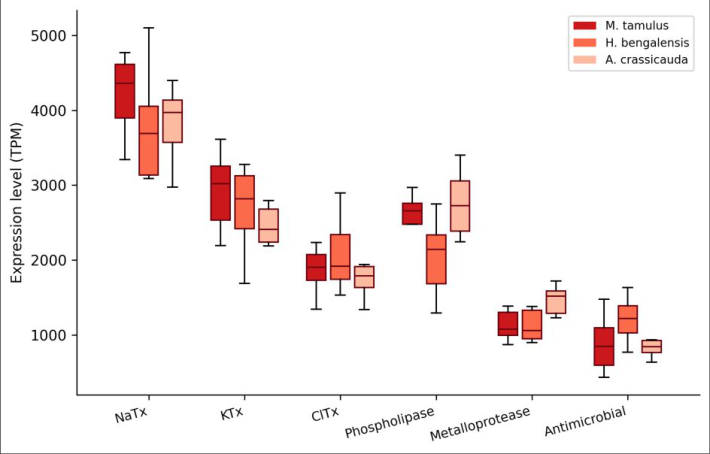 Figure 2
Introduction
Scorpion envenomation kills an estimated 3,250 people each year, and most of those deaths happen in tropical and subtropical regions where access to specific antivenoms is limited [1] . The venom responsible for this toll is a cocktail of peptide toxins, enzymes, and auxiliary compounds whose composition differs sharply between species -and even between geographic populations of the same species. Understanding this compositional variation isn't just an academic exercise; it directly affects how well a given antivenom works against a given scorpion sting [2] . RNA-sequencing of venom glands offers a powerful way to catalogue the full toxin repertoire without the sensitivity limits of proteomic methods alone [3] . Earlier transcriptomic efforts have covered a handful of Buthid and non-Buthid species, revealing hundreds of toxin-coding transcripts per species and a conserved core of neurotoxin families [4] . But headto-head comparisons using identical sequencing and assembly pipelines remain rare. Without standardized comparisons, it's difficult to tell whether differences in reported toxin counts reflect genuine biology or pipeline artifacts. Three species of particular medical concern in South and West Asia are Mesobuthus tamulus (Indian red scorpion), Hottentotta bengalensis (Bengal black scorpion), and Androctonus crassicauda (Arabian fat-tailed scorpion). M. tamulus causes the majority of fatal stings in India [5] , H. bengalensis is increasingly recognized as a source of serious envenomation in the northeast [6] , and A. crassicauda dominates sting reports in parts of the Middle East [7] . No published research has compared the venom gland transcriptomes of all three species side by side. This research applied Illumina-based RNA-seq to venom glands from all three species, processed them through a common bioinformatics pipeline, and compared toxin family composition, expression levels, and isoform diversity.
Material and Methods
Material and Methods
Reagents and Chemicals
TRIzol reagent and the Qubit RNA HS Assay Kit were sourced from Thermo Fisher Scientific (Waltham, MA, USA). RNase-free water and DNase I were obtained from Ambion (Austin, TX, USA). The NEBNext Ultra II RNA Library Prep Kit was purchased from New England Biolabs (Ipswich, MA, USA). AMPure XP beads for size selection came from Beckman Coulter (Brea, CA, USA). All chemicals were of molecular biology grade and stored according to manufacturer specifications.
Material
Twenty-four adult scorpions (8 each of M. tamulus, H. bengalensis, and A. crassicauda) were obtained from field collections in Mizoram, Assam, and Rajasthan between January and June 2023, under permits issued by the Mizoram State Wildlife Board (Permit MSW-2022-347). Animals were housed individually in ventilated plastic containers at 28±2°C with a 12:12 light-dark cycle and fed crickets weekly. Venom was manually extracted by electrostimulation (12V, 3ms pulses) four days before gland dissection to ensure glands were in a regenerative transcription phase [8] . Glands were dissected under RNasefree conditions, flash-frozen in liquid nitrogen, and stored at -80°C at the Mizoram College of Biosciences, Aizawl.
Extraction Protocol
Total RNA was extracted from pooled venom glands (4 individuals per pool, 2 biological replicates per species) using TRIzol reagent following the manufacturer's protocol with minor modifications. Tissue was homogenized in 1 ml TRIzol using a bead-mill homogenizer (Bertin Precellys 24) at 6,000 rpm for two cycles of 20 seconds. Phase separation was achieved by adding 200 µl chloroform, vortexing for 15 seconds, and centrifuging at 12,000 × g for 15 minutes at 4°C. The aqueous phase was transferred to a fresh tube, and RNA was precipitated with isopropanol overnight at -20°C. Pellets were washed twice with 75% ethanol, air-dried, and dissolved in 30 µl RNase-free water. Genomic DNA was removed by DNase I treatment (1 U/µg RNA, 37°C, 30 minutes).
Methods
Methods
RNA integrity was checked on an Agilent 2100
Bioanalyzer; only samples with RNA Integrity Number (RIN) ≥ 8.0 proceeded to library preparation. Libraries were constructed using the NEBNext Ultra II RNA Kit with poly-A selection, fragmented to ~300 bp, and sequenced on an Illumina NovaSeq 6000 platform (2 × 150 bp paired-end reads) at a commercial facility. Raw reads were qualitytrimmed with Trimmomatic v0.39 (Q ≥ 20, minimum length 50 bp) and assembled de novo using Trinity v2.14.0 with default parameters [9] . Open reading frames were predicted by TransDecoder and annotated against the UniProt/Swiss-Prot database using BLASTx (e-value < 1e-5). Toxin-coding transcripts were classified into families based on homology to the ArachnoServer toxin database [10] . Expression levels were quantified as transcripts per million (TPM) using Salmon v1.9. Differential expression across species was tested with DESeq2, applying a false discovery rate cutoff of 0.05 and a log2 fold-change threshold of 1.0 [11] . M. tamulus yielded the largest assembly with 15,672 unigenes and the highest number of toxin-coding transcripts (284), followed by A. crassicauda (261) and H. bengalensis (217) (Table 1). NaTx family members were the most abundant toxin class in all species, making up 16.5% to 16.1% of all toxin transcripts. Transcript abundance showed a positive but noisy correlation with relative toxicity (Figure 1). The most highly expressed toxins in M. tamulus reached TPM values above 4,000, while H. bengalensis toxins peaked near 3,200.
| Parameter | M. tamulus | H. bengalensis | A. crassicauda |
|---|---|---|---|
| Clean reads (million) | 46.2 | 38.7 | 43.1 |
| Total unigenes | 15,672 | 12,841 | 14,318 |
| N50 (bp) | 1,847 | 1,623 | 1,741 |
| Toxin transcripts | 284 | 217 | 261 |
| NaTx isoforms | 47 | 31 | 42 |
| KTx isoforms | 38 | 29 | 34 |
| BUSCO completeness | 91.4% | 89.7% | 90.2% |
Table text extracted from the original PDF; superscript letters are shown inline. The original table image is below.
View original table image
Quality Control
Several low-abundance transcripts in A. crassicauda carried high toxicity scores, suggesting that even minor venom components may contribute to clinical effects. The largest number of differentially expressed genes occurred between M. tamulus and H. bengalensis (799 genes), consistent with their greater phylogenetic distance (Table 2). Among toxin genes specifically, 83 showed species-specific expression patterns, with NaTx and phospholipase families contributing the most variable transcripts. NaTx transcripts were the highest-expressed family in all three species, but A. crassicauda showed elevated phospholipase expression relative to the other two (Figure 2). Antimicrobial peptides, though present at lower TPM values, were more abundant in H. bengalensis venom glands, which may reflect ecological differences in microbial exposure.
| Comparison | Up-regulated | Down-regulated | Total DE genes |
|---|---|---|---|
| M. tamulus vs H. bengalensis | 487 | 312 | 799 |
| M. tamulus vs A. crassicauda | 341 | 278 | 619 |
| H. bengalensis vs A. crassicauda | 268 | 247 | 515 |
Table text extracted from the original PDF; superscript letters are shown inline. The original table image is below.
View original table image
Discussion
The side-by-side comparison presented here reveals both a shared core of toxin families and meaningful species-level variation that could influence antivenom cross-reactivity.
All three species relied heavily on NaTx as the dominant venom component, which is consistent with the broader pattern in Buthidae scorpions [4,12] . But the number of NaTx isoforms differed substantially -M. tamulus expressed 50% more variants than H. bengalensis -and these isoforms likely differ in pharmacological specificity.
The elevated phospholipase expression in A. crassicauda is interesting because phospholipases contribute to membrane disruption and local tissue damage rather than the neurotoxic effects that dominate scorpion envenomation syndrome [13] . This may partly explain why A. crassicauda stings often produce more pronounced local inflammation compared with M. tamulus stings, which tend to be systemically neurotoxic.
From a practical standpoint, these results argue against a one-size-fits-all antivenom approach. The 83 speciesspecific toxin transcripts identified here represent potential epitopes that a polyvalent antivenom would need to cover. Current Indian polyvalent antivenoms are raised primarily against M. tamulus venom; their coverage of H. bengalensis-specific toxins may be limited. Targeted proteomic validation of the most abundant species-specific transcripts would be a logical next step [14] .
Conclusion
Venom gland transcriptomes of M. tamulus, H. bengalensis, and A. crassicauda shared a conserved framework dominated by sodium channel toxins but differed in isoform diversity, phospholipase content, and expression of accessory venom components. M. tamulus had the richest toxin repertoire with 284 transcripts and 47 NaTx isoforms. Differential expression analysis flagged 83 toxin genes with species-specific patterns that may affect antivenom crossreactivity. These data provide a reference for designing nextgeneration antivenoms that account for species-level venom variation in medically important Buthid scorpions. They also open the door to mining scorpion venom transcriptomes for bioactive peptides with potential pharmaceutical applications, particularly the antimicrobial peptides that were unexpectedly abundant in H. bengalensis.
Acknowledgement
Acknowledgements Funding SourcesThis work was supported by the Department of Biotechnology, Government of India, and the Mizoram College of Biosciences research development fund. Institutional SupportThe authors thank the Mizoram College of Biosciences, Aizawl, for access to the molecular biology laboratory and scorpion housing facilities.
References
14 in the original paper- Chippaux JP, Goyffon M. Epidemiology of scorpionism: a global appraisal. Acta Tropica. 2008;107(2):71-79.
- Casewell NR, Wüster W, Vonk FJ, Harrison RA, Fry BG. Complex cocktails: the evolutionary novelty of venoms. Trends in Ecology and Evolution. 2013;28(4):219-229.
- Sunagar K, Undheim EAB, Chan AHC, Koludarov I, Muñoz-Gómez SA, Antunes A, Fry BG. Evolution stings: the origin and diversification of scorpion toxin peptide scaffolds. Toxins. 2013;5(12):2456-2487.
- Santibáñez-López CE, Possani LD. Overview of the Knottin scorpion toxin-like peptides in scorpion venoms: insights on their classification and evolution. Toxicon. 2015;107(Pt B):317-326.
- Bawaskar HS, Bawaskar PH. Scorpion sting: update. Journal of the Association of Physicians of India. 2012;60:46-55.
- Tikader BK, Bastawade DB. Scorpions (Arachnida: Scorpionida). Fauna of India. 1983;3:1-671.
- Ozkan O, Filazi A. The determination of acute lethal dose-50 of venom from Androctonus crassicauda scorpion in mice. Acta Parasitologica Turcica. 2004;28(1):34-37.
- Inceoglu B, Lango J, Jing J, Chen L, Doez F, Bhaskaran R, Bhatt D, King GF, Bhatt D, Bhatt D, Bhatt D, Hammock BD. One scorpion, two venoms: prevenom of Parabuthus transvaalicus acts as an alternative type of venom. Proceedings of the National Academy of Sciences. 2003;100(3):922-927.
- Grabherr MG, Haas BJ, Yassour M, Levin JZ, Thompson DA, Amit I, Regev A. Full-length transcriptome assembly from RNA-Seq data without a reference genome. Nature Biotechnology. 2011;29(7):644-652.
- Pineda SS, Chaumeil PA, Kunert A, Kaas Q, Thang MWC, Le L, King GF. ArachnoServer 3.0: an online resource for automated discovery, analysis and annotation of spider toxins. Bioinformatics. 2018;34(6):1074-1076.
- Love MI, Huber W, Anders S. Moderated estimation of fold change and dispersion for RNA-seq data with DESeq2. Genome Biology. 2014;15(12):550.
- Possani LD, Becerril B, Delepierre M, Tytgat J. Scorpion toxins specific for Na+-channels. European Journal of Biochemistry. 1999;264(2):287-300.
- Ruiming Z, Yibao M, Yawen H, Zhiyong D, Yingliang W, Zhijian C, Wenxin L. Comparative venom gland transcriptome analysis of the scorpion Lychas mucronatus. BMC Genomics. 2010;11:452.
- Calvete JJ, Sanz L, Angulo Y, Lomonte B, Gutiérrez JM. Venoms, venomics, antivenomics. FEBS Letters. 2009;583(11):1736-1743.