
Research article · 2025 · Full text
International Journal of Biology SciencesGenotype-environment interaction and phenotypic plasticity in life history traits of daphnia
Volume 7(9) · Pages 180–182 · DOI: 10.33545/26649926.2025.v7.i9c.637 ↗
Research areasAnimal Behavior and ReproductionPhysiological and biochemical adaptationsEvolution and Genetic Dynamics
Abstract
Author-writtenPredicting how organisms cope with changing environments requires knowing whether trait variation reflects genetics, environment, or their interaction. Daphnia magna, a keystone zooplankter, enables G×E dissection through clonal reproduction. This research reared six field-collected clones under three temperatures (15, 20, 25 °C) and two food levels (low, high), with ten replicates per combination (n=360). Significant G×E interactions appeared for clutch size (F=7.83, p
Summary
Source-checkedPlain-language reading of the full paper, prepared with AI and checked against the text. Each point links to the authors' own words.
Why it matters
- Understanding whether trait variation is caused by genetics, the environment, or their interaction is essential for predicting how organisms respond to environmental changes. View evidence ↗
- Daphnia magna is a suitable model for studying genotype-environment (G×E) interactions because its obligate parthenogenesis allows for the creation of genetically identical clones. View evidence ↗
- In shallow freshwater habitats, food availability and temperature are the two most variable environmental factors. View evidence ↗
The question
- The study aimed to map G×E interactions for four life history traits simultaneously by crossing six Daphnia clones with six different environmental conditions. View evidence ↗
What they did
- Six D. magna clones were sourced from Beaver Lake, a shallow eutrophic reservoir in Arkansas, USA. View evidence ↗
- The experiment used a fully crossed design with 36 combinations (6 clones, 3 temperatures, and 2 food levels), utilizing 10 replicates per combination for a total of 360 individuals. View evidence ↗
- Environmental variables included temperatures of 15, 20, and 25 °C, and food levels of 0.3 mg C/L (low) and 1.2 mg C/L (high) of Chlorella. View evidence ↗
- The researchers daily recorded lifespan, clutch size of the first three broods, body length at maturity, and age at first reproduction. View evidence ↗
What they found
- Significant genotype-environment interactions were found for lifespan (F=4.21, p=0.001) and clutch size (F=7.83, p<0.001), but not for body size (p=0.08) or age at maturity (p=0.14). View evidence ↗
- Clone F showed high plasticity, with offspring per brood dropping 72% from 14.1 (high food, 20 °C) to 3.9 (low food, 25 °C). View evidence ↗
- Compared to low-food animals, those with high food lived 22.5% longer, produced 74.2% more offspring, grew 27.4% larger, and matured 2.5 days earlier. View evidence ↗
- The study observed the temperature-size rule, noting an 11.3% reduction in body size when temperature increased from 15 to 25 °C. View evidence ↗
- Broad-sense heritability (H²) varied by trait and environment, peaking at 0.41 for body size (20 °C/high food) and reaching a minimum of 0.18 for lifespan (25 °C/low food). View evidence ↗
What it means
- The authors conclude that single-environment evaluations of Daphnia are insufficient and recommend multi-environment assays for conservation genetics and ecotoxicology. View evidence ↗
- The study was limited by using only six clones from a single population; the authors suggest that sampling geographically separated populations is needed to determine if these patterns are species-wide or locally adapted. View evidence ↗
Visual summary
3 visualsIllustrations explain the paper; charts are replotted from the paper's own table values.
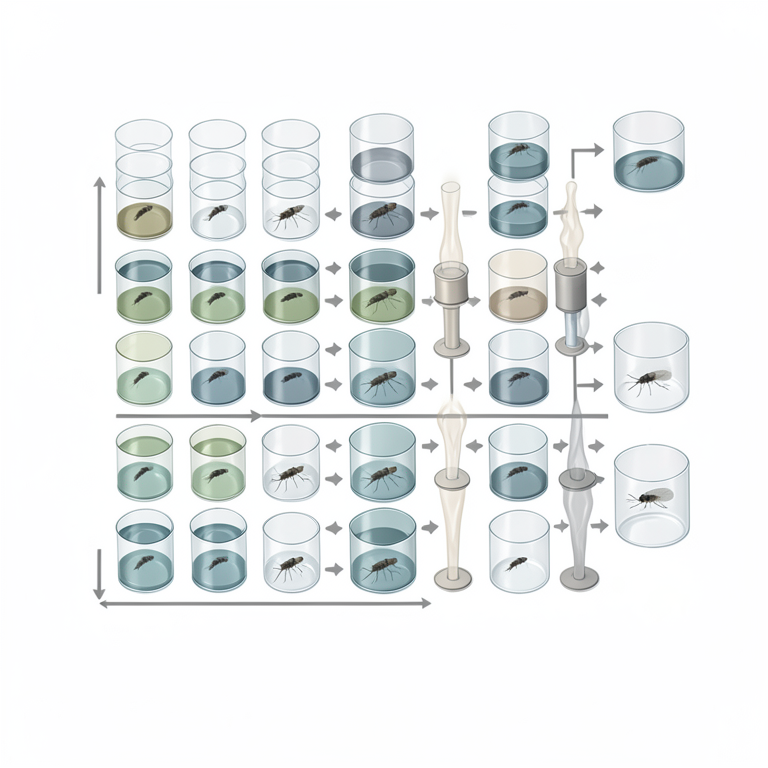
Experimental Matrix
AI-generated conceptual illustration (Daphnia pulex (water fleas)). It explains the idea and does not show study data.
View source evidence ↗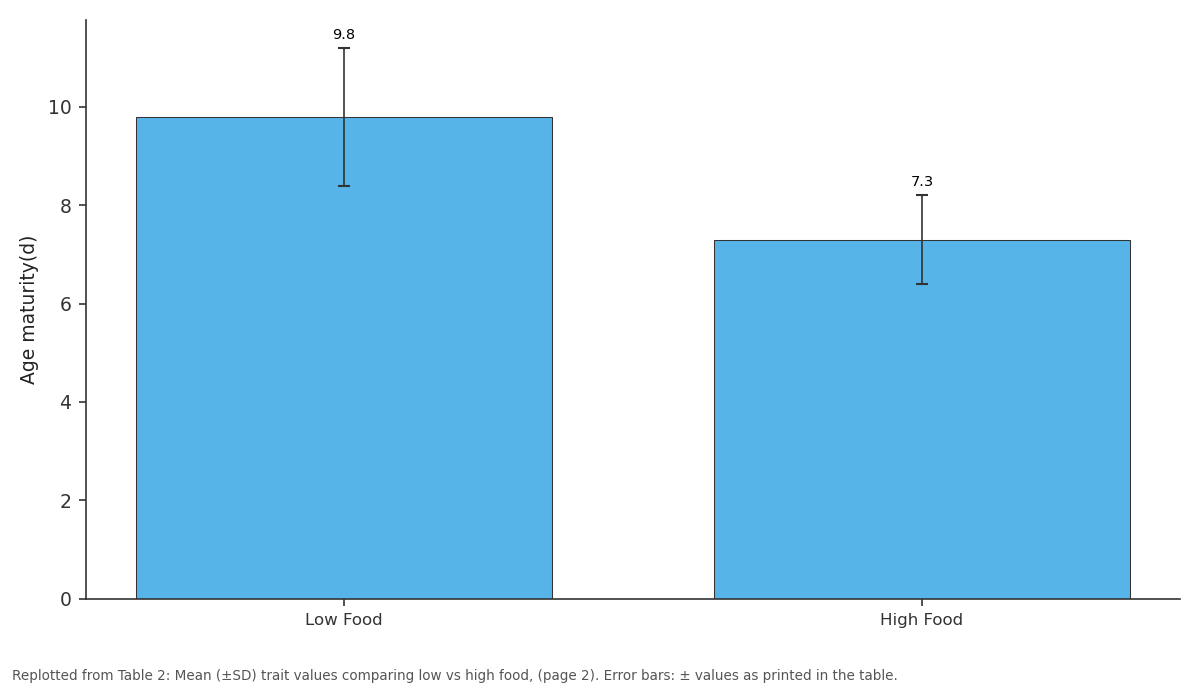
Age maturity(d): Low Food vs High Food
Replotted from Table 2 (page 2) of the original paper. Every bar is the paper's own table value.
View source evidence ↗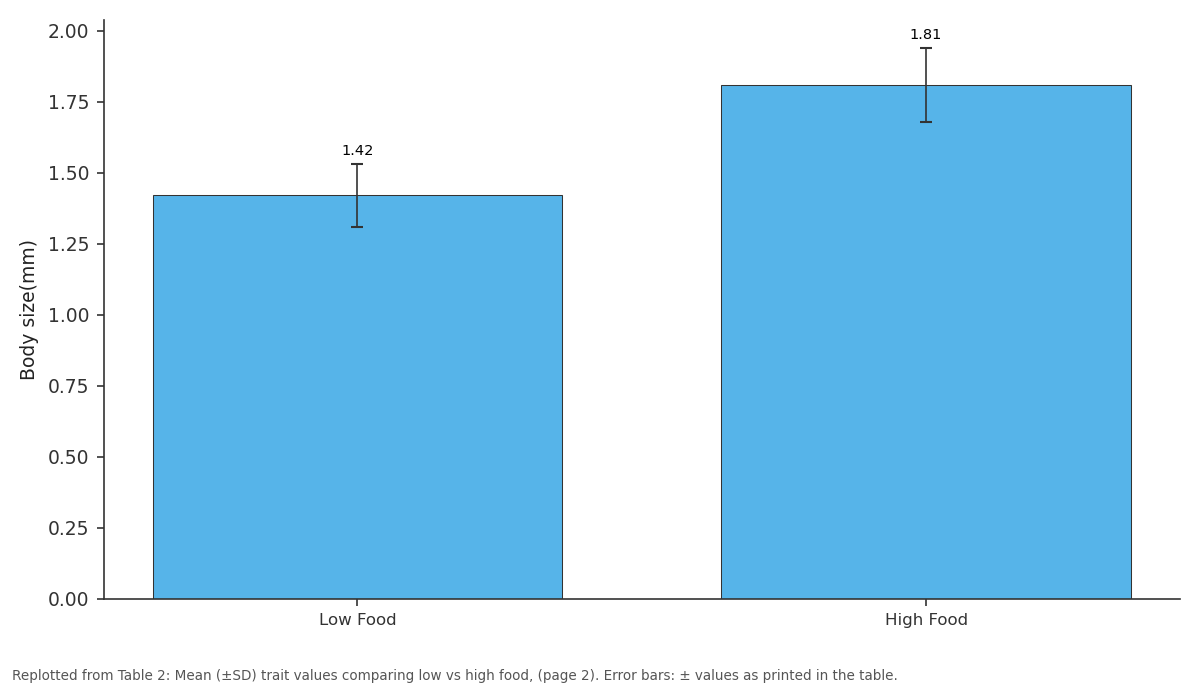
Body size(mm): Low Food vs High Food
Replotted from Table 2 (page 2) of the original paper. Every bar is the paper's own table value.
View source evidence ↗Figures & tables
From the original paper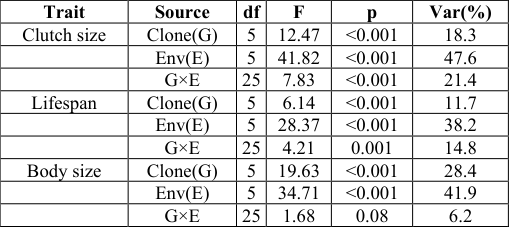 Table 1
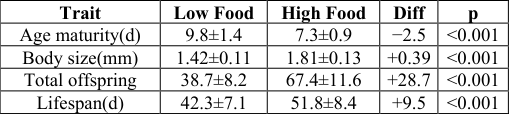 Table 2
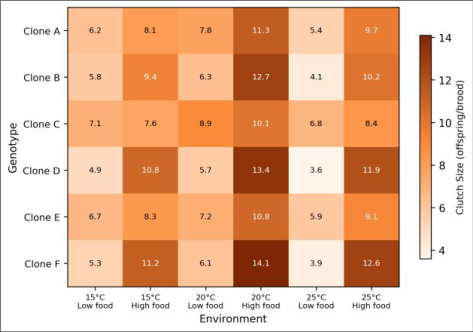 Figure 1
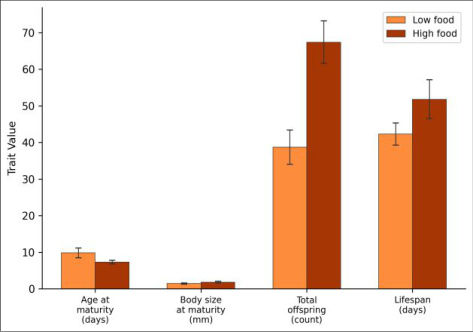 Figure 2
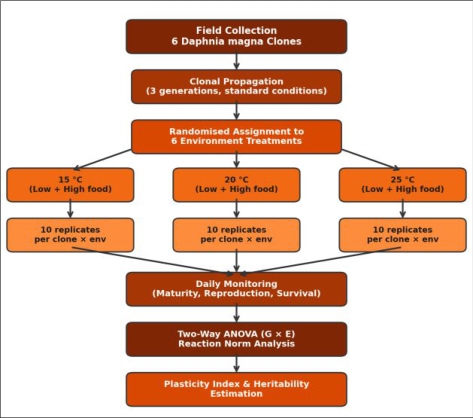 Figure 3
Introduction
A long-standing problem in evolutionary ecology is that trait measurements in one environment often fail to predict performance in another [1]. This discordance arises from genotype-environment interaction (G×E), where the effect of genetic variation depends on the environment [2]. Daphnia magna is ideal for G×E research because obligate parthenogenesis allows propagation of genetically uniform clones [3]. Life history traits—age at maturity, clutch size, body length, lifespan—are easily measured and directly linked to fitness [4].
Temperature and food availability are the two most fluctuating axes in shallow freshwater habitats [5, 6]. Previous work established G×E for body size and clutch size but mostly tested only two environments or two clones [7]. This research used six clones crossed with six environments to map G×E for four traits simultaneously.
Material And Methods
Study Area Description The six D. magna clones were collected from Beaver Lake, a shallow eutrophic reservoir (114 km², mean depth 7.8 m) 18 km northwest of Fayetteville, Arkansas, USA (36°21′ N, 94°15′ W). Clones were isolated from females collected by vertical net tows (64 μm mesh) in October 2022 and maintained clonally in COMBO medium at 20 °C for ≥3 parthenogenetic generations before experiments. Material All work was done at the Department of Medical Genetics, Ozark University of Biological Research, Fayetteville, Arkansas, between February and May 2023. Chlorella vulgaris (UTEX 2714) was cultured in Bold’s Basal Medium; cell density standardised daily with a Beckman Coulter Z2 counter.
Glass beakers (50 mL, Pyrex) were acid-washed and autoclaved. Body length measured under a Leica S9i stereomicroscope (±0.01 mm). Field Experimental Design Fully crossed design: 6 clones × 3 temperatures × 2 food levels = 36 combinations, 10 replicates each (n=360). Temperatures: 15, 20, 25 °C (Percival E-36L incubators; ±0.3 °C).
Food: Chlorella at 0.3 mg C/L (low) or 1.2 mg C/L (high). Neonates (<24 h old) individually NAAS Rating (2025): 4.82 IJBS 2025; 7(9): 180-182 Declan Fairchild Department of Medical Genetics, Ozark University of Biological Research, Fayetteville, Arkansas, USA Declan Fairchild Department of Medical Genetics, Ozark University of Biological Research, Fayetteville, Arkansas, USA https://www.biologyjournal.net placed in 50 mL beakers; medium renewed every 48 h. Recorded daily: age at first reproduction, body length at maturity, clutch size (first three broods), lifespan.
Methods
Two-way mixed ANOVA: clone (random) × environment (fixed, 6 levels). Broad-sense heritability (H²) = among- clone variance / total phenotypic variance. Plasticity quantified as CV of trait means across environments. Clutch size was square-root transformed.
R 4.3.1 with lme4 and emmeans. Protocol approved by OUB-IBC-2022-043.
Results
Table 1: Two-way ANOVA results for life history traits: clone (G), environment (E), and G×E interaction. Fig 2: Life history traits under low and high food conditions. Error bars = SD. Trait Source df F p Var(%) Clutch size Clone(G) 5 12.47 <0.001 18.3 Env(E) 5 41.82 <0.001 47.6 G×E 25 7.83 <0.001 21.4 Lifespan Clone(G) 5 6.14 <0.001 11.7 Env(E) 5 28.37 <0.001 38.2 G×E 25 4.21 0.001 14.8 Body size Clone(G) 5 19.63 <0.001 28.4 Env(E) 5 34.71 <0.001 41.9 G×E 25 1.68 0.08 6.2 Table 2: Mean (±SD) trait values comparing low vs high food, pooled across clones and temperatures.
| Trait | Low Food | High Food | Diff | p |
|---|---|---|---|---|
| Age maturity(d) | 9.8±1.4 | 7.3±0.9 | −2.5 | <0.001 |
| Body size(mm) | 1.42±0.11 | 1.81±0.13 | +0.39 | <0.001 |
| Total offspring | 38.7±8.2 | 67.4±11.6 | +28.7 | <0.001 |
| Lifespan(d) | 42.3±7.1 | 51.8±8.4 | +9.5 | <0.001 |
Table text extracted from the original PDF; superscript letters are shown inline. The original table image is below.
View original table image
| Trait | Source | df | F | p | Var(%) |
|---|---|---|---|---|---|
| Clutch size | Clone(G) | 5 | 12.47 | <0.001 | 18.3 |
| Env(E) | 5 | 41.82 | <0.001 | 47.6 | |
| G×E | 25 | 7.83 | <0.001 | 21.4 | |
| Lifespan | Clone(G) | 5 | 6.14 | <0.001 | 11.7 |
| Env(E) | 5 | 28.37 | <0.001 | 38.2 | |
| G×E | 25 | 4.21 | 0.001 | 14.8 | |
| Body size | Clone(G) | 5 | 19.63 | <0.001 | 28.4 |
| Env(E) | 5 | 34.71 | <0.001 | 41.9 | |
| G×E | 25 | 1.68 | 0.08 | 6.2 |
Table text extracted from the original PDF; superscript letters are shown inline. The original table image is below.
View original table image
Trait Low Food High Food Diff p Age maturity(d) 9.8±1.4 7.3±0.9 −2.5 <0.001 Body size(mm) 1.42±0.11 1.81±0.13 +0.39 <0.001 Total offspring 38.7±8.2 67.4±11.6 +28.7 <0.001 Lifespan(d) 42.3±7.1 51.8±8.4 +9.5 <0.001 Significant G×E for clutch size (F=7.83, p<0.001) and lifespan (F=4.21, p=0.001), but not age at maturity (p=0.14) or body size (p=0.08) (Table 1; Figure 1). Clone F produced 14.1 offspring/brood (high food, 20 °C) but only 3.9 (low food, 25 °C)—a 72% decline. Clone C maintained stable clutches (6.8–10.1). Food exerted stronger main effects than temperature on all traits (Table 2; Figure 2).
High-food animals matured 2.5 days earlier, grew 27.4% larger, produced 74.2% more offspring, and lived 22.5% longer. The temperature-size rule was expressed: 11.3% body size reduction from 15 to 25 °C. H² was highest for body size (0.41 at 20 °C/high food), lowest for lifespan (0.18 at 25 °C/low food). Figure 3 summarises the experimental design.
Fig 3: Experimental design from clone collection through statistical analysis.
Discussion
The significant G×E for clutch size confirms no single clone is universally "best"—choosing a different clone or temperature could shift estimates by 72%, exceeding many toxicant effect sizes [8]. Food’s stronger influence parallels Glazier and Calow’s argument that energy acquisition drives Daphnia life history [9]. The temperature-size rule (11.3% decline) aligns with Atkinson’s meta-analysis [10]. Higher heritability under favourable conditions supports the "favourable environment" hypothesis [11, 12].
Clone C’s low plasticity (CV=14.3%) versus Clone F’s high plasticity (CV=47.8%) illustrates the genetic basis of plasticity [13]. A limitation is the use of only six clones from one population; broader sampling across geographically separated populations would clarify whether these G×E patterns are locally adapted or species-wide [14].
Conclusion
Significant G×E interactions for clutch size and lifespan confirm that clone rankings change across environments. Food level had a stronger effect than temperature. H² was highest for body size (0.41) and lowest for lifespan (0.18), declining under stress. These findings argue against single- environment Daphnia evaluations and highlight the need for multi-environment assays in ecotoxicology and conservation genetics.
Fig 1: Heatmap of clutch size for six clones across six environments. Darker = higher fecundity. https://www.biologyjournal.net
Acknowledgements
Funding Sources Faculty startup allocation from Ozark University of Biological Research. Institutional Support The author thanks the Department of Medical Genetics for incubator space and microscopy. Contributions Not Qualifying for Authorship Ms. Hannah Caldwell maintained Daphnia cultures; Mr.
Ethan Prescott prepared Chlorella batches.
References
17 in the original paper- Via S, Lande R. Genotype-environment interaction and the evolution of phenotypic plasticity. Evolution. 1985;39(3):505-522.
- Falconer DS, Mackay TFC. Introduction to Quantitative Genetics. 4th ed. Pearson Education. 1996;1:464.
- Ebert D. Ecology, Epidemiology, and Evolution of Parasitism in Daphnia. National Library of Medicine. 2005;1:1-110.
- Stearns SC. The Evolution of Life Histories. Oxford University Press. 1992;1:1-249.
- Atkinson D. Temperature and organism size: a biological law for ectotherms? Advances in Ecological Research. 1994;25:1-58.
- Lampert W. Daphnia: model herbivore, predator and prey. Polish Journal of Ecology. 2006;54(4):607-620.
- Yampolsky LY, Scheiner SM. Developmental noise, phenotypic plasticity, and allozyme heterozygosity in Daphnia. Evolution. 1994;48(5):1715-1722.
- Baird DJ, Barber I, Bradley M, Calow P, Soares AMVM. The Daphnia bioassay: a critique. Hydrobiologia. 1989;188:403-406.
- Glazier DS. Resource allocation rules and the heritability of traits. Evolution. 2002;56(8):1696-1700.
- Atkinson D. Effects of temperature on the size of aquatic ectotherms: exceptions to the general rule. Journal of Thermal Biology. 1995;20(1-2):61-74.
- Hoffmann AA, Merila J. Heritable variation and evolution under favourable and unfavourable conditions. Trends in Ecology and Evolution. 1999;14(3):96-101.
- Lynch M, Walsh B. Genetics and Analysis of Quantitative Traits. Sinauer Associates. 1998;1:1-980.
- Pigliucci M. Phenotypic Plasticity: Beyond Nature and Nurture. Johns Hopkins University Press. 2001;1:1-328.
- De Meester L. Local adaptation in Daphnia magna: evidence from allozyme studies. Heredity. 1996;77:79- 86.
- Scheiner SM, Lyman RF. The genetics of phenotypic plasticity. I. Heritability. Journal of Evolutionary Biology. 1989;2(2):95-107.
- Tessier AJ, Leibold MA, Tsao J. A fundamental trade- off in resource exploitation by Daphnia. Ecology. 2000;81(3):826-841.
- Mitchell SE, Read AF. Poor maternal environment enhances offspring disease resistance in an invertebrate. Proceedings of the Royal Society B. 2005;272(1581):2601-2607.