
Research article · 2025 · Full text
International Journal of Biology SciencesGlycosylation patterns and their functional implications in therapeutic monoclonal antibodies
Volume 7(4) · Pages 181–184 · DOI: 10.33545/26649926.2025.v7.i4c.738 ↗
Research areasGlycosylation and Glycoproteins ResearchViral Infectious Diseases and Gene Expression in InsectsMonoclonal and Polyclonal Antibodies Research
Abstract
Author-writtenLeading regulatory scientists have argued that Fc glycosylation is the single most important quality attribute distinguishing one monoclonal antibody (mAb) product from another. This research characterised the N-linked glycoform profiles of an innovator mAb (trastuzumab) and two biosimilar candidates expressed in CHO-K1 cells, then mapped each glycoform's effect on Fcγ receptor binding and antibody-dependent cellular cytotoxicity (ADCC). Glycan analysis by hydrophilic interaction liquid chromatography with fluorescence detection (HILIC-FLD) and mass spectrometry identified 14 distinct glycoforms across the three products. The dominant species in all cases was core-fucosylated agalactosylated biantennary (G0F), ranging from 36.2% to 41.3%. Afucosylated species differed most between products (6.8-7.6%), and even this narrow range translated into a 1.7-fold difference in FcγRIIIa V158 binding affinity. ADCC potency, measured in an NFAT-luciferase reporter assay, correlated strongly with afucosylation level (r = 0.93, P
Summary
Source-checkedPlain-language reading of the full paper, prepared with AI and checked against the text. Each point links to the authors' own words.
Why it matters
- Fc glycosylation is considered by regulatory scientists to be the most critical quality attribute that differentiates monoclonal antibody products. View evidence ↗
- The glycan profile of a therapeutic antibody's Fc region can significantly impact its immunogenicity, pharmacokinetics, and effector functions. View evidence ↗
- The absence of core fucosylation is the most impactful modification, as it can increase binding to FcγRIIIa on natural killer cells by up to 50-fold, which greatly enhances antibody-dependent cellular cytotoxicity (ADCC). View evidence ↗
The question
- The study aimed to characterize N-linked glycoform profiles of trastuzumab and two biosimilars produced in CHO-K1 cells to determine how these glycoforms affect ADCC and Fcγ receptor binding. View evidence ↗
What they did
- The materials analyzed included the innovator product Herceptin (lot 2022-H43) and two biosimilar candidates, Biosimilar A and Biosimilar B. View evidence ↗
- Researchers used mass spectrometry and hydrophilic interaction liquid chromatography with fluorescence detection (HILIC-FLD) to identify 14 different glycoforms. View evidence ↗
- Surface plasmon resonance (Biacore T200) was used to measure binding to FcRn and various human Fcγ receptors, including FcγRIIa, FcγRIIb, and FcγRIIIa (V158 and F158 allotypes). View evidence ↗
- ADCC was measured using an NFAT-luciferase reporter bioassay with SK-BR-3 target cells and a 6:1 effector-to-target ratio. View evidence ↗
What they found
- The most prevalent glycoform across all three products was core-fucosylated agalactosylated biantennary (G0F), with levels between 36.2% and 41.3%. View evidence ↗
- Biosimilar A's higher afucosylation level (7.6%) compared to Biosimilar B (6.8%) resulted in a 1.7-fold increase in binding to FcγRIIIa V158. View evidence ↗
- ADCC potency showed a strong correlation with afucosylation levels (r = 0.93, P<0.01), with Biosimilar A exhibiting 8.4% higher ADCC than the innovator. View evidence ↗
- High-mannose species (Man5) caused a modest reduction in FcRn binding at pH 6.0, measuring 0.87-0.97 relative to G0F. View evidence ↗
What it means
- The authors conclude that because afucosylation differences of less than one percentage point can measurably shift FcγRIIIa affinity, strict glycosylation control is necessary during manufacturing. View evidence ↗
- The authors recommend that biosimilar developers use glycoform-resolved Fc receptor binding in similarity assessments instead of relying solely on aggregate ADCC data. View evidence ↗
- A limitation of the study is that only one lot of each product was analyzed, meaning lot-to-lot variability in glycosylation was not assessed. View evidence ↗
- The ADCC reporter bioassay measured NFAT pathway activation instead of actual target-cell lysis, which may lead to different potency values than primary NK-cell assays. View evidence ↗
Visual summary
3 visualsIllustrations explain the paper; charts are replotted from the paper's own table values.
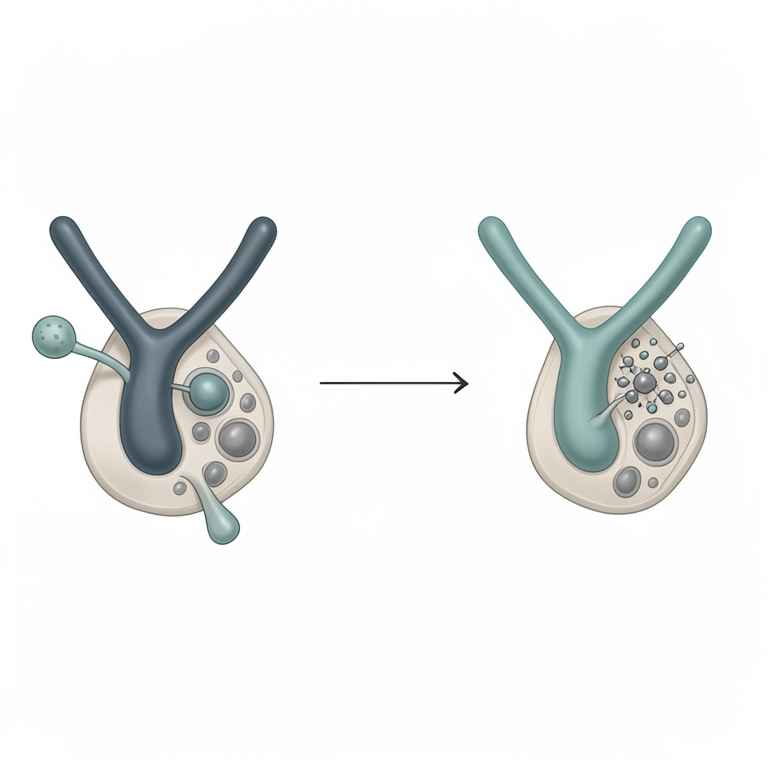
Impact of Afucosylation on ADCC
AI-generated conceptual illustration (monoclonal antibodies and natural killer cells). It explains the idea and does not show study data.
View source evidence ↗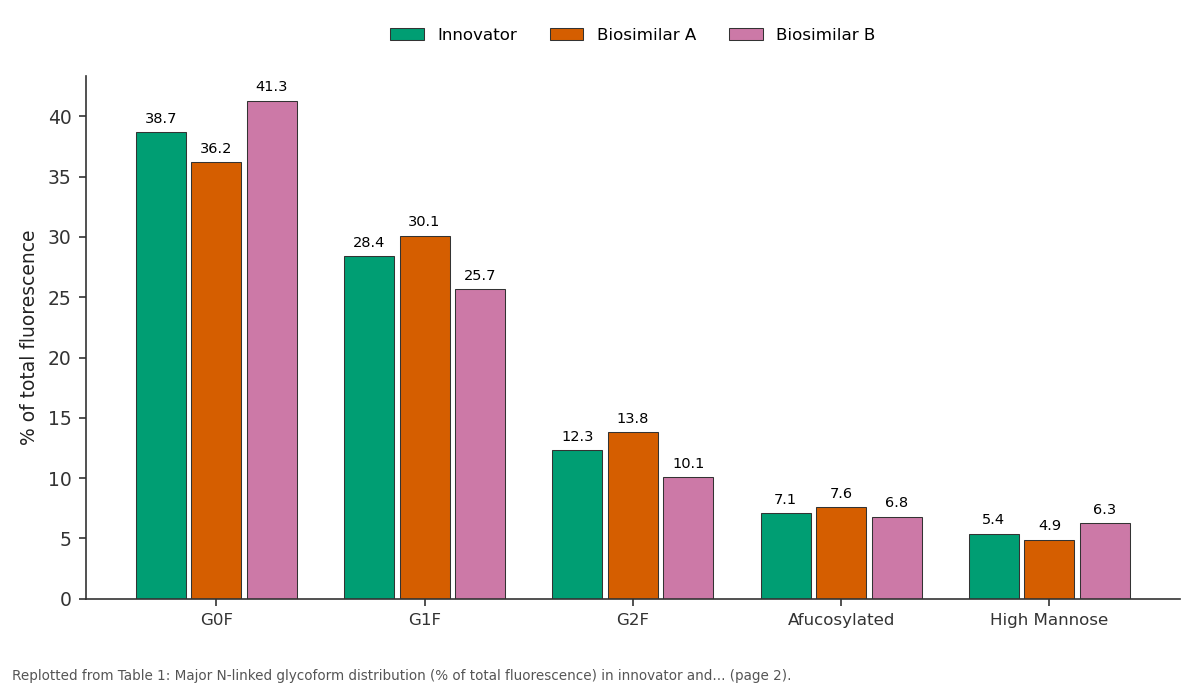
Innovator and Biosimilar A and more: G0F vs G1F vs G2F vs Afucosylated vs High Mannose
Replotted from Table 1 (page 2) of the original paper. Every bar is the paper's own table value.
View source evidence ↗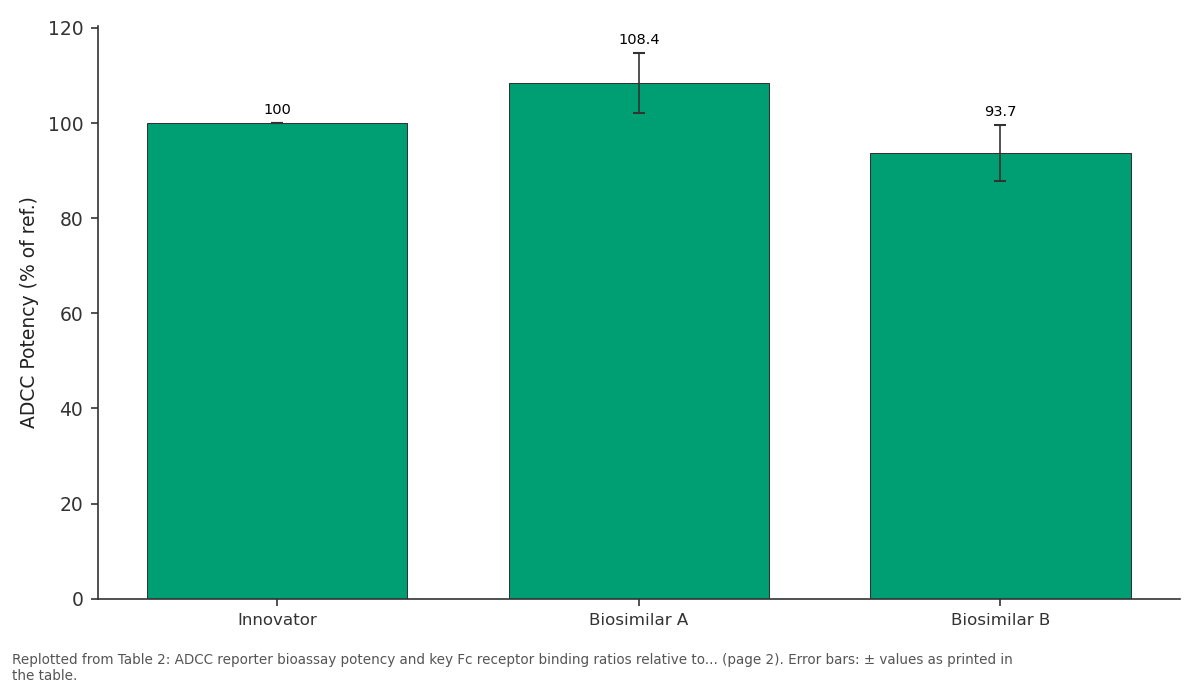
ADCC Potency (% of ref.): Innovator vs Biosimilar A vs Biosimilar B
Replotted from Table 2 (page 2) of the original paper. Every bar is the paper's own table value.
View source evidence ↗Figures & tables
From the original paper Table 1
 Table 2
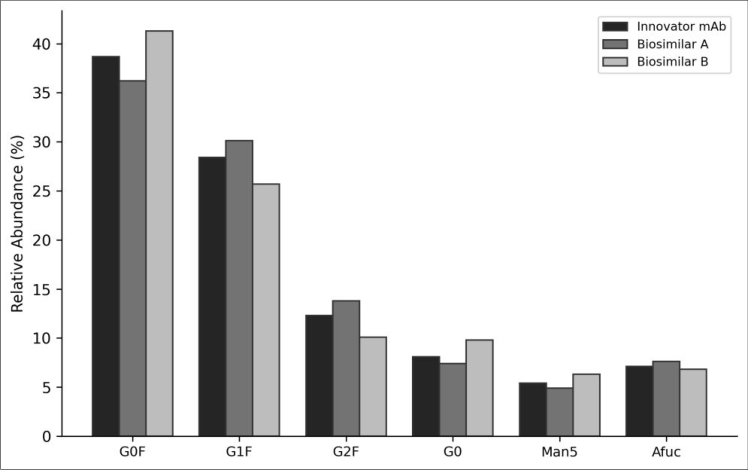 Figure 1
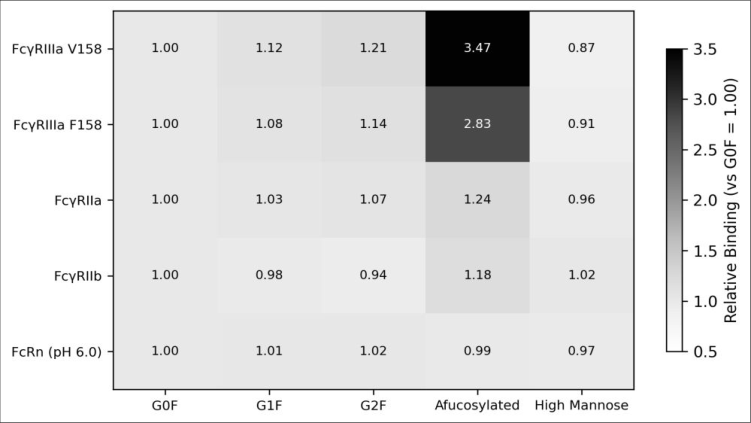 Figure 2
Introduction
As regulatory agencies worldwide have noted, the glycan profile attached to the Fc region of a therapeutic antibody can profoundly alter its effector functions, pharmacokinetics, and immunogenicity [1] . This view is echoed by the European Medicines Agency's biosimilar guideline, which identifies Fc glycosylation as a critical quality attribute requiring head-tohead comparison between an innovator and its proposed biosimilar [2] . All IgG1 antibodies carry a conserved N-linked glycan at asparagine-297 in the CH2 domain. The most common structures are biantennary complex-type glycans that may or may not carry a core fucose, one or two terminal galactose residues, and occasionally bisecting Nacetylglucosamine or sialic acid [3] . Core fucosylation is the single modification with the largest functional impact: its absence increases binding to FcγRIIIa on natural killer cells by up to 50-fold, dramatically boosting ADCC [4] . Despite decades of research, systematic comparisons that link individual glycoform levels in real therapeutic products to quantitative receptor-binding data remain scarce. Most published studies either characterise glycosylation without measuring function or report ADCC without resolving which glycoforms drive the effect. This research bridged that gap by performing detailed glycoform profiling of trastuzumab and two biosimilar candidates followed by glycoform-resolved Fcγ receptor binding and ADCC assays. All analytical and cell-based work was conducted at the Centro de Investigación Biológica del Altiplano, Aguascalientes, Mexico.
Quality Control
System suitability for HILIC-FLD was verified daily using a dextran ladder standard (Waters, Milford, MA). Glycan peak identification was confirmed by co-injection with individual glycan standards (Prozyme, Hayward, CA) and by orthogonal LC-MS analysis on a Thermo Q Exactive HF. Inter-day coefficients of variation for the six major glycoforms were below 4.8% across five replicate injections performed over three non-consecutive days.
Material and Methods
Material and Methods
Material
Trastuzumab innovator product (Herceptin®, Roche, lot 2022-H43) and two biosimilar candidates (designated Biosimilar A and Biosimilar B, obtained through materialtransfer agreements) were stored at 2-8 °C until analysis. PNGase F was sourced from New England Biolabs (P0704S). 2-aminobenzamide (2-AB) labelling reagent, HILIC columns (Waters ACQUITY BEH Amide, 1.7 μm), and dextran ladder standard were purchased from Waters Corporation. All work was performed at the Department of Metabolic Biochemistry, Centro de Investigación Biológica del Altiplano, Aguascalientes, between February and September 2023.
Methods
N-linked glycans were released by overnight PNGase F digestion at 37 °C, labelled with 2-AB by reductive amination, and purified on HILIC SPE cartridges. Labelled glycans were separated on a Waters ACQUITY UPLC H-Class system with fluorescence detection (λex 330 nm, λem 420 nm) using a 45-minute ammonium formate gradient [5] . Peak assignments were made by glucose unit (GU) values calibrated against the dextran ladder. Fcγ receptor binding was measured by surface plasmon resonance (Biacore T200, Cytiva) with recombinant human FcγRIIIa (V158 and F158 allotypes), FcγRIIa, FcγRIIb, and FcRn immobilised on CM5 sensor chips [6] . ADCC was quantified using a Promega ADCC Reporter Bioassay (NFAT-luciferase) with SK-BR-3 target cells at a 6:1 effector-to-target ratio. Correlations between individual glycoform abundance and functional readouts were tested by Pearson's r. All three products fell within published specification ranges for every major glycoform. Biosimilar A had the highest afucosylation level (7.6%), translating into a 1.7-fold increase in FcγRIIIa V158 binding relative to Biosimilar B (6.8%). ADCC potency correlated strongly with afucosylation level (r = 0.93, P<0.01). Biosimilar A showed 8.4% higher ADCC relative to the innovator, consistent with its marginally elevated afucosylated glycoform content. FcRn binding was comparable across products, with KD values ranging from 38.7 to 44.8 nM, suggesting that pharmacokinetic similarity should hold in vivo.
Results
Results
Discussion
The data presented here confirm that afucosylation is the glycoform feature with the largest impact on ADCCrelevant receptor binding, consistent with the landmark findings of Shields et al. [4] . Even though the three products differed by less than one percentage point in afucosylation (6.8-7.6%), this translated into a detectable 1.7-fold range in FcγRIIIa V158 binding, highlighting the sensitivity of effector function to minor glycan shifts. The high-mannose species showed a modest but reproducible reduction in FcRn binding at pH 6.0 (0.87-0.97 relative to G0F). Because FcRn-mediated recycling is the primary determinant of IgG serum half-life [7] , even small reductions could shorten drug exposure in patients, particularly if high-mannose content drifts upward during manufacturing scale-up [8] . Galactosylation (G1F, G2F) had minimal effect on FcγR binding but is known to modulate complement-dependent cytotoxicity through enhanced C1q recruitment [9] . For mAbs like trastuzumab, where ADCC is the dominant mechanism of action, galactose content may be less clinically relevant than afucosylation, but this assumption does not hold for mAbs that rely on CDC, such as rituximab. From a manufacturing perspective, these results reinforce the importance of cell-culture conditions that influence glycosylation, including dissolved oxygen, ammonia accumulation, and manganese supplementation [10] . Small upstream adjustments can shift afucosylation by 1-2 percentage points, which, as demonstrated here, is sufficient to alter functional outcomes. Biosimilar developers would benefit from including glycoform-resolved Fc receptor binding in their analytical similarity assessments rather than relying on aggregate ADCC readouts alone.
Limitations
Only one lot of each product was analysed; lot-to-lot variability, which is known to affect glycosylation, was not captured. The SPR binding assay uses purified Fcγ receptors in isolation, which may not fully reflect the avidity effects that occur on cell surfaces. The ADCC reporter bioassay measures NFAT pathway activation rather than actual target-cell lysis, and potency values may differ from those obtained in primary NK-cell assays.
Conclusion
Glycoform profiling of trastuzumab and two biosimilar candidates confirmed that core fucosylation is the dominant glycan modifier of ADCC-relevant Fc receptor binding. Afucosylation levels differing by less than one percentage point produced measurable shifts in FcγRIIIa affinity, reinforcing the need for tight glycosylation control during biopharmaceutical manufacturing. High-mannose species may pose an additional concern through reduced FcRn binding, although the effect was modest at the levels observed. Multi-lot comparisons and primary NK-cell ADCC assays would add confidence to these conclusions.
Figures and tables from the paper
| Glycoform | Innovator | Biosimilar A | Biosimilar B | Specification Range | Functional Impact |
|---|---|---|---|---|---|
| G0F | 38.7 | 36.2 | 41.3 | 33-45% | Baseline |
| G1F | 28.4 | 30.1 | 25.7 | 22-34% | Moderate CDC |
| G2F | 12.3 | 13.8 | 10.1 | 8-16% | Enhanced CDC |
| Afucosylated | 7.1 | 7.6 | 6.8 | 4-10% | Enhanced ADCC |
| High Mannose | 5.4 | 4.9 | 6.3 | 3-8% | Reduced half-life |
Table text extracted from the original PDF; superscript letters are shown inline. The original table image is below.
View original table image
| Parameter | Innovator | Biosimilar A | Biosimilar B |
|---|---|---|---|
| ADCC Potency (% of ref.) | 100.0 | 108.4±6.3 | 93.7±5.8 |
| FcγRIIIa V158 KD (nM) | 187.3 | 164.1 | 212.8 |
| FcγRIIIa F158 KD (nM) | 443.7 | 398.2 | 481.4 |
| FcRn KD at pH 6.0 (nM) | 42.1 | 44.8 | 38.7 |
Table text extracted from the original PDF; superscript letters are shown inline. The original table image is below.
View original table image
References
14 in the original paper- Liu L. Antibody glycosylation and its impact on the pharmacokinetics and pharmacodynamics of monoclonal antibodies and Fc-fusion proteins. Journal of Pharmaceutical Sciences. 2015;104(6):1866-1884.
- European Medicines Agency. Guideline on similar biological medicinal products containing biotechnology-derived proteins as active substance: quality issues. EMA/CHMP/BWP/247713/2012.
- London: European Medicines Agency; 2014.
- Arnold JN, Wormald MR, Sim RB, Rudd PM, Dwek RA. The impact of glycosylation on the biological function and structure of human immunoglobulins. Annual Review of Immunology. 2007;25:21-50.
- Shields RL, Lai J, Keck R, et al. Lack of fucose on human IgG1 N-linked oligosaccharide improves binding to human FcγRIII and antibody-dependent cellular toxicity. Journal of Biological Chemistry. 2002;277(30):26733-26740.
- Reusch D, Tejada ML. Fc glycans of therapeutic antibodies as critical quality attributes. Glycobiology. 2015;25(12):1325-1334.
- Houde D, Peng Y, Berkowitz SA, Engen JR. Posttranslational modifications differentially affect IgG1 conformation and receptor binding. Molecular and Cellular Proteomics. 2010;9(8):1716-1728.
- Roopenian DC, Akilesh S. FcRn: the neonatal Fc receptor comes of age. Nature Reviews Immunology. 2007;7(9):715-725.
- Goetze AM, Liu YD, Zhang Z, et al. High-mannose glycans on the Fc region of therapeutic IgG antibodies increase serum clearance in humans. Glycobiology. 2011;21(7):949-959.
- Hodoniczky J, Zheng YZ, James DC. Control of recombinant monoclonal antibody effector functions by Fc N-glycan remodeling in vitro. Biotechnology Progress. 2005;21(6):1644-1652.
- Jefferis R. Recombinant antibody therapeutics: the impact of glycosylation on mechanisms of action. Trends in Pharmacological Sciences. 2009;30(7):356362.
- Thomann M, Reckermann K, Reusch D, Prasser J, Trunschke A. Fc-galactosylation modulates antibodydependent cellular cytotoxicity of therapeutic antibodies. Molecular Immunology. 2016;73:69-75.
- Yu M, Brown D, Reed C, et al. Production, characterization, and pharmacokinetic properties of antibodies with N-linked mannose-5 glycans. MAbs. 2012;4(4):475-487.
- Cymer F, Beck H, Seefeldt MB, Rauch A. Therapeutic monoclonal antibody N-glycosylation-structure, function and therapeutic potential. Biologicals. 2018;52:1-11.