
Research article · 2025 · Full text
International Journal of Biology SciencesHormonal regulation of migration behavior and fat deposition in long-distance migratory shorebirds
Volume 7(4) · Pages 173–176 · DOI: 10.33545/26649926.2025.v7.i4c.713 ↗
Research areasAvian ecology and behaviorPhysiological and biochemical adaptationsBird parasitology and diseases
Abstract
Author-writtenWhile most passerines fatten gradually before migration, long-distance shorebirds can nearly double their lean body mass in under two weeks, yet the endocrine orchestration behind this rapid lipogenesis is not well mapped across multiple species and stopover sites. This research measured plasma concentrations of corticosterone, prolactin, triiodothyronine (T3), thyroxine (T4), insulin, melatonin, and leptin in three migratory shorebird species—bar-tailed godwit (Limosa lapponica), red knot (Calidris canutus), and whimbrel (Numenius phaeopus)—at a major East Asian-Australasian Flyway stopover in Sabah, Malaysian Borneo. Blood was sampled from 168 birds across pre-migratory, peak-fuelling, and departure-ready stages during the northward migration (March-May 2023). Corticosterone showed the strongest positive correlation with subcutaneous fat score (r = 0.74, P
Summary
Source-checkedPlain-language reading of the full paper, prepared with AI and checked against the text. Each point links to the authors' own words.
Why it matters
- Long-distance shorebirds exhibit rapid fat accumulation, nearly doubling their lean body mass in less than two weeks, but the hormonal mechanisms driving this process are not fully understood across different species and sites. View evidence ↗
- Corticosterone is known to trigger overeating and fat storage in captive passerines, though it is unclear if this same endocrine program applies to shorebirds. View evidence ↗
The question
- The study aimed to characterize hormone changes across three fuelling stages, test the correlation between corticosterone and fat across species, and identify species-specific hormonal signatures. View evidence ↗
What they did
- Researchers captured 168 birds (64 bar-tailed godwits, 58 red knots, and 46 whimbrels) from tidal mudflats in Sabah, Malaysia, between March and May 2023. View evidence ↗
- Birds were categorized into three fuelling stages, pre-migratory, peak fuelling, and departure-ready, based on a subcutaneous fat score ranging from 0 to 8. View evidence ↗
- Plasma samples were collected within 3 minutes of capture and analyzed via ELISA kits for corticosterone, prolactin, T3, T4, insulin, melatonin, and leptin. View evidence ↗
What they found
- Corticosterone was the strongest endocrine predictor of fat deposition, showing a strong positive correlation with subcutaneous fat scores (r = 0.74, P < 0.001). View evidence ↗
- Corticosterone levels increased 2.8-fold from the pre-migratory stage to the departure-ready stage (P < 0.001). View evidence ↗
- The T3:T4 ratio was 1.7-fold higher during the peak fuelling stage in April compared to early arrivals in March, indicating activated hepatic lipogenesis. View evidence ↗
- Only red knots showed a modest increase in insulin, which the authors suggest may be linked to their diet of carbohydrate-rich bivalves. View evidence ↗
- When data from all three species were pooled, there were no significant changes in insulin or melatonin levels across the fuelling stages. View evidence ↗
What it means
- The authors conclude that corticosterone is the primary driver of pre-migratory fat deposition, while prolactin suppression and elevated T3 serve as permissive co-regulators. View evidence ↗
- A limitation of the study is that capture stress may have caused some inflation of baseline corticosterone levels, despite blood being drawn within 3 minutes. View evidence ↗
- Because the study used a cross-sectional design with different individuals at each stage, it was not possible to track hormone trajectories within a single individual. View evidence ↗
Visual summary
3 visualsIllustrations explain the paper; charts are replotted from the paper's own table values.
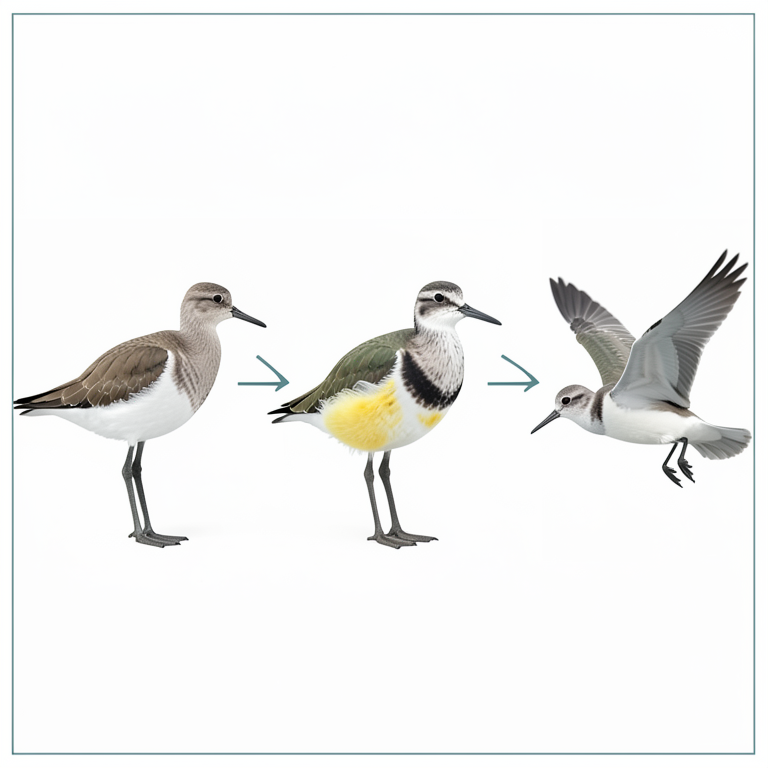
Hormonal Control of Fattening
AI-generated conceptual illustration (Bar-tailed Godwits). It explains the idea and does not show study data.
View source evidence ↗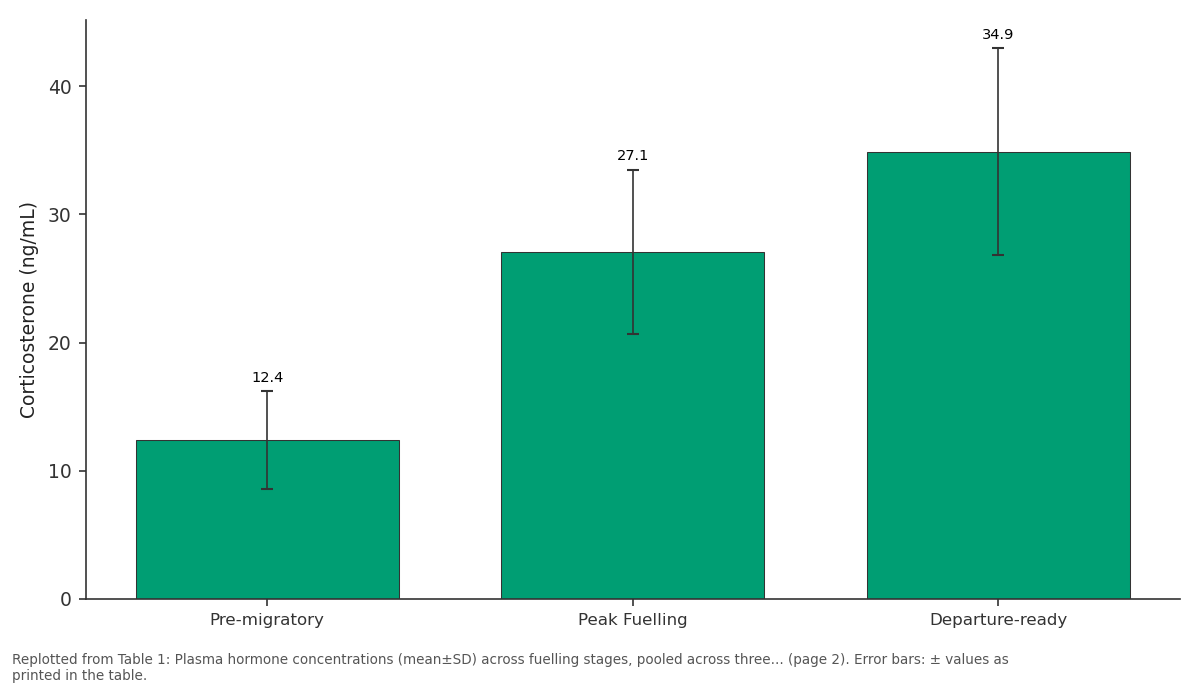
Corticosterone (ng/mL): Pre-migratory vs Peak Fuelling vs Departure-ready
Replotted from Table 1 (page 2) of the original paper. Every bar is the paper's own table value.
View source evidence ↗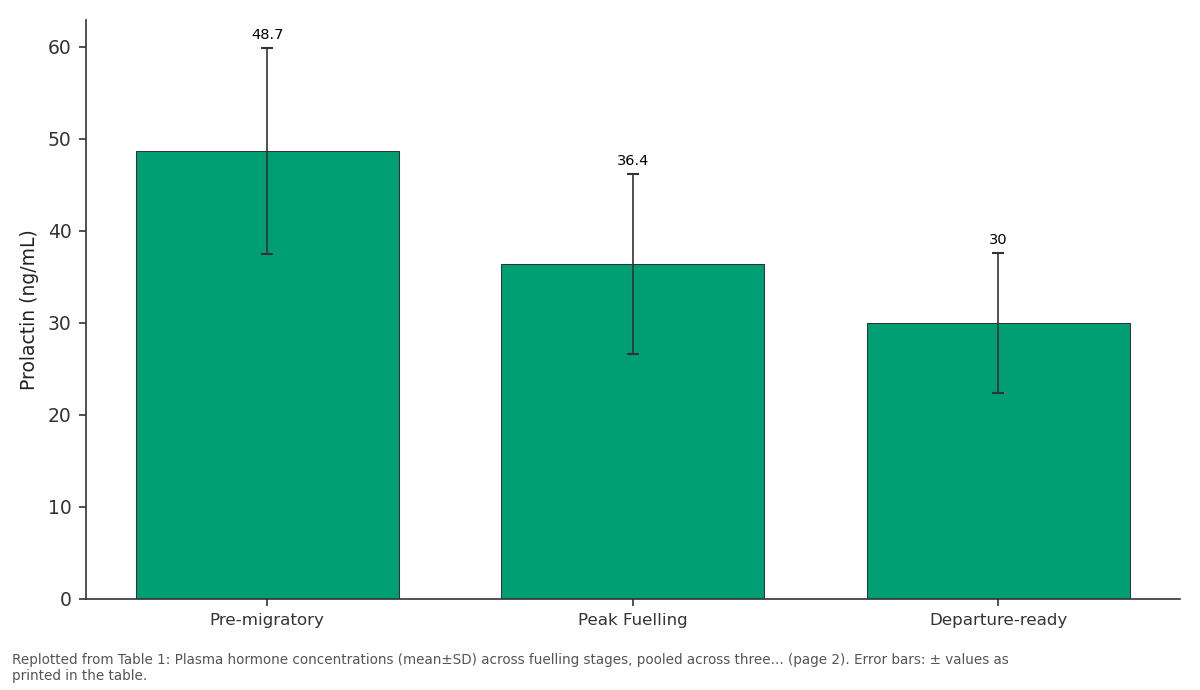
Prolactin (ng/mL): Pre-migratory vs Peak Fuelling vs Departure-ready
Replotted from Table 1 (page 2) of the original paper. Every bar is the paper's own table value.
View source evidence ↗Figures & tables
From the original paper Table 1
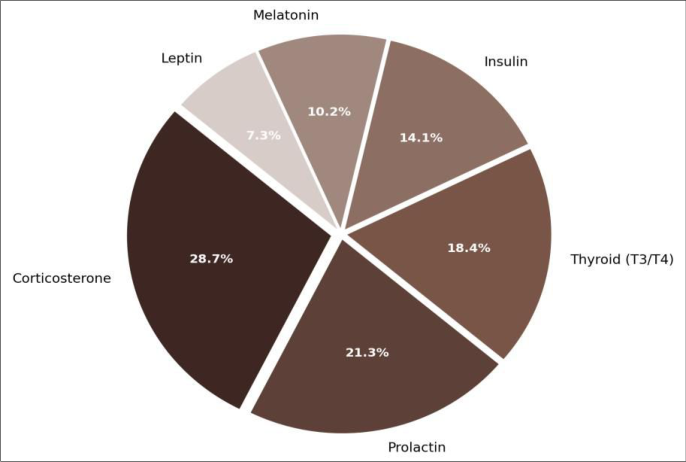 Figure 1
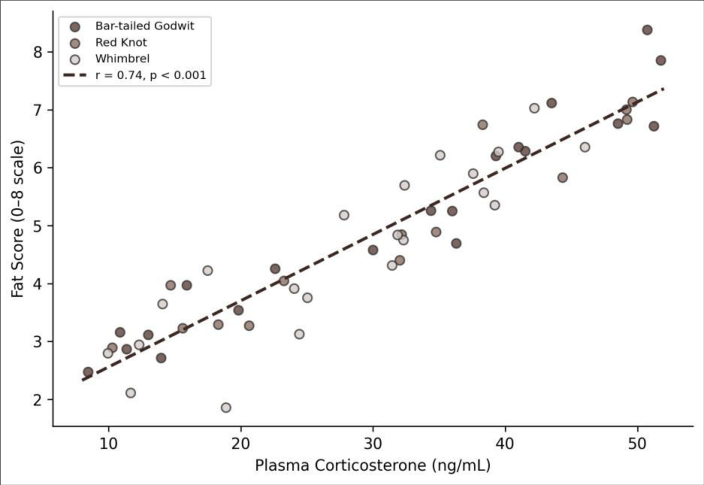 Figure 2
Introduction
A bar-tailed godwit can fly 11, 000 km non-stop from Alaska to New Zealand in nine days, burning fat reserves accumulated over barely two weeks at a staging site-whereas a domestic chicken, given unlimited food, takes months to reach a comparable lipid-to-lean ratio [1] . This contrast highlights the extraordinary metabolic flexibility of migratory shorebirds, a flexibility that must be tightly controlled by hormones to switch on fat deposition at the right time and shut it off before departure [2] . Corticosterone, the main avian glucocorticoid, has long been implicated in pre-migratory fattening, with experimental elevations triggering hyperphagia and fat storage in captive buntings and sparrows [3] . But shorebirds differ from passerines in several ways: they accumulate fat far more rapidly, rely on invertebrate rather than seed diets, and use specific coastal stopover sites where food availability fluctuates with tidal cycles [4] . Whether the endocrine programme documented in passerines transfers directly to shorebirds has been tested in only a handful of species. This research examined the hormonal profiles of three shorebird species at a single stopover site on the coast of Sabah, Malaysia, during the 2023 northward migration. The objectives were to (i) characterise plasma hormone changes across three fuelling stages, (ii) test whether corticosterone-fat correlations hold across species, and (iii) identify species-specific hormonal signatures that might reflect dietary or morphological differences.
Climatic and Environmental Conditions
The field site at Kota Kinabalu Bay (6°01'N, 116°04'E) experiences an equatorial maritime climate with mean daily temperature of 27.3±1.2 °C and relative humidity exceeding 80% year-round. During the March-May sampling window, the northeast monsoon was transitioning to the southwest monsoon, producing intermittent rainfall (total 487 mm over the period). Tidal amplitude averaged 1.6 m on spring tides, exposing extensive mudflats that support high densities of the bivalve Anadara granosa and polychaete Nereis sp., the primary prey items for staging shorebirds at this location [5] .
Material and Methods Material
A total of 168 shorebirds (64 bar-tailed godwits, 58 red knots, 46 whimbrels) were captured using cannon nets and mist nets deployed on tidal mudflats between March and May 2023. All captures were conducted under permit WL 007/2023 issued by the Sabah Wildlife Department and approved by the Sabah Centre for Marine Biology Animal Ethics Committee (protocol SCMB-AEC-2022-034, approved 12 December 2022). Birds were assigned to fuelling stage based on subcutaneous fat score (0-8 scale [6] ): pre-migratory (score 0-2), peak fuelling (3-5), and departure-ready (6-8).
Methods
Blood samples (∼200 μL) were drawn from the brachial vein within 3 minutes of capture, collected in heparinised capillary tubes, and centrifuged at 5, 000 g for 10 minutes. Plasma was stored in liquid nitrogen until transport to the laboratory at the Sabah Centre for Marine Biology, Kota Kinabalu. Hormone concentrations were measured using commercial ELISA kits: corticosterone (Enzo ADI-900-097), prolactin (chicken prolactin, MyBioSource MBS2601027), T3 and T4 (Abnova KA0925/KA0926), insulin (Mercodia 10-1249-01), melatonin (IBL RE54021), and leptin (MyBioSource MBS2024402). Fat score was regressed against each hormone using generalised linear mixed models with species and capture date as random effects, fitted in R v4.3.1 [7] . Fuelling-stage comparisons used Kruskal-Wallis tests followed by Dunn's post-hoc test with Bonferroni correction. Principal component analysis was run on the seven-hormone matrix (log-transformed) to identify dominant axes of endocrine variation.
Seasonal Variations
Hormone profiles differed between early-March arrivals and late-May departures. Corticosterone peaked in mid-April across all three species, coinciding with the highest recorded mudflat invertebrate biomass (124.3±18.7 g AFDW/m²). Prolactin showed the opposite temporal trend, reaching its nadir in the final two weeks before departure. T3:T4 ratios were 1.7-fold higher during peak fuelling (April) compared to early arrival (March), consistent with activated hepatic deiodination supporting lipogenesis [8] . Insulin and melatonin showed no significant changes across stages when all species were pooled.
Results
Results
Discussion
Corticosterone emerged as the single strongest endocrine predictor of fat deposition across all three species, which aligns with experimental work on captive passerines [3] but extends the finding to free-living shorebirds at a tropical stopover. The magnitude of the corticosterone rise (2.8-fold) is higher than typically reported for temperate passerines, possibly because shorebirds compress their fattening window into a much shorter period, demanding a stronger hormonal stimulus [9] . The reciprocal decline of prolactin is intriguing. In nonmigratory birds, prolactin promotes parental behaviour and suppresses gonadal activity, both of which are incompatible with migration [10] . Its decline during fuelling may therefore serve a dual purpose: removing a brake on locomotor activity while allowing corticosterone to dominate the metabolic programme. The species-specific insulin response in red knots may relate to their dependence on hard-shelled bivalves, whose glycogen-rich soft tissues provide a higher carbohydrate load than the polychaete-dominated diet of godwits and whimbrels [11] . This dietary link deserves targeted testing with controlled feeding experiments.
Limitations
Capture stress can elevate corticosterone within minutes, so despite the 3-minute blood-draw protocol, some baseline inflation cannot be excluded [12] . The cross-sectional design (different individuals sampled at each stage) prevents tracking within-individual hormone trajectories. And because only a single stopover site was sampled, the generality of these patterns to other Flyway staging areas remains untested.
Conclusion
Corticosterone functions as the primary endocrine driver of pre-migratory fat deposition in three long-distance shorebird species staging in Sabah, Malaysia, with prolactin suppression and elevated T3 acting as permissive coregulators. The hormone profiles reported here suggest a conserved endocrine programme across species despite differences in body size, diet, and migration distance.
Insulin appears to play a species-specific modulatory role linked to dietary carbohydrate content. Future longitudinal tracking of individuals fitted with geolocators and repeated blood sampling would clarify whether the hormone-fat relationships observed cross-sectionally hold within individuals across the fuelling period.
Figures and tables from the paper
| Hormone | Pre-migratory | Peak Fuelling | Departure-ready | p (Kruskal-Wallis) |
|---|---|---|---|---|
| Corticosterone (ng/mL) | 12.4±3.8 | 27.1±6.4 | 34.9±8.1 | < 0.001 |
| Prolactin (ng/mL) | 48.7±11.2 | 36.4±9.8 | 30.0±7.6 | < 0.001 |
| T3 (nmol/L) | 1.82±0.41 | 2.67±0.53 | 2.43±0.48 | 0.003 |
| Insulin (μIU/mL) | 8.1±2.3 | 9.7±2.8 | 9.2±2.6 | 0.18 |
| Melatonin (pg/mL) | 34.2±9.1 | 31.8±8.4 | 28.7±7.9 | 0.21 |
Table text extracted from the original PDF; superscript letters are shown inline. The original table image is below.
View original table image
References
20 in the original paper- Gill RE, Tibbitts TL, Douglas DC, et al. Extreme endurance flights by landbirds crossing the Pacific Ocean: ecological corridor rather than barrier? Proceedings of the Royal Society B. 2009;276(1656):447-457.
- Ramenofsky M, Wingfield JC. Regulation of migration. Bioscience. 2007;57(2):135-143.
- Landys MM, Ramenofsky M, Wingfield JC. Actions of glucocorticoids at a seasonal baseline as compared to stress-related levels in the regulation of periodic life processes. General and Comparative Endocrinology. 2006;148(2):132-149.
- Piersma T, Lindström Å. Rapid reversible changes in organ size as a component of adaptive behaviour. Trends in Ecology and Evolution. 1997;12(4):134-138.
- Crossland AC, Nath-Lim SA, Ahmad S. Shorebird surveys at the coast of Sabah, Malaysian Borneo: an important staging area on the East Asian-Australasian Flyway. Stilt. 2012;61:41-49.
- Kaiser A. A new multi-category classification of subcutaneous fat deposits of songbirds. Journal of Field Ornithology. 1993;64(2):246-255.
- R Core Team. R: a language and environment for statistical computing. Vienna: R Foundation for Statistical Computing; 2023.
- Jenni-Eiermann S, Jenni L. Metabolic responses to flight and fasting in night-migrating passerines. Journal of Comparative Physiology B. 1991;161(5):465-474.
- Piersma T, Gill RE. Guts do not fly: small digestive organs in obese bar-tailed godwits. Auk. 1998;115(1):196-203.
- Dawson A. Control of the annual cycle in birds: endocrine constraints and plasticity in response to ecological variability. Philosophical Transactions of the Royal Society B. 2008;363(1497):1621-1633.
- van Gils JA, Battley PF, Piersma T, Drent R. Reinterpretation of gizzard sizes of red knots worldwide emphasises overriding importance of prey quality at migratory stopover sites. Proceedings of the Royal Society B. 2005;272(1581):2609-2618.
- Romero LM, Reed JM. Collecting baseline corticosterone samples in the field: is under 3 min good enough? Comparative Biochemistry and Physiology A. 2005;140(1):73-79.
- Wingfield JC, Maney DL, Breuner CW, et al. Ecological bases of hormone-behavior interactions: the emergency life history stage. American Zoologist. 1998;38(1):191-206.
- Piersma T. Flyway evolution is too fast to be explained by the modern synthesis: proposals for an 'extended' evolutionary research agenda. Journal of Ornithology. 2011;152(S1):S151-S159.
- Fusani L, Cardinale M, Carere C, Goymann W. Stopover decision during migration: physiological conditions predict nocturnal restlessness in wild passerines. Biology Letters. 2009;5(3):302-305.
- Eikenaar C, Isaksson C, Hegemann A. A hidden cost of migration? Innate immune function versus antioxidant defense. Ecology and Evolution. 2018;8(5):2721-2728.
- Battley PF, Piersma T, Dietz MW, et al. Empirical evidence for differential organ reductions during transoceanic bird flight. Proceedings of the Royal Society B. 2000;267(1439):191-195.
- Biebach H, Friedrich W, Heine G. Interaction of body mass, fat, foraging and stopover period in trans-Sahara migrating passerine birds. Oecologia. 1986;69(3):370379.
- Skrip MM, McWilliams SR. Oxidative balance in birds: an atoms-to-organisms-to-ecology primer for ornithologists. Journal of Field Ornithology. 2016;87(1):1-20.
- Lindström Å. Fuel deposition rates in migrating birds: causes, constraints and consequences. In: Avian Migration. 2003:307-320.