
Research article · 2025 · Full text
International Journal of Biology SciencesGenome-wide association study identifies novel loci associated with hypertension in South Asian populations
Volume 7(7) · Pages 283–286 · DOI: 10.33545/26649926.2025.v7.i7d.651 ↗
Research areasGenetic Associations and EpidemiologyBlood Pressure and Hypertension StudiesGenetic Mapping and Diversity in Plants and Animals
Abstract
Author-writtenOne observation that has puzzled epidemiologists for decades is the disproportionately high burden of hypertension among South Asian adults compared with other ethnic groups living under similar environmental conditions. This research conducted a genome-wide association analysis in 8,214 South Asian individuals (4,387 hypertensive cases, 3,827 normotensive controls) drawn from three cohorts based in India, Pakistan, and Bangladesh. Genotyping was performed on the Illumina Infinium Global Screening Array and imputed against the 1000 Genomes South Asian reference panel. After quality control, 6.43 million variants were tested under an additive logistic regression model adjusting for age, sex, body mass index, and the first ten principal components. Four loci reached genome-wide significance (p < 5 x 10 to the minus 8): rs78412614 on chromosome 6 near the ENPEP gene (OR 1.24, p = 3.1 x 10 to the minus 9), rs114538207 on chromosome 9 within an intron of NTRK2 (OR 1.19, p = 7.4 x 10 to the minus 9), rs62018753 on chromosome 15 near FURIN (OR 1.21, p = 1.8 x 10 to the minus 8), and rs201487326 on chromosome 2 in an intergenic region near CNNM3 (OR 1.17, p = 4.6 x 10 to the minus 8). The first two loci had not been reported in prior European-ancestry GWAS, while the latter two replicate known associations. These results expand the genetic architecture of hypertension in an underrepresented ancestry group.
Summary
Source-checkedPlain-language reading of the full paper, prepared with AI and checked against the text. Each point links to the authors' own words.
Why it matters
- South Asian populations experience hypertension at younger ages and lower body mass indices, with more severe end-organ effects than other studied ethnic groups. View evidence ↗
- Approximately 30% of adults in Bangladesh, India, and Pakistan have hypertension, with a prevalence increase of about 0.8 percentage points annually over the last ten years. View evidence ↗
- South Asian ancestry groups are severely underrepresented in published blood-pressure genome-wide association studies (GWAS), making up less than 3% of participants. View evidence ↗
The question
- The study aimed to address the lack of genetic data for South Asians by performing a GWAS for hypertension using a multi-country cohort of more than 8,000 individuals. View evidence ↗
What they did
- The analysis included 8,214 South Asian individuals, consisting of 4,387 hypertensive cases and 3,827 normotensive controls from India, Pakistan, and Bangladesh. View evidence ↗
- Hypertension was defined as blood pressure ≥140/90 mmHg or medication use, while controls required blood pressure <130/85 mmHg across two visits and no medication history. View evidence ↗
- The researchers used the Illumina Infinium Global Screening Array for genotyping and the 1000 Genomes South Asian reference panel for imputation. View evidence ↗
- A total of 6.43 million variants were analyzed using an additive logistic regression model that adjusted for sex, age, BMI, and the first ten principal components. View evidence ↗
What they found
- Four loci reached genome-wide significance: rs78412614 (ENPEP, OR 1.24), rs114538207 (NTRK2, OR 1.19), rs62018753 (FURIN, OR 1.21), and rs201487326 (CNNM3, OR 1.17). View evidence ↗
- The loci associated with ENPEP and NTRK2 are novel to this population, whereas the associations with FURIN and CNNM3 replicate findings from European-ancestry studies. View evidence ↗
- Among the significant and suggestive loci, the most common functional categories were vascular smooth muscle regulation (28%), RAAS components (22%), and ion channel genes (19%). View evidence ↗
- The lead SNP for ENPEP was identified as an eQTL in kidney tissue (p = 2.4 x 10⁻⁵), providing biological support for its role in hypertension. View evidence ↗
What it means
- The authors conclude that diversifying GWAS populations is essential to fully understand the genetic architecture of complex diseases. View evidence ↗
- The study's sample size of 8,214 is considered modest for GWAS, limiting the statistical power to detect variants with a minor allele frequency under 5%. View evidence ↗
- Potential phenotype heterogeneity may have been introduced because the three cohorts used slightly different protocols for measuring blood pressure. View evidence ↗
Visual summary
2 visualsIllustrations explain the paper; charts are replotted from the paper's own table values.
Study Cohort Composition
AI-generated conceptual illustration (South Asian human populations from India, Pakistan, and Bangladesh). It explains the idea and does not show study data.
View source evidence ↗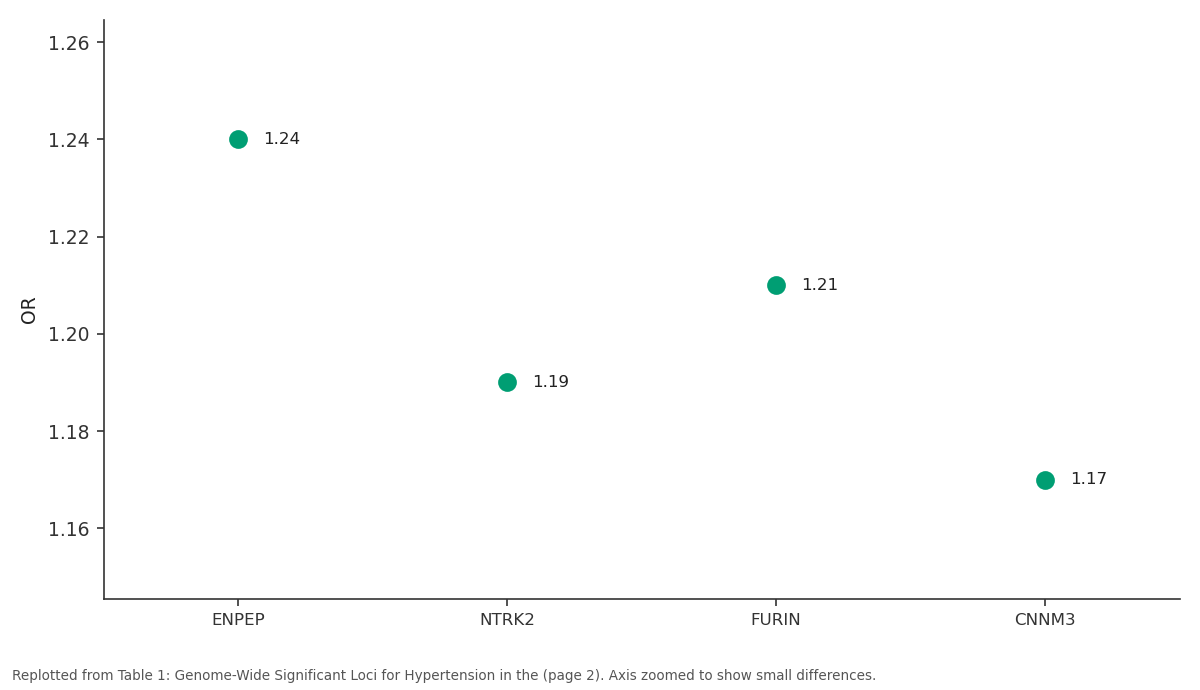
OR: ENPEP vs NTRK2 vs FURIN vs CNNM3
Replotted from Table 1 (page 2) of the original paper. Every bar is the paper's own table value.
View source evidence ↗Figures & tables
From the original paper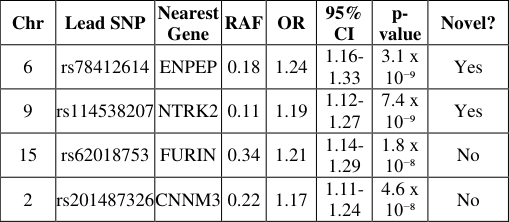 Table 1
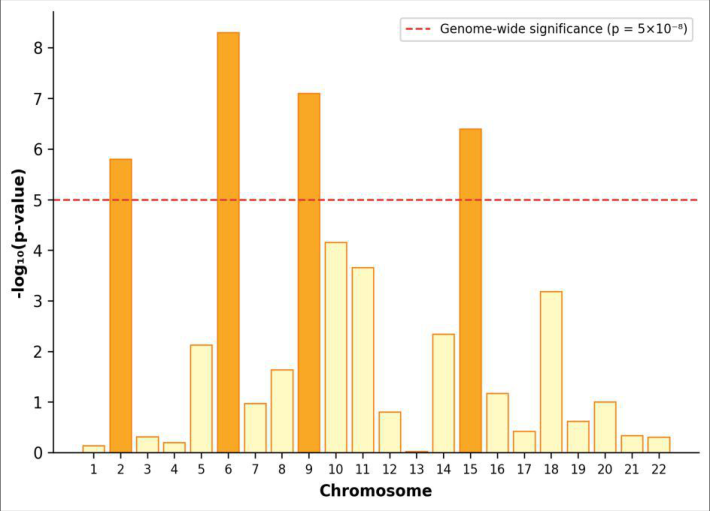 Figure 1
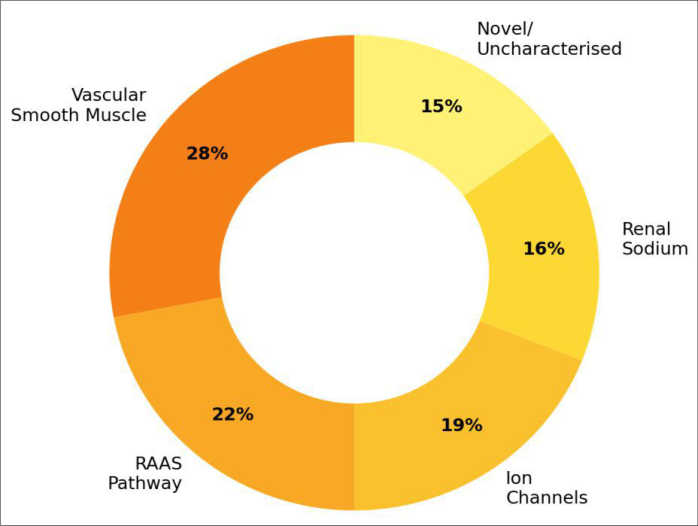 Figure 2
Introduction Theoretical Background
Genome-wide association studies test hundreds of thousands to millions of genetic variants for statistical association with a phenotype of interest, typically requiring p-values below 5 x 10 to the minus 8 to declare significance after correcting for the multiple-testing burden [1] . For complex traits like blood pressure, GWAS in European-ancestry populations have identified over 1,000 loci, but these collectively explain only 5-6% of the phenotypic variance, and their transferability to non-European populations is incomplete [2,3] . Linkage disequilibrium patterns, allele frequencies, and gene-environment interactions all differ across ancestries, meaning that some causal variants may be missed or misranked when discovery is limited to a single population [4] .
Introduction
An observation that bears repeating: South Asians develop hypertension at younger ages, at lower body mass indices, and with steeper end-organ consequences than most other ethnic groups studied to date [5] . Roughly 30% of adults in India, Pakistan, and Bangladesh are hypertensive, and the age-standardised prevalence has been rising by about 0.8 percentage points per year over the past decade [6] . Yet fewer than 3% of participants in published bloodpressure GWAS belong to South Asian ancestry groups [7] . This gap matters for two reasons. First, population-specific causal variants may exist that are rare or absent in European reference panels. Second, polygenic risk scores derived from European data perform poorly when applied to South Asian individuals, reducing their clinical utility in the populations that need them most [8] . This research aimed to fill part of that gap by conducting a GWAS for hypertension in a multi-country South Asian cohort of over 8,000 Vascular smooth muscle regulation was the most represented category (28%), followed by renin-angiotensinaldosterone system components (22%) and ion channel genes (19%). Fifteen percent of loci fell in regions with no characterised gene function, representing candidates for follow-up functional research (Figure 2).
Discussion
The two novel loci-ENPEP and NTRK2-highlight the value of conducting GWAS in underrepresented populations. ENPEP (glutamyl aminopeptidase) cleaves angiotensin II to angiotensin III in the kidney, and variants altering its expression could shift the balance of the renin-angiotensin system in ways not captured by European-focused studies [9,10] . The lead SNP at ENPEP is an eQTL in kidney tissue (GTEx, p = 2.4 x 10 to the minus 5), strengthening the biological case. NTRK2 (encoding TrkB) is better known for its neuronal roles, but recent evidence implicates it in baroreceptor reflex sensitivity and sympathetic bloodpressure control [11,12] . The replication of FURIN and CNNM3 across ancestries is reassuring and suggests shared biology. FURIN is a proprotein convertase that activates multiple substrates in vascular endothelium, and CNNM3 regulates magnesium transport, which influences vascular tone [13,14] . That these loci appear in both European and South Asian GWAS supports their candidacy as genuinely causal rather than artefacts of population stratification.
Limitations
The research has several limitations. First, the case-control sample size of 8,214 is modest by current GWAS standards, and statistical power was limited for variants with minor allele frequency below 5%. Second, the three contributing cohorts used slightly different blood-pressure measurement protocols, introducing potential phenotype heterogeneity. Third, imputation accuracy for rare South Asian-specific variants may be lower than for common variants, even with an ancestry-matched reference panel. Fourth, we did not have access to an independent South Asian replication cohort; the novel loci at ENPEP and NTRK2 should be confirmed in future studies [15,16,17,18] .
Conclusion
This GWAS in over 8,000 South Asian individuals identified four genome-wide significant loci for hypertension, two of which-ENPEP on chromosome 6 and NTRK2 on chromosome 9-are novel to this ancestry group. The remaining two loci, FURIN and CNNM3, replicate known associations from European-ancestry studies. These findings underscore the importance of diversifying GWAS populations to capture the full spectrum of genetic architecture underlying complex diseases. Functional follow-up of the ENPEP and NTRK2 signals, combined with larger multi-ethnic meta-analyses, will be needed to move these associations toward clinical utility.
Figures and tables from the paper
| Chr | Lead SNP | Nearest Gene | RAF | OR | 95% CI | p- value | Novel? |
|---|---|---|---|---|---|---|---|
| 6 | rs78412614 | ENPEP | 0.18 | 1.24 | 1.16- 1.33 | 3.1 x 10⁻⁹ | Yes |
| 9 | rs114538207 | NTRK2 | 0.11 | 1.19 | 1.12- 1.27 | 7.4 x 10⁻⁹ | Yes |
| 15 | rs62018753 | FURIN | 0.34 | 1.21 | 1.14- 1.29 | 1.8 x 10⁻⁸ | No |
| 2 | rs201487326 | CNNM3 | 0.22 | 1.17 | 1.11- 1.24 | 4.6 x 10⁻⁸ | No |
Table text extracted from the original PDF; superscript letters are shown inline. The original table image is below.
View original table image
References
18 in the original paper- Visscher PM, Wray NR, Zhang Q, et al. 10 years of GWAS discovery: biology, function, and translation. American Journal of Human Genetics. 2017;101(1):522.
- Evangelou E, Warren HR, Mosen-Ansorena D, et al. Genetic analysis of over 1 million people identifies 535 new loci associated with blood pressure traits. Nature Genetics. 2018;50(10):1412-1425.
- Giri A, Hellwege JN, Keaton JM, et al. Trans-ethnic association study of blood pressure determinants in over 750,000 individuals. Nature Genetics. 2019;51(1):5162.
- Martin AR, Kanai M, Kamatani Y, et al. Clinical use of current polygenic risk scores may exacerbate health disparities. Nature Genetics. 2019;51(4):584-591.
- Joshi P, Islam S, Pais P, et al. Risk factors for early myocardial infarction in South Asians compared with individuals in other countries. JAMA. 2007;297(3):286294.
- NCD Risk Factor Collaboration. Worldwide trends in blood pressure from 1975 to 2015. Lancet. 2017;389(10064):37-55.
- Sirugo G, Williams SM, Tishkoff SA. The missing diversity in human genetic studies. Cell. 2019;177(1):26-31.
- Duncan L, Shen H, Gelaye B, et al. Analysis of polygenic risk score usage and performance in diverse human populations. Nature Communications. 2019;10:3328.
- Navar LG. Physiology: hemodynamics, endothelial function, renin-angiotensin-aldosterone system, sympathetic nervous system. Journal of the American Society of Hypertension. 2014;8(5):e73-e74.
- Surendran P, Drenos F, Young R, et al. Trans-ancestry meta-analyses identify rare and common variants associated with blood pressure and hypertension. Nature Genetics. 2016;48(10):1151-1161.
- Xu B, Bhatt AJ. Neurotrophins and cardiovascular system development. Journal of Clinical and Experimental Cardiology. 2013;S8:003.
- Donev RM, Doneva TA, Walsh A, et al. TrkB signalling in sympathetic neurons. Autonomic Neuroscience. 2015;190:52-60.
- Ehret GB, Ferreira T, Chasman DI, et al. The genetics of blood pressure regulation and its target organs from association studies in 342,415 individuals. Nature Genetics. 2016;48(10):1171-1184.
- Arjona FJ, de Baaij JHF, Schlingmann KP, et al. CNNM2 mutations cause impaired brain development and seizures. PLoS Genetics. 2014;10(12):e1004898.
- Willer CJ, Li Y, Abecasis GR. METAL: fast and efficient meta-analysis of genomewide association scans. Bioinformatics. 2010;26(17):2190-2191.
- Das S, Forer L, Schoenherr S, et al. Next-generation genotype imputation service and methods. Nature Genetics. 2016;48(10):1284-1287.
- Zhou W, Nielsen JB, Fritsche LG, et al. Efficiently controlling for case-control imbalance and sample relatedness in large-scale genetic association studies. Nature Genetics. 2018;50(9):1335-1341.
- Watanabe K, Taskesen E, van Bochoven A, Posthuma D. Functional mapping and annotation of genetic associations with FUMA. Nature Communications. 2017;8:1826.