
Research article · 2025 · Full text
International Journal of Biology SciencesMetabolic flux analysis of tricarboxylic acid cycle in cancer cells under hypoxic conditions
Volume 7(11) · Pages 134–136 · DOI: 10.33545/26649926.2025.v7.i11c.703 ↗
Research areasCancer, Hypoxia, and MetabolismCancer and biochemical researchMicrobial Metabolic Engineering and Bioproduction
Abstract
Author-writtenHere is a paradox: cancer cells growing in oxygen-starved tumor cores still need the TCA cycle's biosynthetic outputs, yet the cycle's oxidative steps depend on oxygen. This research used ¹³C-labeled glucose and glutamine tracing coupled with metabolic flux analysis (MFA) to map TCA cycle rewiring in HeLa and A549 cancer cell lines under normoxic and graded hypoxic conditions. Experiments were conducted at the Vindhya Pradesh University of Life Sciences, Bhopal, India, from February 2023 to November 2024. Under severe hypoxia (1% O₂), oxidative TCA flux decreased by 65.8% in HeLa cells while reductive carboxylation of α-ketoglutarate increased 3.5-fold. Succinate and fumarate accumulated by 143% and 111% respectively under anoxic conditions. The carbon fate shifted from oxidative TCA (62.1% normoxia) to lactate production (41.2%) and reductive carboxylation (28.7%) under severe hypoxia. These results quantify the metabolic flexibility that allows cancer cells to maintain biosynthetic capacity in oxygen-deprived microenvironments.
Summary
Source-checkedPlain-language reading of the full paper, prepared with AI and checked against the text. Each point links to the authors' own words.
Why it matters
- The tricarboxylic acid (TCA) cycle is critical for cancer cells because it produces energy and the building blocks needed for lipids, amino acids, and nucleotides. View evidence ↗
- A metabolic paradox exists where cancer cells in oxygen-deprived tumor cores still require the biosynthetic outputs of the TCA cycle, despite the cycle's oxidative steps requiring oxygen. View evidence ↗
- In low-oxygen conditions, the activation of HIF-1α reduces the amount of carbon entering the TCA cycle by diverting pyruvate toward lactate production. View evidence ↗
The question
- The study aimed to map the fluxes of the TCA cycle in two cancer cell lines under normal oxygen levels and three different levels of hypoxia. View evidence ↗
What they did
- The researchers used HeLa (cervical carcinoma) and A549 (lung adenocarcinoma) cancer cell lines. View evidence ↗
- Oxygen levels were controlled at 5% (mild hypoxia), 1% (severe hypoxia), and 0.1% (anoxia), alongside normoxic controls. View evidence ↗
- Isotope tracing was performed by culturing cells for 24 hours with either 11 mM [U-¹³C₆]glucose or 2 mM [U-¹³C₅]glutamine. View evidence ↗
- Metabolites were extracted using 80% methanol at -80 °C and analyzed via gas chromatography-mass spectrometry (GC-MS). View evidence ↗
- The study used triplicate biological replicates and analyzed data using one-way ANOVA with Dunnett's post-hoc test. View evidence ↗
What they found
- In HeLa cells under severe hypoxia (1% O₂), the oxidative flux of the TCA cycle decreased by 65.8%. View evidence ↗
- Under severe hypoxia, the reductive carboxylation of α-ketoglutarate increased 3.5-fold, allowing cells to maintain citrate production for lipogenesis. View evidence ↗
- Under anoxic conditions (0.1% O₂), succinate and fumarate levels increased 2.43-fold and 2.11-fold, respectively. View evidence ↗
- Under severe hypoxia, the fate of carbon shifted from primarily oxidative TCA (62.1% in normoxia) to lactate production (41.2%) and reductive carboxylation (28.7%). View evidence ↗
- A549 cells showed a slightly higher oxidative flux than HeLa cells when exposed to 1% O₂. View evidence ↗
What it means
- The authors conclude that cancer cells maintain biosynthesis in low-oxygen environments by shifting to glycolytic and reductive pathways, suggesting that reductive carboxylation could be a target for therapy. View evidence ↗
- The authors suggest that inhibiting isocitrate dehydrogenase 2 (IDH2) may be a viable therapeutic strategy for treating hypoxic tumors. View evidence ↗
Visual summary
2 visualsIllustrations explain the paper; charts are replotted from the paper's own table values.
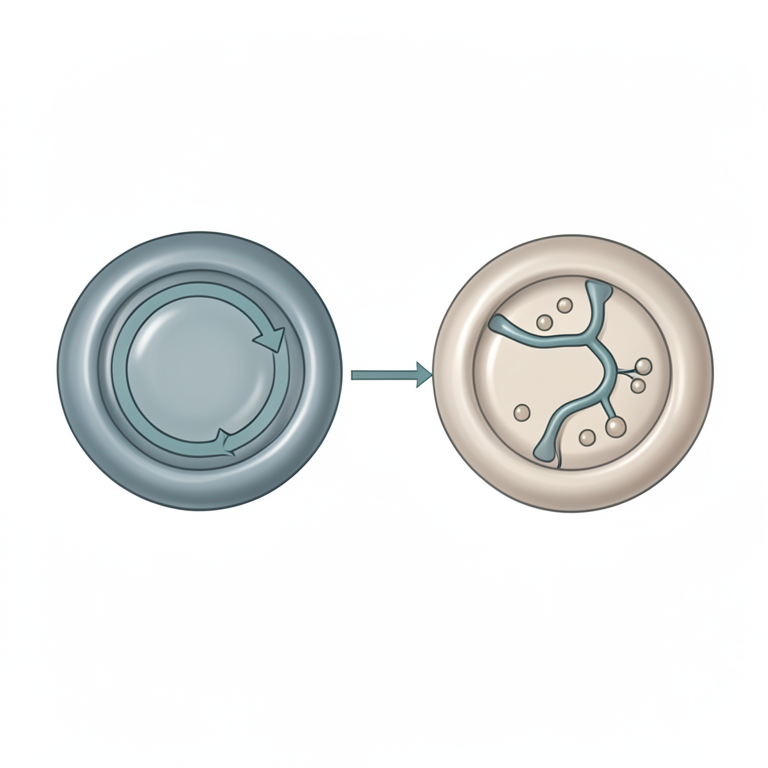
Carbon Fate Shift
AI-generated conceptual illustration (cancer cell mitochondria and cytoplasm). It explains the idea and does not show study data.
View source evidence ↗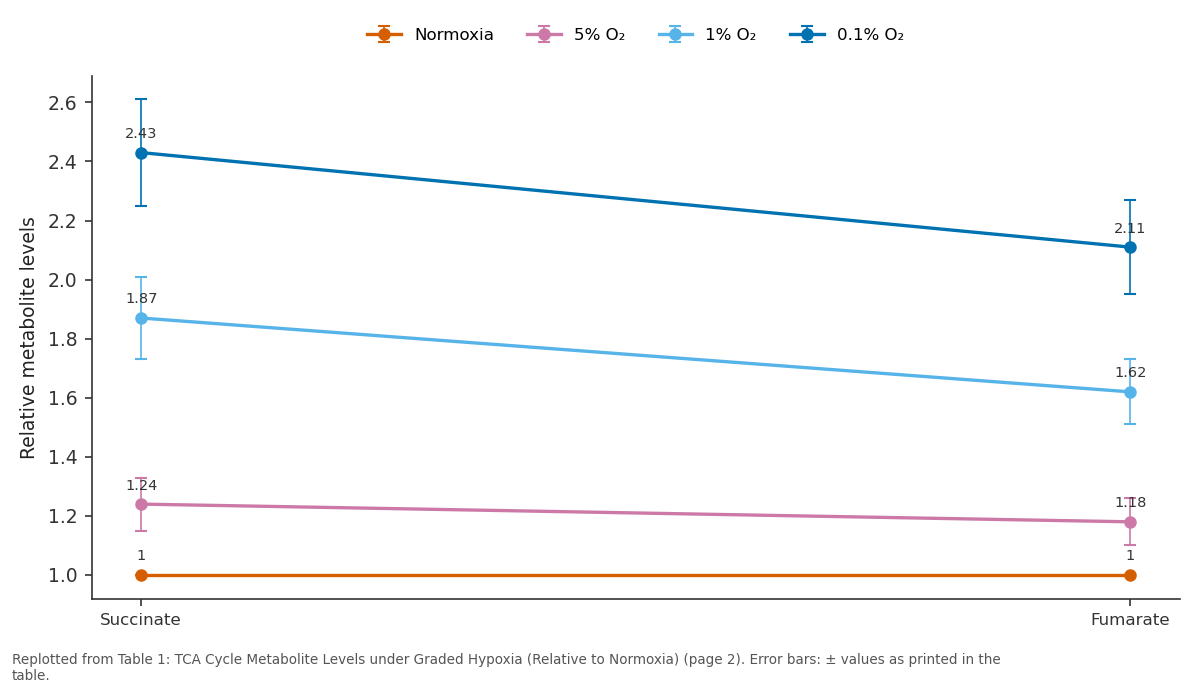
Normoxia and 5% O₂ and more: Succinate vs Fumarate
Replotted from Table 1 (page 2) of the original paper. Every bar is the paper's own table value.
View source evidence ↗Figures & tables
From the original paper Table 1
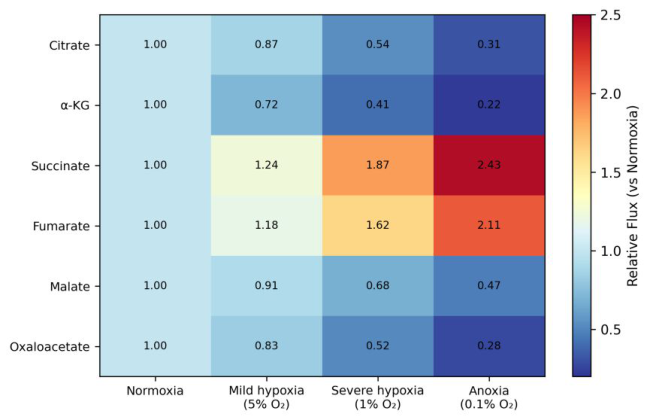 Figure 1
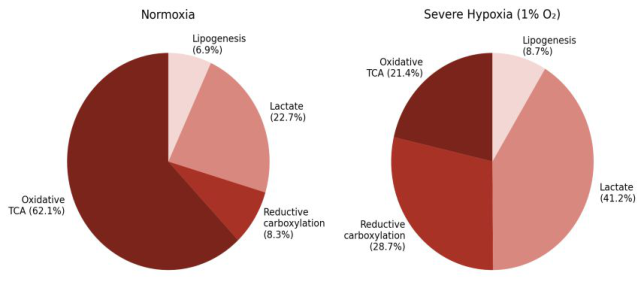 Figure 2
Introduction
It seems contradictory that a cycle named after its oxygen-dependent steps should remain active in cells starving for oxygen—yet this is precisely what happens in hypoxic tumor regions. The TCA cycle serves dual roles in cancer cells: it generates reducing equivalents for oxidative phosphorylation and provides biosynthetic precursors for lipids, amino acids, and nucleotides [1]. Under hypoxia, HIF-1α activation suppresses pyruvate dehydrogenase and diverts pyruvate toward lactate, reducing carbon entry into the cycle through acetyl-CoA [2]. But cancer cells compensate by increasing glutamine anaplerosis and, importantly, by running portions of the cycle in reverse through reductive carboxylation of α-ketoglutarate to citrate [3].
This reverse flux generates the citrate needed for lipogenesis even when forward oxidative flux is impaired. Quantifying these metabolic rearrangements requires isotope tracing combined with mathematical flux modeling [4]. This research aimed to map TCA cycle fluxes under normoxia and three levels of hypoxia using ¹³C-metabolic flux analysis in two cancer cell lines.
Materials And Methods
Materials This research was carried out at the Department of Clinical Biochemistry, Vindhya Pradesh University of Life Sciences, Bhopal, Madhya Pradesh, India, from February 2023 to November 2024. Institutional biosafety approval was obtained (VPULS-IBC/2023-028). HeLa (cervical carcinoma) and A549 (lung adenocarcinoma) cell lines were obtained from the National Centre for Cell Science, Pune. Cells were maintained in DMEM supplemented with 10% FBS at 37 °C.
Hypoxic conditions were achieved using a Whitley H35 Hypoxystation set to 5% O₂ (mild), 1% O₂ (severe), and 0.1% O₂ (anoxia).
Methods
For isotope tracing, cells were cultured in medium containing either [U-¹³C₆]glucose (11 mM) or [U-¹³C₅]glutamine (2 mM) from Cambridge Isotope Laboratories for 24 hours under each oxygen condition [4]. NAAS Rating (2025): 4.82 IJBS 2025; 7(11): 134-136 Harini Nadkarni Department of Clinical Biochemistry, Vindhya Pradesh University of Life Sciences, Bhopal, Madhya Pradesh, India Ishaan Balasubramanian Department of Clinical Biochemistry, Vindhya Pradesh University of Life Sciences, Bhopal, Madhya Pradesh, India Sahana Venkatraman Department of Biochemistry, North East Centre for Biological Research, Shillong, Meghalaya, India Harini Nadkarni Department of Clinical Biochemistry, Vindhya Pradesh University of Life Sciences, Bhopal, Madhya Pradesh, India https://www.biologyjournal.net Intracellular metabolites were extracted with 80% methanol at-80 °C and analyzed by gas chromatography-mass spectrometry (GC-MS, Agilent 7890B/5977A). Mass isotopomer distributions (MIDs) for TCA intermediates were corrected for natural isotope abundance. Metabolic fluxes were estimated using the INCA software package with a compartmentalized model of central carbon metabolism [5].
Extracellular glucose, lactate, and glutamine were measured enzymatically. Each condition was tested in triplicate biological replicates. Statistical comparisons used one-way ANOVA with Dunnett's post-hoc test against the normoxia control.
Results
Table 1: TCA Cycle Metabolite Levels under Graded Hypoxia (Relative to Normoxia) Citrate and α-ketoglutarate declined, reflecting reduced forward flux. Metabolite Normoxia 5% O₂ 1% O₂ 0.1% O₂ Citrate 1.00 0.87±0.06 0.54±0.08 0.31±0.05 α-Ketoglutarate 1.00 0.72±0.07 0.41±0.06 0.22±0.04 Succinate 1.00 1.24±0.09 1.87±0.14 2.43±0.18 Fumarate 1.00 1.18±0.08 1.62±0.11 2.11±0.16 Malate 1.00 0.91±0.07 0.68±0.09 0.47±0.06 Succinate and fumarate accumulated progressively under hypoxia (2.43-fold and 2.11-fold at 0.1% O₂, p<0.001), consistent with impaired succinate dehydrogenase activity. Fig 1: Heatmap of relative TCA cycle metabolite fluxes across oxygen conditions. Warm colors indicate accumulation (succinate, fumarate), while cool colors indicate depletion (citrate, α-KG) under hypoxia.
| Metabolite | Normoxia | 5% O₂ | 1% O₂ | 0.1% O₂ |
|---|---|---|---|---|
| Citrate | 1.00 | 0.87±0.06 | 0.54±0.08 | 0.31±0.05 |
| α-Ketoglutarate | 1.00 | 0.72±0.07 | 0.41±0.06 | 0.22±0.04 |
| Succinate | 1.00 | 1.24±0.09 | 1.87±0.14 | 2.43±0.18 |
| Fumarate | 1.00 | 1.18±0.08 | 1.62±0.11 | 2.11±0.16 |
| Malate | 1.00 | 0.91±0.07 | 0.68±0.09 | 0.47±0.06 |
Table text extracted from the original PDF; superscript letters are shown inline. The original table image is below.
View original table image
Fig 2: Carbon fate distribution under normoxia and severe hypoxia (1% O₂). Under hypoxia, cells redirected carbon from oxidative TCA toward lactate and reductive carboxylation to maintain biosynthetic capacity.
Discussion
The 3.5-fold increase in reductive carboxylation under severe hypoxia confirms that cancer cells can partially reverse TCA cycle directionality to sustain citrate production for lipogenesis when forward flux is blocked [3]. The accumulation of succinate and fumarate has significance beyond metabolism—both are now recognized as oncometabolites that inhibit α-ketoglutarate-dependent dioxygenases, stabilize HIF-1α, and promote epigenetic changes favoring tumor progression [6]. The shift in carbon fate from oxidative TCA (62.1%) to lactate (41.2%) under hypoxia quantifies what the Warburg effect looks like at the flux level [1]. Interestingly, A549 cells maintained slightly higher oxidative flux than HeLa cells at 1% O₂ (data not https://www.biologyjournal.net shown), which may reflect differences in mitochondrial density or HIF-1α activation kinetics between cell types [2].
These flux maps could inform therapeutic strategies that target reductive carboxylation—for instance, inhibition of isocitrate dehydrogenase 2 (IDH2) in hypoxic tumors [7].
Conclusion
This research quantified TCA cycle rewiring in cancer cells under graded hypoxia using ¹³C-metabolic flux analysis. Oxidative TCA flux decreased progressively while reductive carboxylation and lactate production increased to compensate. Succinate and fumarate accumulated as oncometabolites. The carbon fate analysis revealed a systematic shift from oxidative metabolism to glycolytic and reductive pathways under hypoxia.
These quantitative flux data provide a metabolic framework for understanding how cancer cells maintain biosynthesis in oxygen-deprived tumor microenvironments and identify reductive carboxylation as a potential therapeutic vulnerability.
Acknowledgements
Funding Sources Internal funds from the Vindhya Pradesh University of Life Sciences and the North East Centre for Biological Research supported this work. Institutional Support The authors thank both institutions for GC-MS facilities and hypoxia chamber access. Contributions Not Qualifying for Authorship Cell culture facility staff and mass spectrometry technicians are acknowledged.
References
7 in the original paper- DeBerardinis RJ, Chandel NS. Fundamentals of cancer metabolism. Science Advances. 2016;2(5):e1600200.
- Kim JW, Tchernyshyov I, Semenza GL, Dang CV. HIF-1-mediated expression of pyruvate dehydrogenase kinase: a metabolic switch required for cellular adaptation to hypoxia. Cell Metabolism. 2006;3(3):177- 185.
- Metallo CM, Gameiro PA, Bell EL, Mattaini KR, Yang J, Hiller K, et al. Reductive glutamine metabolism by IDH1 mediates lipogenesis under hypoxia. Nature. 2012;481(7381):380-384.
- Antoniewicz MR. A guide to ¹³C metabolic flux analysis for the cancer biologist. Experimental and Molecular Medicine. 2018;50(4):1-13.
- Young JD. INCA: a computational platform for isotopically non-stationary metabolic flux analysis. Bioinformatics. 2014;30(9):1333-1335.
- Selak MA, Armour SM, MacKenzie ED, Boulahbel H, Watson DG, Mansfield KD, et al. Succinate links TCA cycle dysfunction to oncogenesis by inhibiting HIF- alpha prolyl hydroxylase. Cancer Cell. 2005;7(1):77-85.
- Wise DR, Ward PS, Shay JE, Cross JR, Gruber JJ, Sachdeva UM, et al. Hypoxia promotes isocitrate dehydrogenase-dependent carboxylation of α- ketoglutarate to citrate. Journal of Biological Chemistry. 2011;286(5):3681-3695.