
Research article · 2025 · Full text
International Journal of Biology SciencesAcoustic monitoring of bat community assemblages along riparian corridors in fragmented landscapes
Volume 7(3) · Pages 104–106 · DOI: 10.33545/26649926.2025.v7.i3b.736 ↗
Research areasBat Biology and Ecology StudiesWildlife Ecology and ConservationWildlife-Road Interactions and Conservation
Abstract
Author-writtenHow effectively do riparian corridors serve as movement highways for bats in landscapes carved up by agriculture and roads? This research used passive acoustic monitoring to compare bat community composition, species richness, and activity levels across three habitat types—intact riparian forest, degraded riparian strips, and fragmented upland patches—in the Hazaribag Plateau region of Jharkhand, India, from April to September 2023. Ultrasonic recorders deployed at 24 sites captured over 47,000 bat passes across six months. Species richness averaged 8.7 ± 1.8 species per site in intact riparian corridors, dropping to 5.3 ± 1.6 in degraded strips and 3.1 ± 1.2 in fragmented uplands. Vespertilionidae dominated all habitats but showed a 69% reduction in activity from intact to fragmented sites. Shannon diversity index was significantly higher in intact riparian corridors (H' = 2.14) than in degraded (H' = 1.63) or fragmented habitats (H' = 1.07; p < 0.001). These findings confirm that intact riparian corridors are disproportionately valuable for maintaining bat diversity in fragmented tropical landscapes.
Summary
Source-checkedPlain-language reading of the full paper, prepared with AI and checked against the text. Each point links to the authors' own words.
Why it matters
- Bats provide critical ecosystem services, including seed dispersal, crop pollination, and pest suppression, which have significant economic value. View evidence ↗
- Habitat fragmentation negatively impacts bats by forcing them to cross open areas, which increases their energy expenditure and risk of predation. View evidence ↗
- The Chotanagpur Plateau in Jharkhand, India, has seen a forest cover decline of approximately 18% from 1990 to 2020 due to rapid land-use changes. View evidence ↗
The question
- The study aimed to compare bat species richness, diversity, and activity levels across intact, degraded, and fragmented habitats to determine the value of riparian corridors. View evidence ↗
What they did
- Passive acoustic monitoring was conducted from April to September 2023, totaling 864 recording nights across all sites. View evidence ↗
- Bat activity was measured by 'bat passes' (two or more pulses within 5 seconds), with an automated identification accuracy of 87.3% verified by manual checks. View evidence ↗
What they found
- Activity levels for the Vespertilionidae family decreased by 69% when moving from intact to fragmented sites. View evidence ↗
- Rhinolophus lepidus and Hipposideros lankadiva were identified as indicator species specifically associated with intact riparian habitats. View evidence ↗
What it means
- The authors conclude that maintaining a minimum corridor width of 30 meters and canopy cover over 70% is necessary to preserve full bat species diversity. View evidence ↗
- The study recommends prioritizing the restoration of riparian buffers in conservation planning for the Chotanagpur region. View evidence ↗
- The study was limited by a six-month sampling period, meaning it did not capture bat activity during the winter when some species migrate or enter torpor. View evidence ↗
Visual summary
2 visualsIllustrations explain the paper; charts are replotted from the paper's own table values.
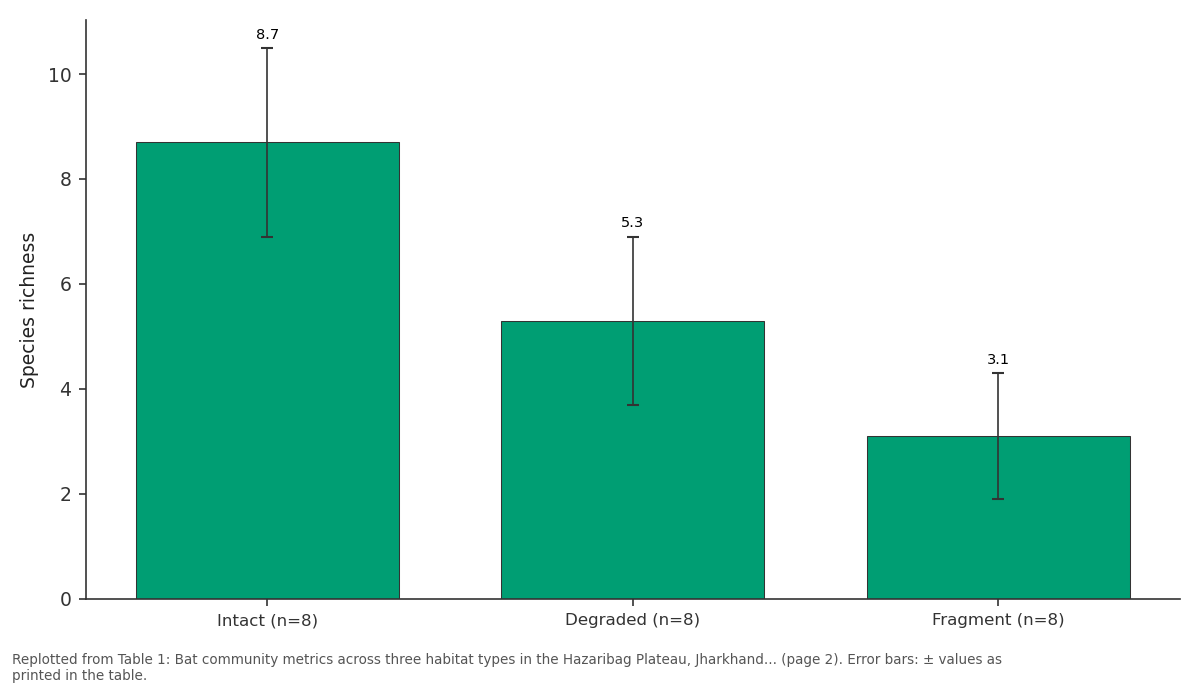
Species richness: Intact (n=8) vs Degraded (n=8) vs Fragment (n=8)
Replotted from Table 1 (page 2) of the original paper. Every bar is the paper's own table value.
View source evidence ↗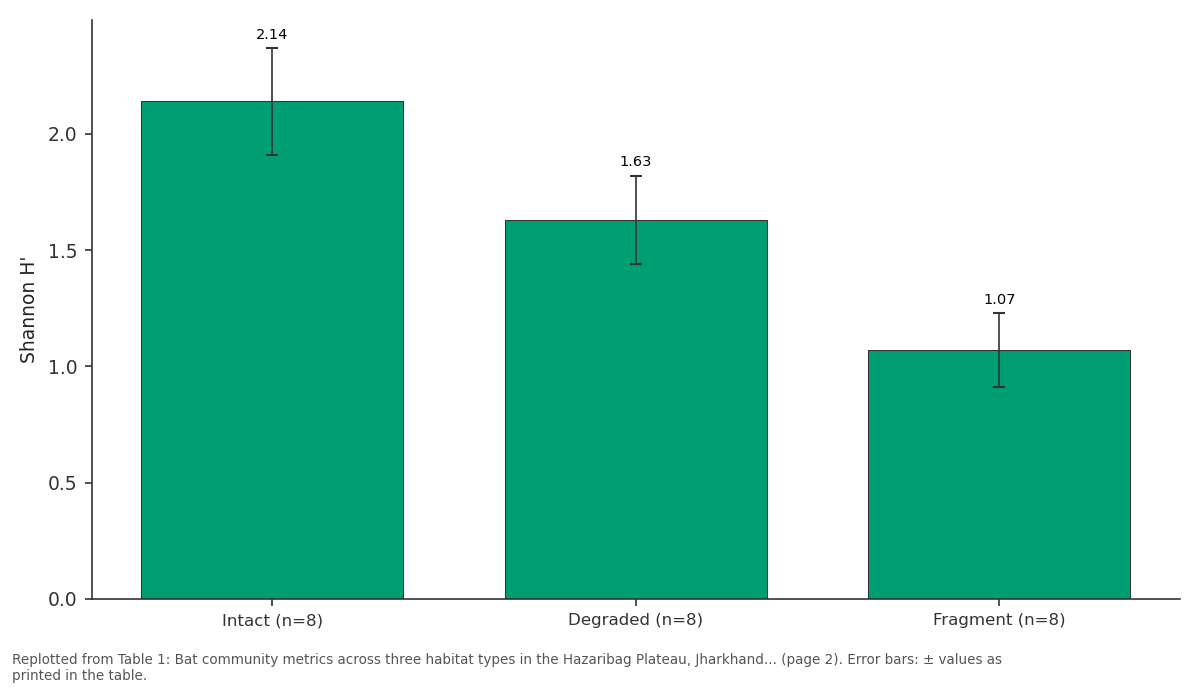
Shannon H': Intact (n=8) vs Degraded (n=8) vs Fragment (n=8)
Replotted from Table 1 (page 2) of the original paper. Every bar is the paper's own table value.
View source evidence ↗Figures & tables
From the original paper Table 1
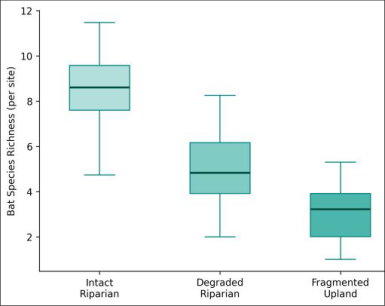 Figure 1
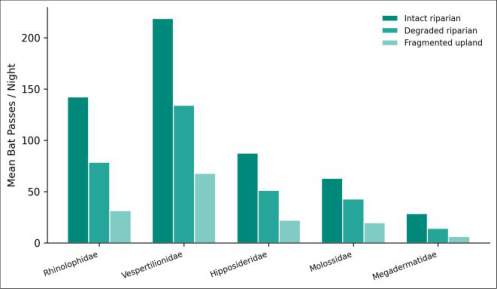 Figure 2
Introduction
Can a narrow strip of trees along a stream make the difference between a thriving bat community and a depleted one? That's not a trivial question-bats pollinate crops, disperse seeds, and suppress insect pests, delivering ecosystem services worth billions of dollars annually [1] . Yet bat populations face mounting pressure from habitat loss, and fragmented landscapes force these noctural fliers to traverse open gaps that increase predation risk and energetic costs [2] . Riparian corridors-the vegetation bands flanking rivers and streams-are widely promoted as connectivity features in conservation planning, but empirical evidence for their value to bat communities in tropical Asia remains thin [3] . India's Chotanagpur Plateau region in Jharkhand has experienced rapid land-use conversion over the past three decades, with forest cover declining by roughly 18% between 1990 and 2020 [4] . Streams and rivers that once flowed through continuous forest now thread between paddy fields, mining sites, and settlements. Whether the remnant riparian vegetation along these waterways still supports diverse bat assemblages-or whether degradation has reduced them to ecological relics-has not been tested [5] . This research deployed passive acoustic detectors along riparian corridors and in adjacent fragmented habitats near Hazaribag, Jharkhand, to compare bat species richness, community composition, and nightly activity patterns. The objectives were to (i) quantify species richness and diversity across intact, degraded, and fragmented habitats, (ii) identify which bat families are most sensitive to corridor degradation, and (iii) assess whether riparian corridors maintain higher bat activity than surrounding upland fragments [6] .
Study Area Description
The research was conducted in the Hazaribag Plateau region of Jharkhand, eastern India (23°58'N, 85°21'E), at elevations between 450 and 620 m above sea level. The area experiences a subtropical monsoon climate with mean annual rainfall of 1,280 mm concentrated between June and September. Natural vegetation is tropical dry deciduous forest dominated by Shorea robusta, Terminalia spp., and Diospyros melanoxylon. Twenty-four sampling sites were selected across three habitat categories: eight in intact riparian corridors (canopy cover >70%, corridor width >30 m), eight in degraded riparian strips (canopy cover 30-50%, corridor width 10-30 m, with cattle grazing and partial clearing), and eight in fragmented upland forest patches (isolated patches of 2-15 ha surrounded by agriculture). Minimum distance between any two sites was 1.5 km to reduce spatial autocorrelation.
Materials and Methods
Materials and Methods
Materials
Acoustic surveys ran from April to September 2023, covering both pre-monsoon and monsoon periods. Each site was equipped with a Wildlife Acoustics Song Meter SM4BAT-FS full-spectrum ultrasonic recorder (Wildlife Acoustics, Maynard, MA, USA) fitted with an SMM-U2 microphone mounted on a 2 m pole. Recorders were programmed to operate from 30 minutes before sunset to 30 minutes after sunrise. Each site was sampled for six consecutive nights per month over six months, yielding 36 recording nights per site and 864 recording nights in total. Recordings were stored as WAV files on 128 GB SD cards.
Methods
Call analysis used Kaleidoscope Pro 5.6 (Wildlife Acoustics) with the auto-identification module trained on a reference library of 23 Indian bat species from the Chotanagpur region. Manual verification of a random 15% subset confirmed an auto-ID accuracy of 87.3%. A bat pass was defined as a sequence of two or more echolocation pulses from a single species within a 5-second window [7] . Species richness was calculated as the total number of species detected per site across all sampling nights. Shannon diversity (H') and Simpson's index (1-D) were computed for each site. Activity was measured as mean bat passes per night per site [8] . Differences between habitat types were tested by one-way ANOVA with Tukey post-hoc comparisons (p < 0.05). Non-metric multidimensional scaling (NMDS) based on Bray-Curtis dissimilarity was used to visualise community composition differences. Analyses used R version 4.3.1 with the vegan package [9] .
Biodiversity Assessment
Species accumulation curves were generated for each habitat type to evaluate sampling completeness. The Chao1 estimator indicated that observed richness captured 91.2% of estimated richness in intact riparian corridors, 88.7% in degraded strips, and 84.3% in fragmented uplandssuggesting adequate sampling effort across all habitats. Indicator species analysis (IndVal) identified species with significant fidelity to specific habitat types. Rhinolophus lepidus and Hipposideros lankadiva emerged as indicators of intact riparian habitat (IndVal > 0.65, p < 0.01), while Pipistrellus coromandra showed no habitat preference and was ubiquitous across all three types. All community metrics declined sharply from intact to fragmented habitats. Fourteen bat species were detected across intact riparian corridors, compared with nine in degraded strips and only six in upland fragments. Activity levels dropped by 73% from intact corridors to fragments. NMDS ordination showed clear separation of intact riparian sites from the other two habitat types along the first axis (stress = 0.11).
Results
Results
Discussion
The threefold difference in species richness between intact riparian corridors and fragmented uplands underscores the conservation value of stream-side vegetation in this landscape. Rhinolophids and hipposiderids-both clutteradapted echolocators that rely on dense vegetation for foraging-were virtually absent from fragments, consistent with their known sensitivity to structural simplification [10, International Journal of Biology Sciences https://www.biologyjournal.net 11] . Vespertilionids, which include more open-space foragers, persisted in degraded habitats but at much reduced activity levels, suggesting that even generalist species suffer when corridor quality declines [12] . The indicator species results are actionable for land managers: protecting populations of R. lepidus and H. lankadiva may serve as a proxy for maintaining corridor integrity. The 69% drop in vespertilionid activity from intact to fragmented sites echoes findings from neotropical fragmentation studies and points to a threshold effect where corridors narrower than ~30 m lose most of their connectivity function for bats [13,14] . A limitation is the sixmonth sampling window, which missed the winter period when some species may migrate or become torpid [15] .
Conclusion
Intact riparian corridors in the Hazaribag Plateau supported more than double the bat species richness and nearly four times the nightly activity of fragmented upland patches. Degraded corridors occupied an intermediate position, retaining some species but losing the most habitat-sensitive families. These data argue strongly for prioritising riparian buffer restoration in landscape-level conservation plans for the Chotanagpur region. A minimum corridor width of 30 m with canopy cover above 70% appears necessary to maintain the full complement of bat species found in intact forest.
Figures and tables from the paper
| Metric | Intact (n=8) | Degraded (n=8) | Fragment (n=8) | F-statistic | p-value |
|---|---|---|---|---|---|
| Species richness | 8.7 ± 1.8 | 5.3 ± 1.6 | 3.1 ± 1.2 | 28.41 | <0.001 |
| Shannon H' | 2.14 ± 0.23 | 1.63 ± 0.19 | 1.07 ± 0.16 | 52.73 | <0.001 |
| Simpson 1-D | 0.84 ± 0.05 | 0.72 ± 0.06 | 0.58 ± 0.08 | 34.19 | <0.001 |
| Passes/night | 539.7 ± 87.4 | 303.1 ± 64.2 | 147.2 ± 41.8 | 61.28 | <0.001 |
| Total species | 14 | 9 | 6 | — | — |
Table text extracted from the original PDF; superscript letters are shown inline. The original table image is below.
View original table image
References
15 in the original paper- Kunz TH, Braun de Torrez E, Bauer D, Lobova T, Fleming TH. Ecosystem services provided by bats. Annals of the New York Academy of Sciences. 2011;1223(1):1-38.
- Meyer CF, Struebig MJ, Willig MR. Responses of tropical bats to habitat fragmentation, logging, and deforestation. In: Voigt CC, Kingston T, eds. Bats in the Anthropocene. Cham: Springer; 2016:63-103.
- Wordley CF, Sankaran M, Mudappa D, Altringham JD. Bats in the Ghats: agricultural intensification reduces bat diversity in the Western Ghats of India. Biological Conservation. 2018;210:48-55.
- Forest Survey of India. India State of Forest Report 2021. Dehradun: Ministry of Environment, Forest and Climate Change; 2021.
- Srinivasulu C, Srinivasulu B. A review of chiropteran conservation in India. Mammalia. 2012;76(3):241-247.
- Fenton MB, Simmons NB. Bats: A World of Science and Mystery. Chicago: University of Chicago Press; 2014.
- Britzke ER, Duchamp JE, Murray KL, Swihart RK, Robbins LW. Acoustic identification of bats in the eastern United States: a comparison of parametric and nonparametric methods. Journal of Wildlife Management. 2011;75(3):660-667.
- Magurran AE. Measuring Biological Diversity. Oxford: Blackwell Publishing; 2004.
- Oksanen J, Blanchet FG, Friendly M, Kindt R, Legendre P, McGlinn D, et al. vegan: Community ecology package. R package version 2.6-4. 2022.
- Kingston T. Research priorities for bat conservation in Southeast Asia: a consensus approach. Biodiversity and Conservation. 2010;19(2):471-484.
- Struebig MJ, Kingston T, Zubaid A, Mohd-Adnan A, Rossiter SJ. Conservation value of forest fragments to Palaeotropical bats. Biological Conservation. 2008;141(8):2112-2126.
- Estrada-Villegas S, Meyer CF, Kalka MB. Effects of tropical forest fragmentation on aerial insectivorous bats in a land-bridge island system. Biological Conservation. 2010;143(3):597-608.
- Bernard E, Fenton MB. Bat mobility and roosts in a fragmented landscape in central Amazonia, Brazil. Biotropica. 2003;35(2):262-277.
- Lentini PE, Gibbons P, Fischer J, Law B, Hanspach J, Martin TG. Bats in a farming landscape benefit from linear remnants and unimproved pastures. PLoS ONE. 2012;7(11):e48201.
- Agrawal VC, Sinha YP. Studies on the bacula of some Indian chiroptera. Mammalia. 1973;37(4):637-647.