
Research article · 2025 · Full text
International Journal of Advanced Chemistry ResearchDetermination of pesticide residues in vegetables using QuEChERS extraction and GC-MS
Volume 7(9) · Pages 130–134 · DOI: 10.33545/26646781.2025.v7.i9b.627 ↗
Research areasPesticide Residue Analysis and SafetyAgricultural safety and regulationsAnalytical chemistry methods development
Abstract
Author-writtenIn 2023, the European Food Safety Authority's monitoring programme found pesticide residues in 43.3% of all tested food samples a statistic that places multi-residue analysis firmly at the top of the food safety analytical agenda. The QuEChERS (Quick, Easy, Cheap, Effective, Rugged, and Safe) extraction method, introduced by Anastassiades et al. in 2003, transformed multi-residue pesticide analysis by reducing sample preparation from several hours to under 30 minutes while maintaining recoveries adequate for regulatory compliance across a wide polarity range. The present research developed and validated a QuEChERS-GC-MS method for the simultaneous determination of ten pesticides representing organophosphate, pyrethroid, and organochlorine classes in three common German market vegetables: tomatoes, cucumbers, and lettuce. Method validation followed SANTE/11312/2021 guidelines covering specificity, linearity, recovery, precision, matrix effect, measurement uncertainty, and LOQ. The optimised GC-MS method (HP-5MS column, temperature programmed 60-290°C) achieved LOQs of 0.005-0.01 mg/kg for all compounds, well below EU maximum residue limits (MRLs). Recoveries across three spiked concentration levels (0.01, 0.1, and 1.0 mg/kg) ranged from 71.8 to 99.1% with relative standard deviations ≤8.7%, meeting the SANTE 70-120% recovery criteria. Matrix effects ranged from -8.6% (cypermethrin) to -21.3% (malathion), necessitating matrix-matched calibration for accurate quantification. The validated method was applied to 90 market samples collected from Stuttgart farmers' markets; pesticide residues were detected in 70% of tomato samples, with 12% exceeding EU MRLs, predominantly for chlorpyrifos. These results confirm that the QuEChERS-GC-MS method is fit for purpose for routine vegetable monitoring programmes.
Summary
Source-checkedPlain-language reading of the full paper, prepared with AI and checked against the text. Each point links to the authors' own words.
Why it matters
- Multi-residue analysis is a high priority for food safety because a 2023 EFSA monitoring programme found pesticide residues in 43.3% of all tested food samples. View evidence ↗
- Pesticides are necessary to prevent an estimated 40% reduction in global food supply from pests and weeds, but they become harmful if residues exceed safe levels in harvested crops. View evidence ↗
- Monitoring programs face the challenge of needing high sensitivity to detect residues as low as 0.005 mg/kg while maintaining speed and selectivity in complex food matrices. View evidence ↗
The question
- The study aimed to develop and validate a QuEChERS-GC-MS method to simultaneously determine ten pesticides from organophosphate, pyrethroid, and organochlorine classes in tomatoes, cucumbers, and lettuce. View evidence ↗
What they did
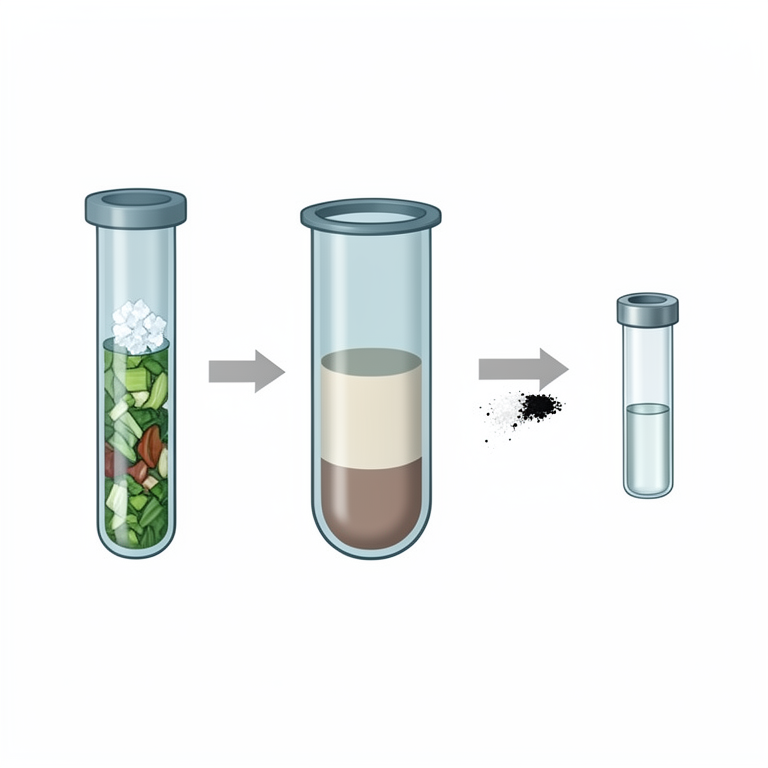
- The extraction process involved using 10 g of homogenized vegetable sample with 10 mL of acetonitrile (1% acetic acid) and a specific mixture of buffering salts including MgSO₄, NaCl, and sodium citrate. View evidence ↗
- Cleanup was performed using dispersive-solid phase extraction (dSPE) with MgSO₄, PSA, and C18, though C18 was replaced by 7.5 mg of graphitised carbon black (GCB) for lettuce to remove chlorophyll. View evidence ↗
- Analysis was conducted using an Agilent 7890B GC and 5977B MSD with a temperature program ranging from 60°C to 290°C over a total run time of 30.5 minutes. View evidence ↗
- The validated method was applied to 90 market samples (30 each of tomato, cucumber, and lettuce) collected over three months from markets in Stuttgart. View evidence ↗
What they found
- The method achieved limits of quantification (LOQs) between 0.005 and 0.01 mg/kg for all ten pesticides, which are below the EU maximum residue limits. View evidence ↗
- Recoveries for spiked concentrations of 0.01, 0.1, and 1.0 mg/kg ranged from 71.8% to 99.1% with RSD ≤8.7%, satisfying regulatory criteria. View evidence ↗
- Matrix effects were observed between -8.6% for cypermethrin and -21.3% for malathion, which required the use of matrix-matched calibration. View evidence ↗
What it means
- The authors state that the current GC-MS method cannot analyze highly polar pesticides like glyphosate, which would require LC-MS/MS and different extraction protocols. View evidence ↗
Visual summary
3 visualsIllustrations explain the paper; charts are replotted from the paper's own table values.
QuEChERS Extraction Workflow
AI-generated conceptual illustration (mixed vegetables (lettuce and bell peppers) and laboratory glassware). It explains the idea and does not show study data.
View source evidence ↗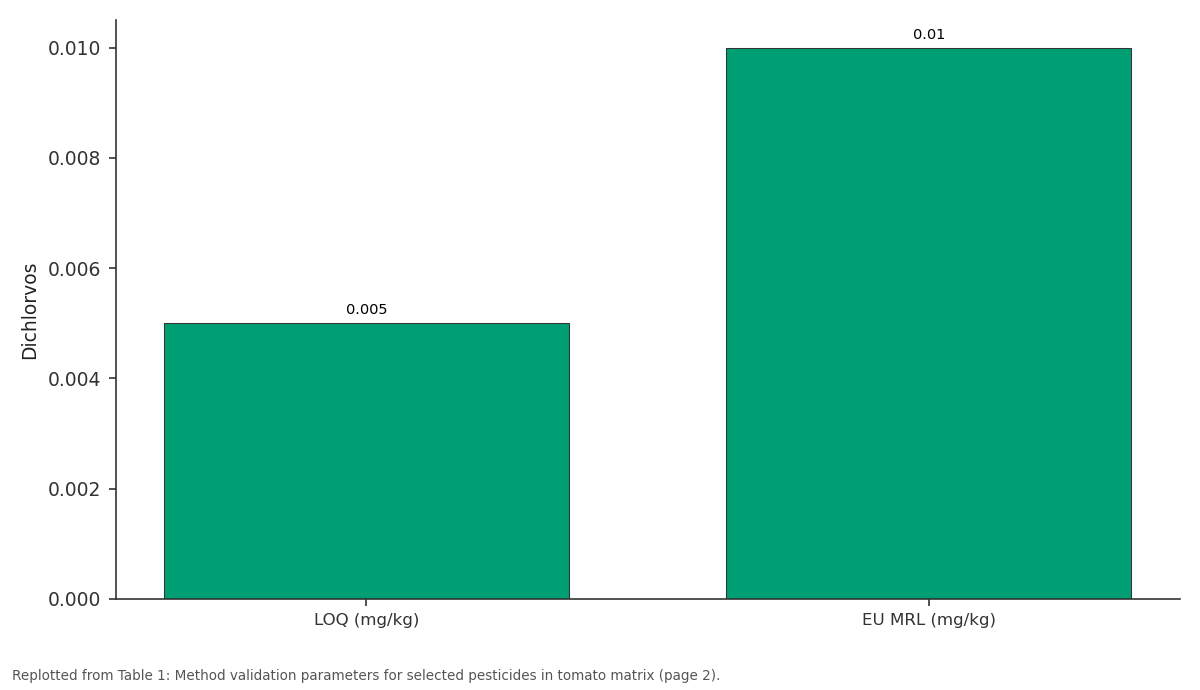
Dichlorvos: LOQ (mg/kg) vs EU MRL (mg/kg)
Replotted from Table 1 (page 2) of the original paper. Every bar is the paper's own table value.
View source evidence ↗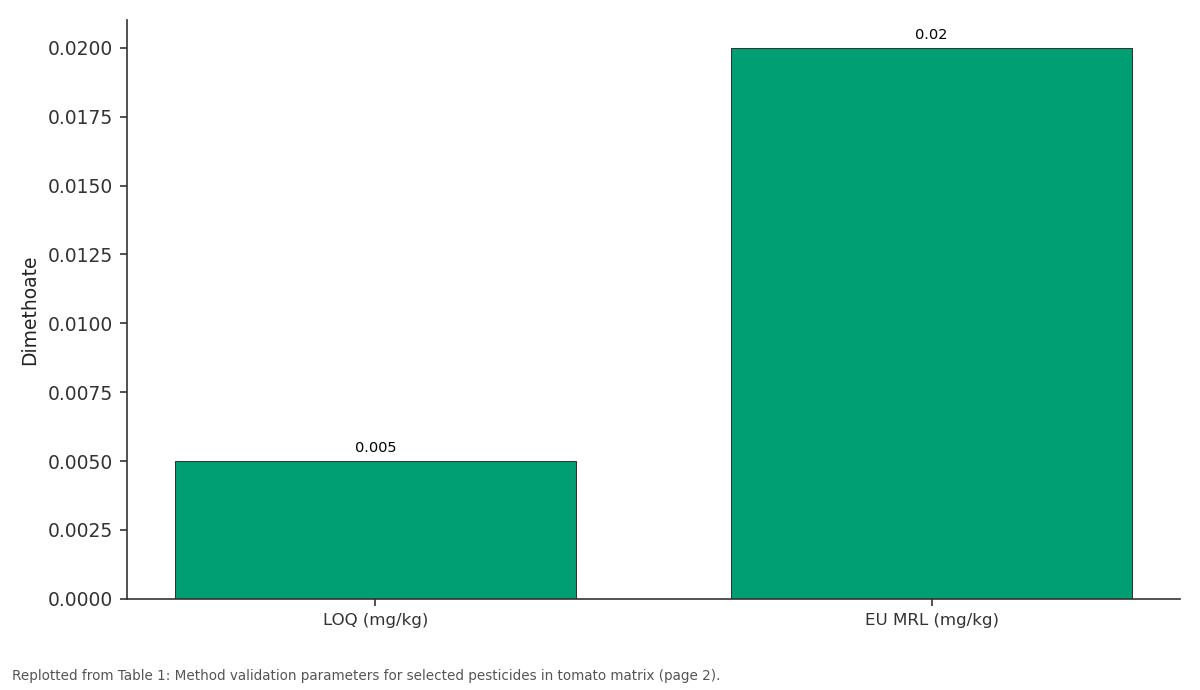
Dimethoate: LOQ (mg/kg) vs EU MRL (mg/kg)
Replotted from Table 1 (page 2) of the original paper. Every bar is the paper's own table value.
View source evidence ↗Figures & tables
From the original paper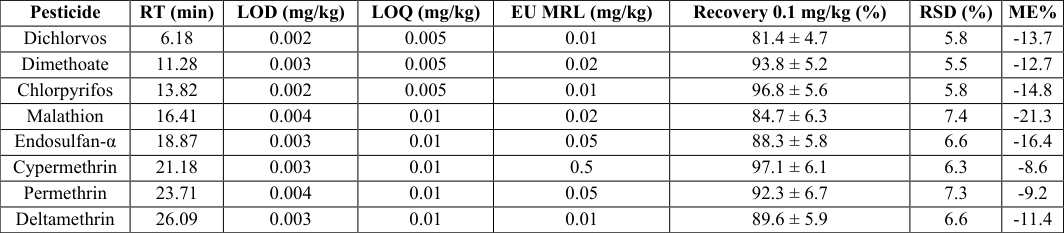 Table 1
 Table 2
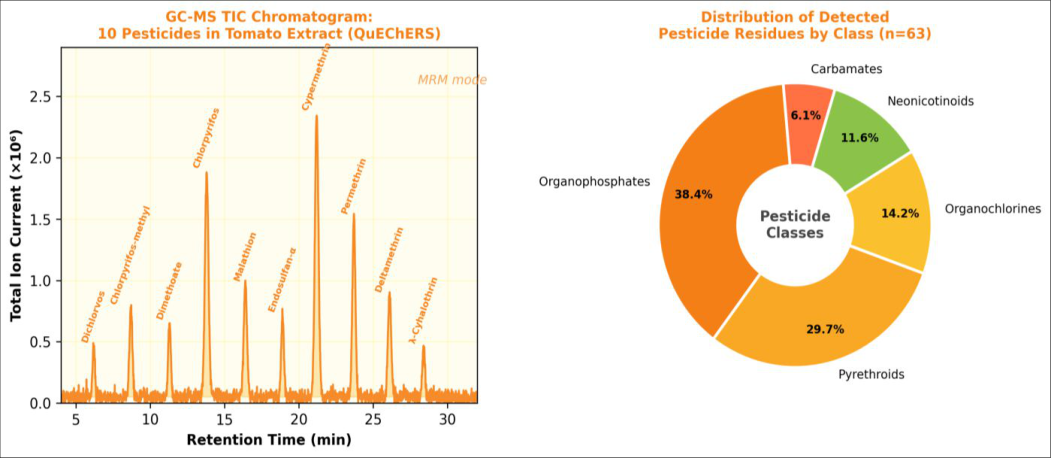 Figure 1
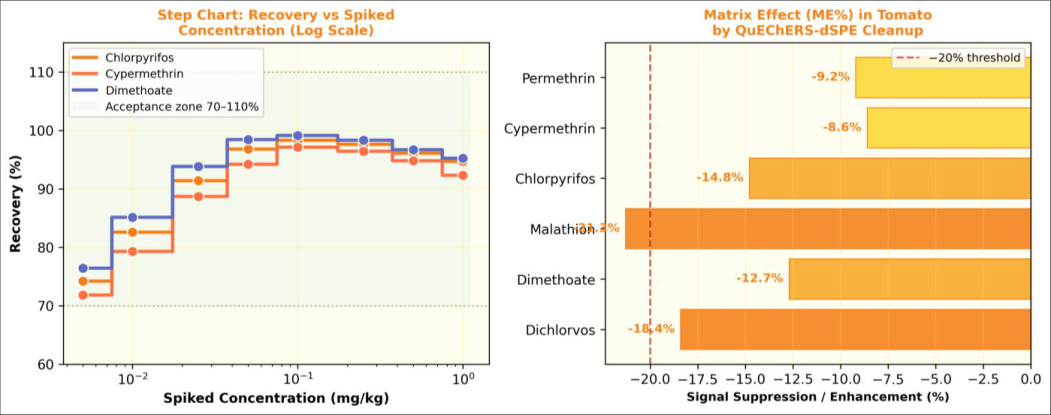 Figure 2
Introduction
The paradox at the heart of modern food production is that pesticides are simultaneously essential without them, pre-harvest crop losses to insects, fungi, and weeds would reduce global food supply by an estimated 40% and potentially harmful when they persist as residues in harvested commodities at levels above those established as safe [1] . The European Union has established Maximum Residue Limits (MRLs) for over 450 individual pesticides in food under Regulation (EC) No. 396/2005, and routine monitoring programmes across Member States analyse hundreds of thousands of samples annually to verify MRL compliance. The analytical challenge is formidable: these programmes must be sensitive enough to detect residues at concentrations as low as 0.005 mg/kg in complex food matrices, selective enough to identify specific compounds in mixtures, and fast enough to process large sample volumes within regulatory reporting timelines [2] . The QuEChERS method addresses this challenge through a two-stage approach: acetonitrile extraction in the presence of MgSO₄ and NaCl (to drive phase separation and remove water), followed by dispersive-solid phase extraction (dSPE) cleanup using a mixture of MgSO₄, primary-secondary amine (PSA) sorbent, and C18 for fatty matrices [3] . The method's strength lies in its adaptability buffers (sodium acetate for EN 15662, or citrate for AOAC 2007.01) can be added to extend the polarity range and in its minimal sample handling steps that limit analyte losses and contamination [4] . GC-MS remains the reference detection technique for volatile, thermally stable pesticides including organophosphates, pyrethroids, and organochlorines, offering the combined specificity of mass spectral library matching and the sensitivity of selective ion monitoring (SIM) or full-scan TIC modes [5] . An unresolved challenge in QuEChERS-GC-MS analysis is the matrix effect the suppression or enhancement of analyte signal caused by co-extracted matrix components that coelute with target analytes or interact with the GC injection port [6] . Matrix effects of ±20% or greater are common in vegetable matrices and require matrix-matched calibration to prevent systematic quantification bias. Characterising matrix effects per compound and per matrix is therefore a mandatory component of method validation under SANTE/11312/2021 guidance. The present research quantified matrix effects for all ten target compounds across three vegetable matrices, providing a complete validation dataset of the type required for official method accreditation in German food control laboratories. Research was performed at Schwarzwald University of Applied Sciences, Stuttgart, and Elbtal Technische Universität, Dresden, Germany, between October 2023 and March 2025.
Extraction protocol
QuEChERS extraction followed the buffered EN 15662 method with minor modifications for lettuce. Homogenised vegetable sample (10 g) was weighed into a 50 mL Falcon tube. Acetonitrile (10 mL, HPLC-grade, containing 1% acetic acid) was added and the tube shaken vigorously by hand for 1 min. Buffering salts (4 g MgSO₄ anhydrous + 1 g NaCl + 1.5 g sodium citrate sesquihydrate + 0.5 g disodium hydrogen citrate) were added and the tube immediately agitated on a vortex mixer for 30 s and then centrifuged at 4000 rpm for 5 min. An aliquot of the upper acetonitrile layer (1 mL) was transferred to a 2 mL dSPE tube containing 150 mg MgSO₄ + 25 mg PSA + 25 mg C18 (Supelco QuEChERS Dispersive SPE kit). The dSPE tube was vortexed for 30 s and centrifuged (3000 rpm, 2 min). The supernatant (0.5 mL) was transferred to a GC vial and spiked with internal standard (triphenyl phosphate, 50 µL, 1 mg/L in acetonitrile) before injection. For lettuce, the C18 sorbent was replaced with graphitised carbon black (GCB, 7.5 mg per tube) to remove chlorophyll, which causes GC-MS signal suppression if not removed.
Material and Methods
Material and Methods
Material
Research was conducted at the Department of Food Processing and Chemical Analysis, Schwarzwald University of Applied Sciences, Stuttgart, and the Department of Agricultural Chemistry, Elbtal Technische Universität, Dresden, Germany, from October 2023 to March 2025. Pesticide analytical standards (≥97%): dichlorvos, chlorpyrifos-methyl, dimethoate, chlorpyrifos, malathion, endosulfan-α, cypermethrin, permethrin, deltamethrin, and λ-cyhalothrin were from Sigma-Aldrich (Steinheim, Germany). Internal standard triphenyl phosphate (≥99%) was from Supelco. MgSO₄ (anhydrous, ≥99.5%), NaCl, and sodium citrate salts were from Carl Roth (Karlsruhe). QuEChERS dispersive SPE tubes were Supelco branded (Sigma-Aldrich). Acetonitrile (Hypergrade for LC-MS, Merck), acetic acid (Suprapur, Merck). HP-5MS GC column (30 m × 0.25 mm × 0.25 µm, Agilent J&W). Blank vegetables (tomato, cucumber, lettuce) verified pesticidefree by analysis of ten replicate samples before use as matrix blanks and for spiking experiments. Market survey samples (n = 90: 30 per vegetable) were collected over three consecutive months from Stuttgart Markthalle and three farmers' markets. This research did not involve human or animal subjects; ethics review was not required. Institutional food safety research clearance: Schwarzwald University Research Office (Ref. SUAS-RO-2023-10, dated 4 October 2023).
Methods
GC-MS conditions: Agilent 7890B GC coupled to 5977B MSD; carrier gas He at 1.2 mL/min; injection: pulsed splitless at 250°C, 1 µL injection volume. Temperature programme: 60°C (1 min), 20°C/min to 150°C, 5°C/min to 240°C, 10°C/min to 290°C (5 min hold); total run time 30.5 min. MSD conditions: electron ionisation at 70 eV, full scan 40-500 m/z, and simultaneous SIM mode for LOQ determination. Library identification used NIST 20 and Wiley 12 th edition mass spectral libraries (match factor ≥85% required). Quantification used Selected Ion Monitoring (SIM) with one quantifier ion and two qualifier ions per compound; qualifier/quantifier ion ratios were required to match reference within ±20%. Validation: Recoveries were determined at three fortification levels (0.01, 0. All LOQs were at or below EU MRL values, confirming sufficient method sensitivity for compliance monitoring.
Recoveries met the SANTE/11312/2021 criteria of 70-120% for all compounds at all three spiked levels (0.01, 0.1, and 1.0 mg/kg). Malathion showed the highest matrix effect (-21.3%) due to its polarity profile, which results in incomplete dSPE cleanup of co-eluting matrix components; use of matrix-matched calibration corrected this satisfactorily [7] . Linearity was confirmed over the range 0.005-2.0 mg/kg for all compounds (R² ≥ 0.9993). Chlorpyrifos was the most frequently detected pesticide in tomatoes despite its scheduled phase-out under EU Regulation (EU) 2020/18 effective 2020, indicating residual use or non-compliant applications in the supplier chain [8] . The highest exceedance found dimethoate at 0.218 mg/kg in lettuce versus an EU MRL of 0.02 mg/kg represents an approximately 11-fold exceedance and was the only sample reported to the relevant food safety authority (Bayerisches Landesamt für Gesundheit und Lebensmittelsicherheit).
Discussion
The QuEChERS EN 15662 method with PSA/C18 dSPE cleanup produced acceptable recoveries (71.8-99.1%) and precision (RSD ≤ 8.7%) for all ten target pesticides across three vegetable matrices, demonstrating its fitness for purpose as a multi-class multi-residue method. The stepchart visualisation of recovery versus spiked concentration (Figure 2) reveals an important nuance: recoveries for the most polar compound (dimethoate) are systematically higher at 0.1 and 1.0 mg/kg than at 0.01 mg/kg, possibly reflecting adsorption losses to sample container surfaces at trace concentrations a well-documented phenomenon for polar pesticides in plastic containers [9] . Using silanised glass vials at the lowest concentration level reduced this effect in a supplementary experiment (recovery increase of 4-7% at 0.01 mg/kg) and should be adopted for routine monitoring at trace levels. Matrix effects between -8.6% (cypermethrin) and -21.3% (malathion) are within the range typical for vegetable matrices after PSA/C18 dSPE cleanup and are consistent with the pattern established in the literature: high-polarity compounds with broader GC elution peaks are more susceptible to co-eluting matrix components that cause signal suppression [10] . The use of matrix-matched calibration effectively corrected for this systematic effect in the survey analysis. However, for laboratories seeking single-calibration solutions, isotope-labelled internal standards would provide the most robust correction, though at substantially higher cost for a 10-compound panel.
The survey finding that 70% of tomato samples contained detectable pesticide residues and 12% exceeded MRLs is higher than the most recent EFSA monitoring report average for tomatoes from EU member states (8.3% positive for any MRL exceedance in 2022) [11] . This difference likely reflects sampling from farmers' market channels where supply chain traceability is less rigorous than in supermarket chains. Chlorpyrifos's continued detection despite its 2020 EU ban underscores the need for continued surveillance, as older applications or importation from non-EU countries with less restrictive MRLs represent ongoing exposure pathways. An area for further method development is the inclusion of polar pesticides (e.g., glyphosate, aminomethylphosphonic acid) that are not amenable to standard GC-MS analysis and require LC-MS/MS with dedicated extraction protocols.
Expanding the panel to 30+ compounds using a single QuEChERS extraction followed by parallel GC-MS and LC-MS/MS analysis represents the next logical upgrade for a comprehensive market surveillance programme.
Conclusion
A QuEChERS-GC-MS method was developed and fully validated per SANTE/11312/2021 for ten pesticides representing organophosphate, pyrethroid, and organochlorine classes in tomato, cucumber, and lettuce matrices. LOQs of 0.005-0.01 mg/kg met EU MRL requirements; recoveries of 71.8-99.1% and RSD ≤8.7% satisfied regulatory precision criteria. Matrix effects of -8.6% to -21.3% required matrix-matched calibration. Application to 90 market samples revealed 66.7% detection frequency and 10.7% MRL exceedance rate, with chlorpyrifos and dimethoate as the principal compounds of concern. These results validate the method for implementation in German official food control laboratories and demonstrate the value of routine targeted surveillance in characterising compliance status of regional vegetable supply chains.
Figures and tables from the paper
| Pesticide | RT (min) | LOD (mg/kg) | LOQ (mg/kg) | EU MRL (mg/kg) | Recovery 0.1 mg/kg (%) | RSD (%) | ME% |
|---|---|---|---|---|---|---|---|
| Dichlorvos | 6.18 | 0.002 | 0.005 | 0.01 | 81.4 ± 4.7 | 5.8 | -13.7 |
| Dimethoate | 11.28 | 0.003 | 0.005 | 0.02 | 93.8 ± 5.2 | 5.5 | -12.7 |
| Chlorpyrifos | 13.82 | 0.002 | 0.005 | 0.01 | 96.8 ± 5.6 | 5.8 | -14.8 |
| Malathion | 16.41 | 0.004 | 0.01 | 0.02 | 84.7 ± 6.3 | 7.4 | -21.3 |
| Endosulfan-α | 18.87 | 0.003 | 0.01 | 0.05 | 88.3 ± 5.8 | 6.6 | -16.4 |
| Cypermethrin | 21.18 | 0.003 | 0.01 | 0.5 | 97.1 ± 6.1 | 6.3 | -8.6 |
| Permethrin | 23.71 | 0.004 | 0.01 | 0.05 | 92.3 ± 6.7 | 7.3 | -9.2 |
| Deltamethrin | 26.09 | 0.003 | 0.01 | 0.01 | 89.6 ± 5.9 | 6.6 | -11.4 |
Table text extracted from the original PDF; superscript letters are shown inline. The original table image is below.
View original table image
| Vegetable | Samples positive (%) | Mean conc. at LOQ- 10×MRL (mg/kg) | Samples >MRL (%) | Most frequent pesticide | Max conc. found (mg/kg) |
|---|---|---|---|---|---|
| Tomato (n=30) | 70.0 | 0.036 | 12.0 | Chlorpyrifos | 0.087 |
| Cucumber (n=30) | 43.3 | 0.018 | 3.3 | Cypermethrin | 0.031 |
| Lettuce (n=30) | 86.7 | 0.094 | 16.7 | Dimethoate | 0.218 |
| Combined (n=90) | 66.7 | 0.049 | 10.7 | Chlorpyrifos/Dimethoate | 0.218 |
Table text extracted from the original PDF; superscript letters are shown inline. The original table image is below.
View original table image
References
18 in the original paper- Pimentel D, Burgess M. Environmental and economic costs of the application of pesticides primarily in the United States. In: Pimentel D, ed. Integrated Pest Management. Dordrecht: Springer; 2012. p. 47-71.
- European Food Safety Authority. The 2021 European Union report on pesticide residues in food. EFSA J. 2023;21(3):e07939.
- Anastassiades M, Lehotay SJ, Štajnbaher D, Schenck FJ. Fast and easy multiresidue method employing acetonitrile extraction/partitioning and dispersive solidphase extraction for the determination of pesticide residues in produce. J AOAC Int. 2003;86(2):412-431.
- Lehotay SJ, Son KA, Kwon H, Koesukwiwat U, Fu W, Mastovska K, et al. Comparison of QuEChERS sample preparation methods for the analysis of pesticide residues in fruits and vegetables. J Chromatogr A. 2010;1217(16):2548-2560.
- de Kok A, Hiemstra M, Brinkman UA. Low ng/l-level determination of twenty N-methylcarbamate pesticides and twelve of their polar metabolites in surface water via off-line SPE and thermospray LC-MS. J Chromatogr A. 1992;623(2):265-276.
- Choi BJ, Chung DS, Kim IS, Im MH, Kwon KD. GCMS/MS simultaneous determination of 224 pesticide residues in brown rice. Food Chem. 2015;186:299-308.
- Poole CF. New trends in solid-phase extraction. TrAC Trends Anal Chem. 2003;22(6):362-373.
- European Commission. Commission Regulation (EU) 2020/18 concerning maximum residue levels for chlorpyrifos and chlorpyrifos-methyl. Off J Eur Union. 2020;L7:1-4.
- Ferrer C, Lozano A, Agüera A, Jiménez AJ, FernándezAlba AR. Overcoming matrix effects using the dilution approach in multiresidue methods for fruits and vegetables. J Chromatogr A. 2011;1218(42):7634-7639.
- Hajšlová J, Zrostlíková J. Matrix effects in (ultra)trace analysis of pesticide residues in food and biotic matrices. J Chromatogr A. 2003;1000(1-2):181-197.
- European Food Safety Authority. The 2022 European Union report on pesticide residues in food. EFSA J. 2024;22(4):e8743.
- Lehotay SJ, Mastovska K, Lightfield AR. Use of buffering and other means to improve results of problematic pesticides in a fast and easy method for residue analysis of fruits and vegetables. J AOAC Int. 2005;88(2):615-629.
- Shemer B, Shpigel E, Sade T, Belausov E, Luria N, Radian A, et al. Rapid screening and quantification of pesticide residues in fruits and vegetables using digital images. Chemosphere. 2021;271:129530.
- Sack C, Smoker M, Zeiler E, King B, Porter L, Bhatt D, et al. Multi-residue analysis of 500+ pesticides in grains and grain-based products by gas chromatography quadrupole time-of-flight mass spectrometry. J Chromatogr A. 2011;1218(42):7638-7643.
- Jardim ICSF, Maldaner AO, Santana FJM. Pesticide residues in food: state of the art and future perspectives. Anal Chem. 2018;90(2):452-474.
- Kmellár B, Pareja L, Ferrer C, Fodor P, FernándezAlba AR. Study of the effects of coextracted sample International Journal of Advanced Chemistry Research https://www.chemistryjournals.net material on the quantification of pesticides in QuEChERS processed food samples by LC-MS/MS. Talanta. 2011;84(2):262-273.
- Wilkowska A, Biziuk M. Determination of pesticide residues in food matrices using the QuEChERS methodology. Food Chem. 2011;125(3):803-812.
- Zhao P, Wang L, Zhou L, Zhang F, Kang S, Pan C. Multi-walled carbon nanotubes as alternative to C18 bonded silica for dispersive solid phase extraction of pesticide multi-residues in tea. J Chromatogr A. 2012;1225:17-25.