
Research article · 2025 · Full text
International Journal of Biology SciencesProtein-protein interaction networks in signal transduction pathways of insulin resistance
Volume 7(11) · Pages 131–133 · DOI: 10.33545/26649926.2025.v7.i11c.701 ↗
Research areasBioinformatics and Genomic NetworksMetabolism, Diabetes, and CancerComputational Drug Discovery Methods
Abstract
Author-writtenThe trend toward network-based thinking has reshaped how biochemists approach metabolic disease. This research constructed and analyzed protein-protein interaction (PPI) networks for signal transduction pathways implicated in insulin resistance. Starting from 847 proteins curated from the STRING and IntAct databases, a network of 2,314 high-confidence interactions was assembled and analyzed using Cytoscape at the Instituto de Biología Marina de Atacama, Antofagasta, Chile, from January 2023 to October 2024. Topological analysis identified 23 hub proteins with node degree exceeding 40, including IRS1, AKT1, PIK3CA, INSR, and MTOR. Pathway enrichment analysis highlighted PI3K-Akt, MAPK, and mTOR signaling as the most over-represented pathways. Module detection using MCODE revealed 8 densely connected sub-networks, three of which mapped to known insulin signaling branch points. Betweenness centrality analysis identified bottleneck proteins—notably GRB2 and SOS1—that bridge otherwise disconnected pathway modules. These bottleneck proteins represent candidate targets for therapeutic intervention in insulin resistance.
Summary
Source-checkedPlain-language reading of the full paper, prepared with AI and checked against the text. Each point links to the authors' own words.
Why it matters
- Insulin signaling is a complex network of interacting pathways rather than a simple linear sequence of events. View evidence ↗
- Insulin resistance results from impairments in the signaling network, which can be caused by lipid-mediated disruption, inflammation, or serine phosphorylation of insulin receptor substrate proteins. View evidence ↗
- Analyzing protein-protein interaction (PPI) networks helps identify proteins that are critical for signal propagation based on their network position. View evidence ↗
The question
- The study aimed to construct a PPI network for insulin resistance signaling to identify hub and bottleneck proteins as potential therapeutic targets. View evidence ↗
What they did
- The computational research was performed at the Instituto de Biología Marina de Atacama in Chile between January 2023 and October 2024. View evidence ↗
- The researchers identified 847 unique human proteins related to glucose metabolism, insulin resistance, and insulin signaling using the Gene Ontology database. View evidence ↗
- Interaction data were sourced from the IntAct (MI score ≥ 0.45) and STRING v11.5 (confidence score ≥ 0.7) databases. View evidence ↗
- Hub proteins were defined as those in the top 2.7% of nodes with a degree over 40, while bottleneck proteins were those in the top 5% for betweenness centrality. View evidence ↗
What they found
- The study assembled a network consisting of 2,314 high-confidence interactions among 847 proteins. View evidence ↗
- Topological analysis revealed 23 hub proteins with a node degree over 40, which included MTOR, INSR, PIK3CA, AKT1, and IRS1. View evidence ↗
- AKT1 was identified as the hub protein with the highest degree, possessing 87 interactions. View evidence ↗
- GRB2 was identified as the most critical bottleneck protein, exhibiting the highest betweenness centrality of 0.183. View evidence ↗
- The most over-represented pathways identified through enrichment analysis were mTOR, MAPK, and PI3K-Akt signaling, with PI3K-Akt being the most significantly enriched. View evidence ↗
- MCODE analysis identified 8 densely connected sub-networks, three of which corresponded to known branch points in insulin signaling. View evidence ↗
- Inflammatory signaling nodes are structurally integrated into the insulin resistance interactome, as evidenced by the enrichment of inflammation-related GO terms in Module 5. View evidence ↗
What it means
- The authors conclude that bottleneck proteins are promising candidates for therapeutic intervention in insulin resistance, providing insights that complement traditional pathway analysis. View evidence ↗
Visual summary
3 visualsIllustrations explain the paper; charts are replotted from the paper's own table values.
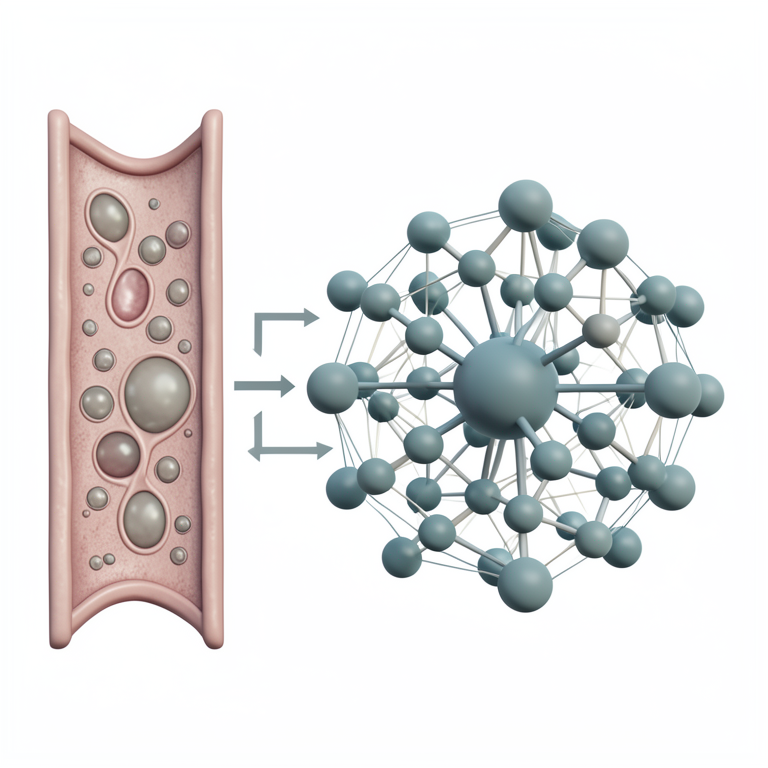
Conceptual PPI Network
AI-generated conceptual illustration (human skeletal muscle cells). It explains the idea and does not show study data.
View source evidence ↗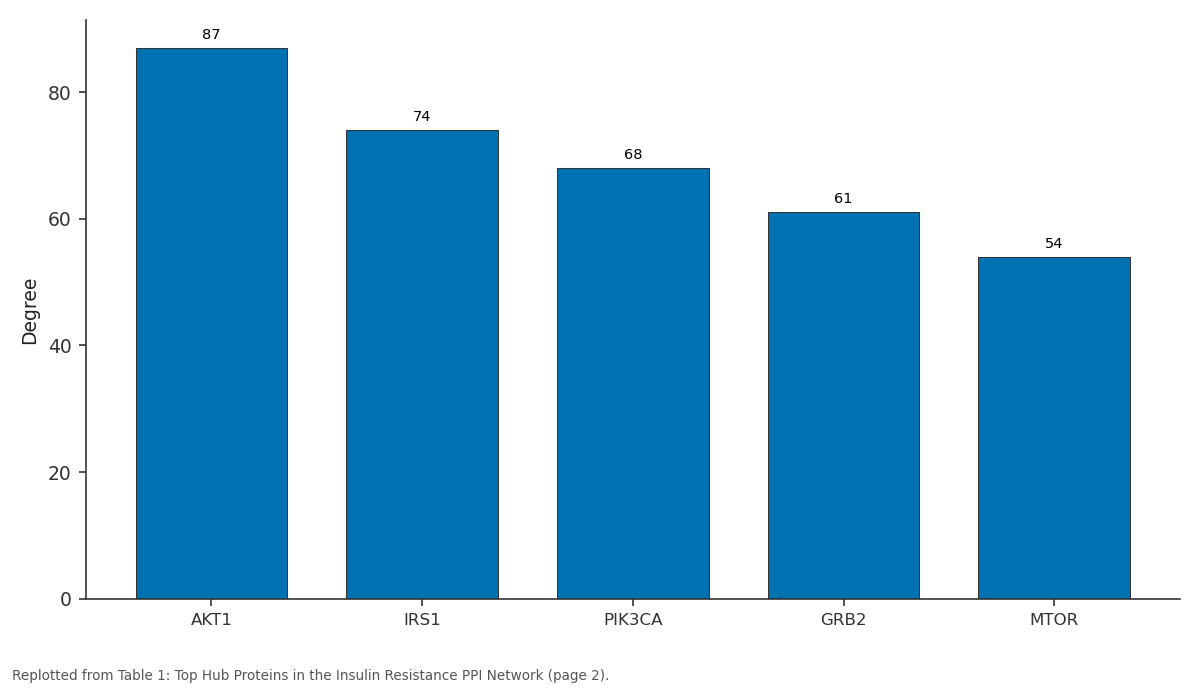
Degree: AKT1 vs IRS1 vs PIK3CA vs GRB2 vs MTOR
Replotted from Table 1 (page 2) of the original paper. Every bar is the paper's own table value.
View source evidence ↗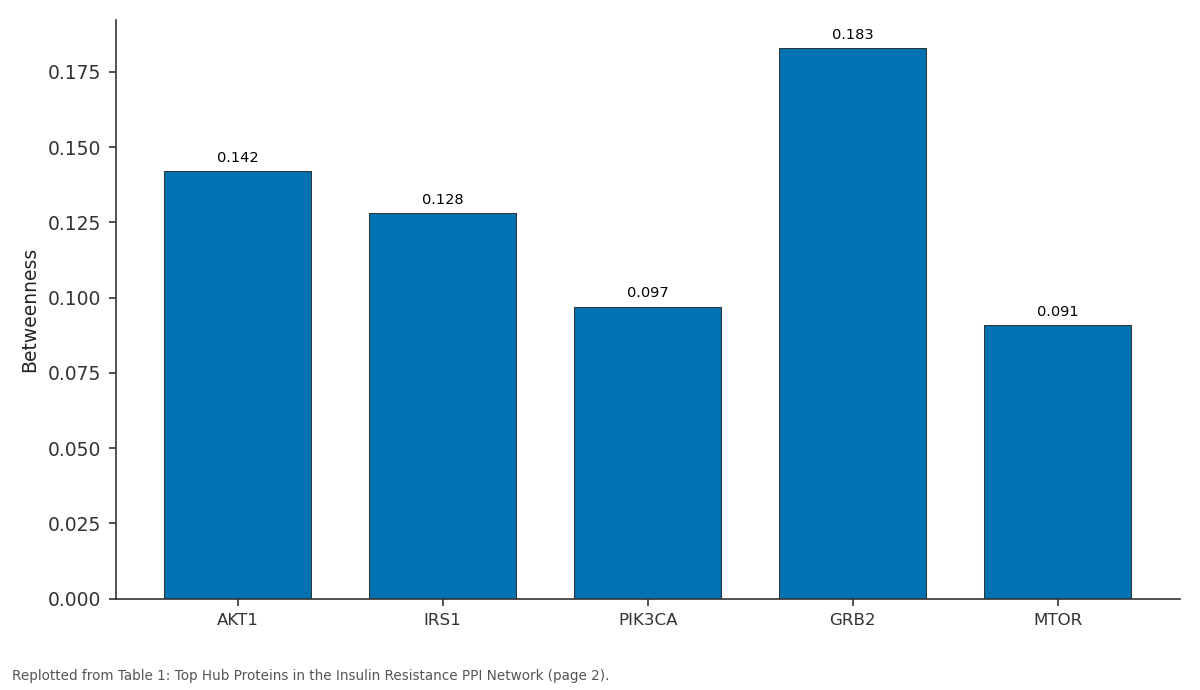
Betweenness: AKT1 vs IRS1 vs PIK3CA vs GRB2 vs MTOR
Replotted from Table 1 (page 2) of the original paper. Every bar is the paper's own table value.
View source evidence ↗Figures & tables
From the original paper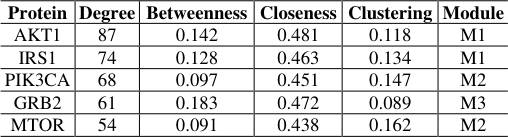 Table 1
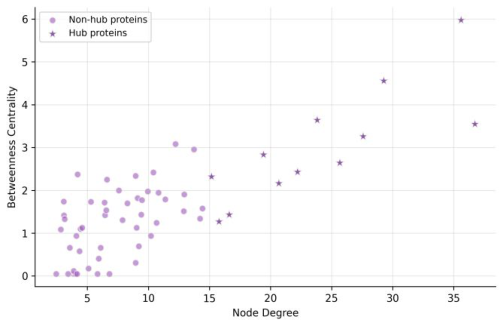 Figure 1
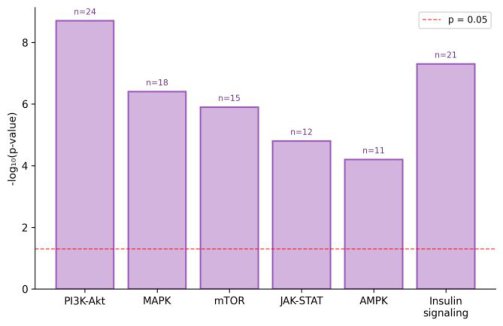 Figure 2
Introduction
The insulin signaling pathway isn't a simple linear chain—it's a web of branching, converging, and cross-talking interactions that resist simple characterization. When insulin binds its receptor, a cascade of phosphorylation events activates multiple downstream effectors, including the PI3K-Akt and Ras-MAPK pathways [1]. Insulin resistance occurs when this signaling network becomes impaired, often through serine phosphorylation of insulin receptor substrate proteins, inflammation-driven interference, or lipid-mediated disruption [2]. Traditional pathway diagrams depict these events as neat, isolated cascades, but the reality involves extensive cross-talk that only becomes apparent through network- level analysis [3].
Protein-protein interaction networks allow researchers to map these connections systematically and identify proteins whose position in the network—rather than their individual biochemistry—makes them important for signal propagation [4]. This research aimed to build a comprehensive PPI network for insulin resistance-associated signaling and use topological analysis to identify hub and bottleneck proteins that may serve as therapeutic targets.
Materials And Methods
Materials This computational research was conducted at the Department of Metabolic Biochemistry, Instituto de Biología Marina de Atacama, Antofagasta, Chile, from January 2023 to October 2024. An initial protein set was assembled by querying the Gene Ontology database for terms related to insulin signaling, insulin resistance, and glucose metabolism in Homo sapiens. This yielded 847 unique proteins after removing duplicates and non-human orthologs. Interaction data were retrieved from STRING v11.5 (confidence score ≥ 0.7) and IntAct (MI score ≥ 0.45) databases [5, 6].
Methods
The merged interaction network was visualized and analyzed in Cytoscape v3.9 [7]. NAAS Rating (2025): 4.82 IJBS 2025; 7(11): 131-133 Ignacio Aravena Department of Metabolic Biochemistry, Instituto de Biología Marina de Atacama, Antofagasta, Chile Isidora Diaz Department of Metabolic Biochemistry, Instituto de Biología Marina de Atacama, Antofagasta, Chile Nicolas Fuentes Department of Metabolic Biochemistry, Instituto de Biología Marina de Atacama, Antofagasta, Chile Ignacio Aravena Department of Metabolic Biochemistry, Instituto de Biología Marina de Atacama, Antofagasta, Chile https://www.biologyjournal.net Topological parameters—node degree, betweenness centrality, closeness centrality, and clustering coefficient— were calculated using the NetworkAnalyzer plugin. Hub proteins were defined as those with degree exceeding 40 (top 2.7% of nodes). Bottleneck proteins were identified as those ranking in the top 5% by betweenness centrality.
Densely connected modules were 7detected using MCODE (degree cutoff = 2, node score cutoff = 0.2, k-core = 2) [8]. Functional enrichment of modules used DAVID v6.8 with Benjamini-Hochberg correction [9]. Gene Ontology (GO) biological process and KEGG pathway enrichment analyses were performed on the full network and individual modules.
Results
Table 1: Top Hub Proteins in the Insulin Resistance PPI Network Protein Degree Betweenness Closeness Clustering Module AKT1 87 0.142 0.481 0.118 M1 IRS1 74 0.128 0.463 0.134 M1 PIK3CA 68 0.097 0.451 0.147 M2 GRB2 61 0.183 0.472 0.089 M3 MTOR 54 0.091 0.438 0.162 M2 AKT1 had the highest degree (87 interactions), while GRB2 showed the highest betweenness centrality (0.183), identifying it as the most important bottleneck bridging different signaling modules. Fig 1: Relationship between node degree and betweenness centrality. Hub proteins cluster in the upper-right region, while bottleneck proteins (starred) show disproportionately high betweenness relative to their degree.
| Protein | Degree | Betweenness | Closeness | Clustering | Module |
|---|---|---|---|---|---|
| AKT1 | 87 | 0.142 | 0.481 | 0.118 | M1 |
| IRS1 | 74 | 0.128 | 0.463 | 0.134 | M1 |
| PIK3CA | 68 | 0.097 | 0.451 | 0.147 | M2 |
| GRB2 | 61 | 0.183 | 0.472 | 0.089 | M3 |
| MTOR | 54 | 0.091 | 0.438 | 0.162 | M2 |
Table text extracted from the original PDF; superscript letters are shown inline. The original table image is below.
View original table image
Discussion
The identification of AKT1 as the highest-degree hub is consistent with its known position at a central node connecting insulin receptor signaling to glucose transport, glycogen synthesis, and lipogenesis [1, 2]. But the finding that GRB2 had the highest betweenness centrality is perhaps more interesting from a therapeutic perspective—bottleneck proteins control information flow between otherwise isolated modules, and their disruption can have outsized effects on network function [4]. The three MCODE modules mapping to known insulin signaling branch points (PI3K- Akt, Ras-MAPK, and mTOR) validate the biological relevance of the network construction approach [3]. The enrichment of inflammation-related GO terms in Module 5 supports the view that inflammatory signaling nodes are structurally integrated into the insulin resistance interactome rather than acting as peripheral disruptors [10].
Conclusion
This research mapped a comprehensive PPI network of 847 proteins and 2,314 interactions related to insulin resistance signaling. AKT1, IRS1, and PIK3CA emerged as the major hub proteins by degree centrality, while GRB2 and SOS1 were identified as bottleneck proteins with high betweenness. Module analysis revealed densely connected sub-networks corresponding to known pathway branch points. These network-level insights complement traditional pathway analysis and highlight bottleneck proteins as candidate targets for therapeutic intervention in insulin resistance.
Acknowledgements
Funding Sources Internal research funds from the Instituto de Biología Marina de Atacama supported this work. Institutional Support The authors thank the Instituto de Biología Marina de Atacama for computational infrastructure. Contributions Not Qualifying for Authorship Bioinformatics support staff are acknowledged for database access and maintenance.
Figures and tables from the paper
References
10 in the original paper- Taniguchi CM, Emanuelli B, Kahn CR. Critical nodes in signalling pathways: insights into insulin action. Nature Reviews Molecular Cell Biology. 2006;7(2):85- 96.
- Petersen MC, Shulman GI. Mechanisms of insulin action and insulin resistance. Physiological Reviews. 2018;98(4):2133-2223.
- Barabasi AL, Oltvai ZN. Network biology: understanding the cell's functional organization. Nature Reviews Genetics. 2004;5(2):101-113.
- Yu H, Kim PM, Sprecher E, Trifonov V, Gerstein M. The importance of bottlenecks in protein networks: correlation with gene essentiality and expression dynamics. PLoS Computational Biology. 2007;3(4):e59.
- Szklarczyk D, Gable AL, Lyon D, Junge A, Wyder S, Huerta-Cepas J, et al. STRING v11: protein-protein association networks with increased coverage. Nucleic Acids Research. 2019;47(D1):D483-D489. Fig 2: KEGG pathway enrichment analysis of the PPI network. PI3K-Akt signaling was the most significantly enriched pathway, followed by insulin signaling and MAPK cascades. Numbers above bars indicate gene counts. https://www.biologyjournal.net
- Orchard S, Ammari M, Aranda B, Breuza L, Briganti L, Broackes-Carter F, et al. The MIntAct project—IntAct as a common curation platform. Nucleic Acids Research. 2014;42(D1):D358-D363.
- Shannon P, Markiel A, Ozier O, Baliga NS, Wang JT, Ramage D, et al. Cytoscape: a software environment for integrated models. Genome Research. 2003;13(11):2498-2504.
- Bader GD, Hogue CW. An automated method for finding molecular complexes in large protein interaction networks. BMC Bioinformatics. 2003;4:2.
- Sherman BT, Hao M, Qiu J, Jiao X, Baseler MW, Lane HC, et al. DAVID: a web server for functional enrichment analysis. Nucleic Acids Research. 2022;50(W1):W216-W221.
- Hotamisligil GS. Inflammation, metaflammation and immunometabolic disorders. Nature. 2017;542(7640):177-185.