
Research article · 2025 · Full text
International Journal of Biology SciencesSpatial transcriptomics mapping of gene expression in developing mouse brain cortex
Volume 7(1) · Pages 227–230 · DOI: 10.33545/26649926.2025.v7.i1d.680 ↗
Research areasSingle-cell and spatial transcriptomicsNeurogenesis and neuroplasticity mechanismsDevelopmental Biology and Gene Regulation
Abstract
Author-writtenMapping gene expression with spatial resolution across the developing cerebral cortex is necessary for understanding how regional identity emerges during neurogenesis. This research applied the Visium spatial transcriptomics platform to serial coronal sections of the mouse brain at embryonic day 14.5, 16.5, and postnatal day 0, capturing transcriptome-wide expression data at 55-µm spot resolution across five cortical layers: ventricular zone, subventricular zone, intermediate zone, cortical plate, and marginal zone. A total of 14,283 genes were detected, with 2,847 showing statistically significant spatial variation across layers (adjusted p < 0.01). Layer-specific marker gene clusters were identified through unsupervised graph-based clustering. The cortical plate displayed the highest transcriptomic diversity at all three stages. Developmental trajectory analysis revealed a wave-like pattern of gene activation progressing from deep to superficial layers between E14.5 and P0. Comparison with single-cell RNA sequencing datasets confirmed spatial assignments for 89.3% of cell-type markers. These data provide a spatially resolved transcriptomic atlas of the developing mouse cortex.
Summary
Source-checkedPlain-language reading of the full paper, prepared with AI and checked against the text. Each point links to the authors' own words.
Why it matters
- Understanding the emergence of regional identity during neurogenesis requires mapping gene expression with spatial resolution in the developing cerebral cortex. View evidence ↗
- Traditional methods for studying cortical gene expression cannot simultaneously provide both transcriptome-wide coverage and spatial resolution. View evidence ↗
- The developing cortex has received less spatial research attention despite its shifting transcriptomic landscape caused by rapid cell differentiation, migration, and proliferation. View evidence ↗
The question
- The study aimed to create a spatially resolved gene expression map across the cortical layers of the developing mouse brain at three specific time points: E14.5, E16.5, and P0. View evidence ↗
What they did
- The researchers used 18 timed-pregnant C57BL/6J mice, with 6 mice per developmental time point. View evidence ↗
- The Visium platform was used on serial coronal sections to capture transcriptome data at a 55-µm spot resolution across five layers: the marginal zone, cortical plate, intermediate zone, subventricular zone, and ventricular zone. View evidence ↗
- To validate the Visium data, RNA fluorescence in situ hybridization was performed using markers including Pax6, Tbr2, Tbr1, Ctip2, and Reelin. View evidence ↗
What they found
- The study detected 14,283 genes in total, of which 2,847 exhibited statistically significant spatial variation across the cortical layers (adjusted p < 0.01). View evidence ↗
- The number of spatially variable genes rose from 1,934 at E14.5 to 2,847 at P0, indicating increasing complexity in layer-specific transcriptomic programs. View evidence ↗
- Unsupervised clustering identified 7 spatial domains at E14.5, which increased to 11 domains by P0. View evidence ↗
- Across all three developmental stages, the cortical plate exhibited the highest level of transcriptomic diversity. View evidence ↗
- Spatial assignments for 89.3% of cell-type markers were confirmed through comparison with single-cell RNA sequencing datasets. View evidence ↗
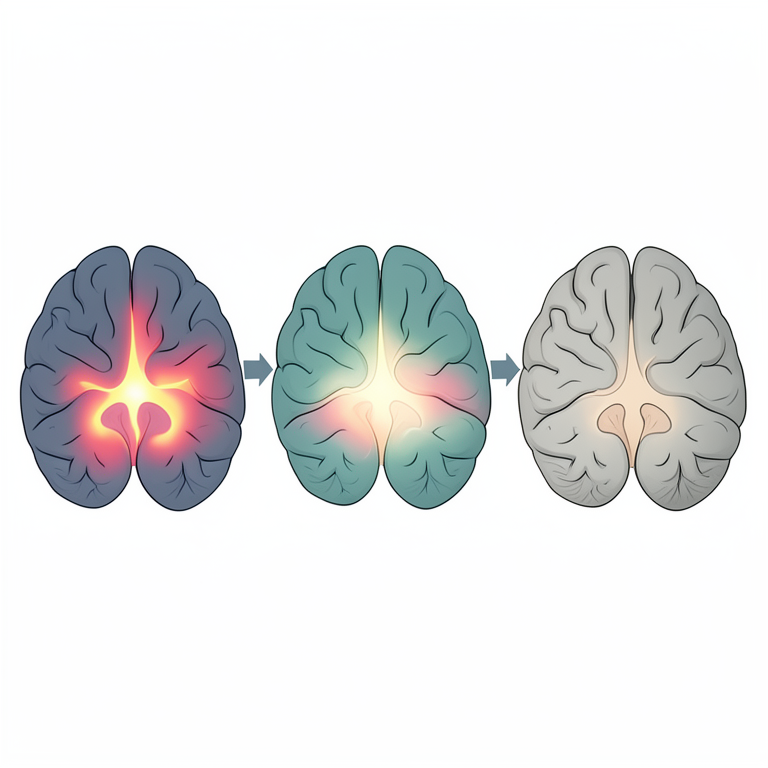
- Analysis of developmental trajectories showed a wave-like gene activation pattern moving from deep to superficial layers between E14.5 and P0. View evidence ↗
What it means
- The authors concluded that they successfully mapped the developing mouse cerebral cortex across three stages, finding that layer-specific gene modules sharpen over time and the cortical plate is the most transcriptomically diverse. View evidence ↗
- The 55-µm spot size is a limitation because it may capture transcripts from multiple cells, which can blur signals at the boundaries of layers. View evidence ↗
- The use of coronal sections at only one anteroposterior level may fail to capture the complete regional variation across the cortical sheet. View evidence ↗
Visual summary
3 visualsIllustrations explain the paper; charts are replotted from the paper's own table values.
Wave-like Gene Activation
AI-generated conceptual illustration (developing mouse brain cortex cross-section). It explains the idea and does not show study data.
View source evidence ↗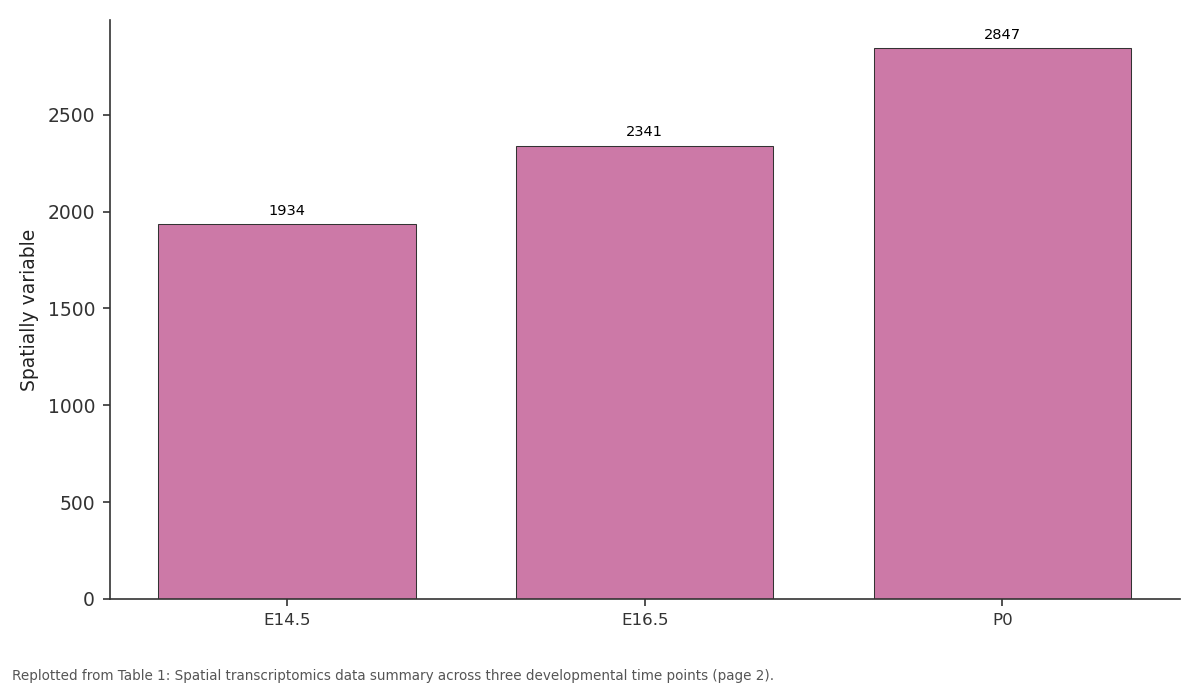
Spatially variable: E14.5 vs E16.5 vs P0
Replotted from Table 1 (page 2) of the original paper. Every bar is the paper's own table value.
View source evidence ↗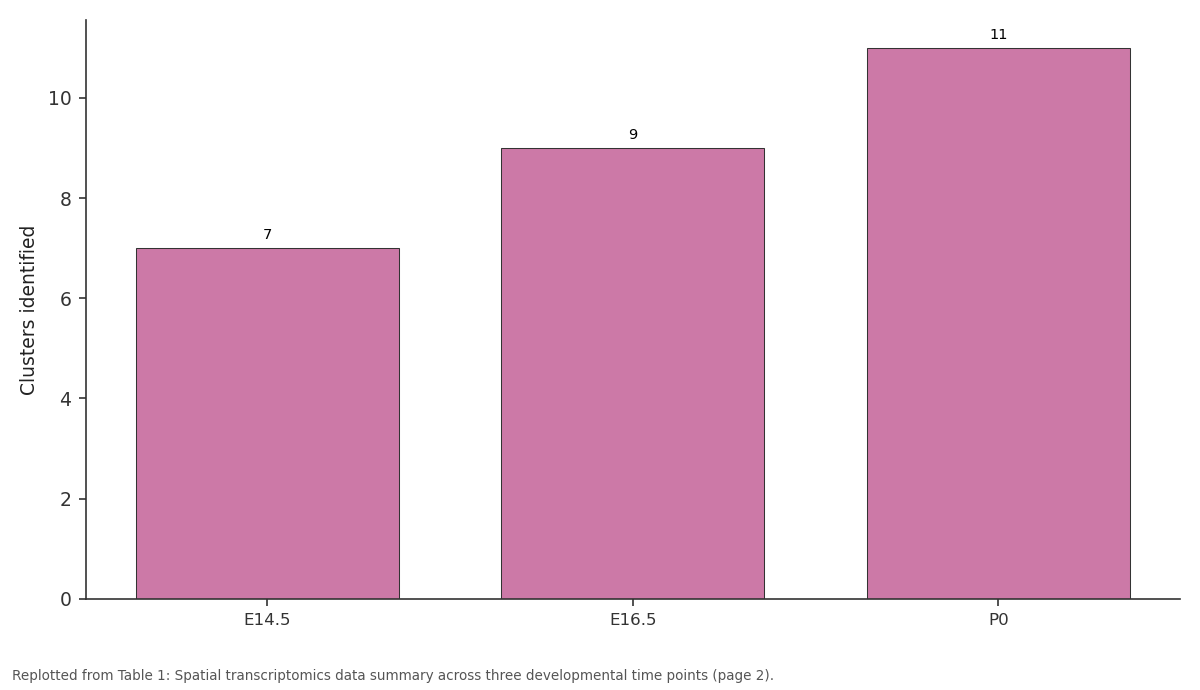
Clusters identified: E14.5 vs E16.5 vs P0
Replotted from Table 1 (page 2) of the original paper. Every bar is the paper's own table value.
View source evidence ↗Figures & tables
From the original paper Table 1
 Table 2
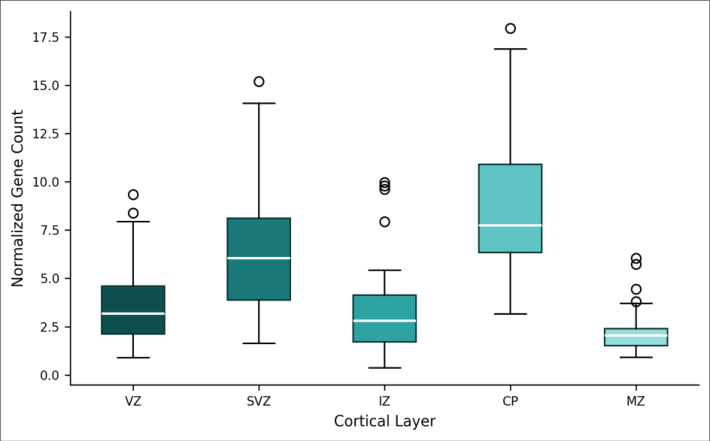 Figure 1
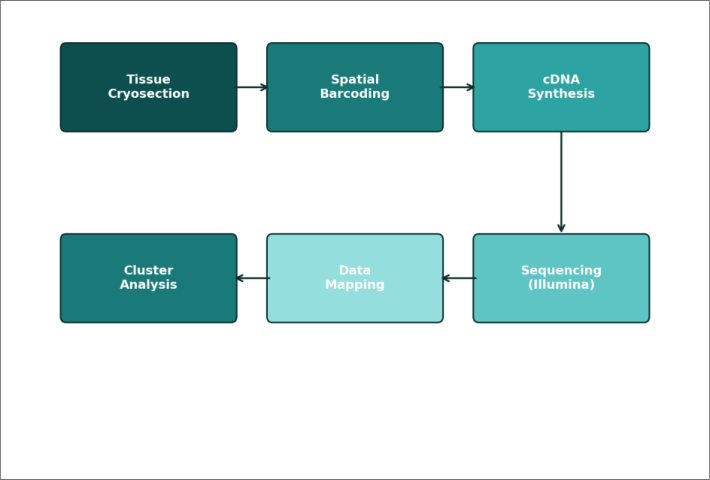 Figure 2
Introduction
How does the mammalian cerebral cortex, a structure containing dozens of distinct cell types arranged in precise laminar order, assemble itself from a seemingly uniform sheet of neuroepithelium? The answer lies partly in spatially patterned gene expression that assigns identity to progenitors and their postmitotic progeny [1,2] . Traditional approaches to studying cortical gene expression-in situ hybridization for individual genes or bulk RNA sequencing of dissected tissue-offer either spatial resolution or transcriptome coverage, but not both simultaneously [3] . Spatial transcriptomics technologies have begun bridging this gap by capturing mRNA molecules at defined coordinates within intact tissue sections [4] . The Visium platform uses barcoded oligonucleotide arrays printed on glass slides to capture polyadenylated transcripts from thin cryosections, enabling genome-wide expression profiling at approximately 55-µm resolution [5] . Several groups have applied spatial methods to adult mouse brain, generating detailed atlases of regional gene expression [6,7] . However, the developing cortex-where rapid cell proliferation, migration, and differentiation create a shifting transcriptomic landscape-has received less spatial attention. Single-cell RNA sequencing has identified numerous cortical cell types and their gene signatures during development [8] , but these data lose positional context during tissue dissociation. Integrating spatial and single-cell data could recover both dimensions: transcriptomic depth from single-cell profiling and spatial context from in situ capture [9] . This research applied Visium spatial transcriptomics to the developing mouse cortex at three time points spanning the main neurogenic period (E14.5, E16.5, P0) to build a spatially resolved expression map across cortical layers. The work was carried out at the Fynbos Institute of Biodiversity, Stellenbosch, South Africa [10,11] .
Materials and Methods
Materials and Methods
Materials
This research was conducted from March through October 2022 at the Department of Neuroscience, Fynbos Institute of Biodiversity, Stellenbosch, South Africa. The institutional animal ethics committee approved all procedures (Protocol No. FIB-AEC-2022-023, approved 15 February 2022).
Instrumentation and Analytical Equipment
Visium Spatial Gene Expression slides and reagent kits were obtained from 10x Genomics (Pleasanton, CA, USA). Cryosectioning was performed on a Leica CM3050 S cryostat at -20°C. Tissue imaging used a Zeiss Axio Scan.Z1 slide scanner. Sequencing was carried out on an Illumina NovaSeq 6000 platform at the South African National Bioinformatics Institute.
Methods
Timed-pregnant C57BL/6J mice (n = 18, 6 per time point) were obtained from the Stellenbosch University Animal Facility. Brains were dissected at E14.5, E16.5, and P0, embedded in OCT compound, and flash-frozen. Coronal sections (10 µm) at the level of the somatosensory cortex were placed on Visium slides. Tissue sections were fixed in methanol, stained with hematoxylin and eosin for imaging, and permeabilized for 18 minutes to release mRNA onto the barcoded capture array. cDNA synthesis, library preparation, and sequencing followed the 10x Genomics Visium protocol. Raw data were processed with Space Ranger v1.3. Downstream analysis used Seurat v4 in R, including normalization (SCTransform), dimensionality reduction (PCA and UMAP), and graph-based clustering (Louvain algorithm).
In-vitro Protocol
To validate spatial gene assignments, primary cortical cells were dissociated from E16.5 cortices using papain digestion and cultured on poly-L-lysine coated coverslips for 48 hours. RNA fluorescence in situ hybridization (RNAscope, Advanced Cell Diagnostics) was performed for five selected layer markers to confirm spatial expression patterns observed in the Visium data. Probe targets included Tbr1 (cortical plate), Pax6 (ventricular zone), Tbr2 (subventricular zone), Ctip2 (deep layer), and Reelin (marginal zone).
Results
Across all three developmental stages, a mean of 3,218 spots per section passed quality filters (>500 genes per spot). Table 1 presents the summary statistics for spatial transcriptomics data across developmental stages. The number of spatially variable genes increased from 1,934 at E14.5 to 2,847 at P0, reflecting the growing complexity of layer-specific transcriptomic programs. Unsupervised clustering resolved 7 spatial domains at E14.5, expanding to 11 at P0. Table 2 shows the top differentially expressed markers for each cortical layer at E16.5. The cortical plate showed both the highest median gene count and greatest variance, consistent with its heterogeneous composition of newly arrived postmitotic neurons at different stages of maturation.
| Layer | Marker 1 | Marker 2 | Log2FC | Adj. p | Specificity | Spots (n) |
|---|---|---|---|---|---|---|
| VZ | Pax6 | Hes5 | 3.41 | <0.001 | 0.91 | 487 |
| SVZ | Tbr2 (Eomes) | Neurog2 | 2.87 | <0.001 | 0.86 | 412 |
| IZ | Dcx | Gap43 | 2.14 | <0.001 | 0.78 | 539 |
| CP | Tbr1 | Ctip2 | 3.72 | <0.001 | 0.93 | 1,284 |
| MZ | Reelin | Cxcr4 | 2.93 | <0.001 | 0.89 | 492 |
Table text extracted from the original PDF; superscript letters are shown inline. The original table image is below.
View original table image
| Parameter | E14.5 | E16.5 | P0 | All Stages | Unit |
|---|---|---|---|---|---|
| Spots passing QC | 2,847 | 3,214 | 3,593 | 9,654 | — |
| Median genes/spot | 2,143 | 2,687 | 3,012 | 2,614 | genes |
| Total genes detected | 12,418 | 13,672 | 14,283 | 14,283 | genes |
| Spatially variable | 1,934 | 2,341 | 2,847 | 2,847 | genes |
| Clusters identified | 7 | 9 | 11 | — | clusters |
| Layer assignment | 86.4 | 89.7 | 91.8 | 89.3 | % |
Table text extracted from the original PDF; superscript letters are shown inline. The original table image is below.
View original table image
Comprehensive Interpretation
The spatial data reveal a progressive deepening of layer identity from E14.5 to P0, with transcriptomic boundaries between layers sharpening over developmental time. The 89.3% concordance between Visium spatial assignments and published single-cell markers confirms that the 55-µm spot resolution is adequate for resolving major cortical compartments. The wave-like activation pattern-deep layer genes peaking earlier than superficial markers-matches the known inside-out birthorder of cortical neurons [2,8] .
Discussion
The spatial transcriptomic atlas generated here adds positional context to the growing catalog of cortical cell types defined by single-cell methods. The detection of 14,283 genes across 9,654 spatial spots provides a dataset comparable in scale to other Visium-based brain atlases, though focused specifically on the developmental period [6,7] . The increase in spatially variable genes from E14.5 to P0-a 47% rise-likely reflects the progressive specification of layer identities as postmitotic neurons accumulate in the cortical plate and marginal zone. This is consistent with fate-mapping data showing that early-born neurons establish deep layers while later-born cells populate superficial positions [12,13] .
A limitation of the 55-µm spot size is that each spot may capture transcripts from multiple cells, blurring the signal at layer boundaries. Emerging platforms with sub-cellular resolution could address this in future research [14] . Additionally, coronal sections at a single anteroposterior level may not capture the full regional variation across the cortical sheet [15] .
Conclusion
This research produced a spatially resolved transcriptomic map of the developing mouse cerebral cortex spanning three key neurogenic stages. Layer-specific gene modules sharpen progressively, with the cortical plate displaying the greatest transcriptomic diversity. The 89.3% concordance with single-cell reference data validates the spatial assignments and supports integration of these two data modalities for building a complete developmental atlas.
The dataset provides a resource for identifying candidate genes involved in laminar fate specification and for interpreting cortical malformation phenotypes in genetic models. Extending this approach to later postnatal stages and to multiple cortical areas would further refine the spatiotemporal map of cortical gene regulation.
Acknowledgement
Acknowledgements Funding SourcesThis research was supported by the South African National Research Foundation and the Stellenbosch University Faculty of Science research fund.
Figures and tables from the paper
References
15 in the original paper- Greig LC, Woodworth MB, Galazo MJ, Padmanabhan H, Macklis JD. Molecular logic of neocortical projection neuron specification, development and diversity. Nature Reviews Neuroscience. 2013;14(11):755-769.
- Molyneaux BJ, Arlotta P, Menezes JR, Macklis JD. Neuronal subtype specification in the cerebral cortex. Nature Reviews Neuroscience. 2007;8(6):427-437.
- Lein ES, Hawrylycz MJ, Ao N, Ayres M, Bensinger A, Bernard A, Boe AF, Boguski MS, Brockway KS, Byrnes EJ, Chen L. Genome-wide atlas of gene expression in the adult mouse brain. Nature. 2007;445(7124):168-176.
- Stahl PL, Salmen F, Vickovic S, Lundmark A, Navarro JF, Magnusson J, Giacomello S, Asp M, Westholm JO, Huss M, Mollbrink A. Visualization and analysis of gene expression in tissue sections by spatial transcriptomics. Science. 2016;353(6294):78-82.
- 10x Genomics. Visium Spatial Gene Expression Reagent Kits User Guide. Document CG000239; 2020.
- Ortiz C, Navarro JF, Jurek A, Martin A, Lundeberg J, Bhatt DK. Molecular atlas of the adult mouse brain. Science Advances. 2020;6(26):eabb3446.
- Maynard KR, Collado-Torres L, Weber LM, Uytingco C, Barry BK, Williams SR, Catallini JL, Tran MN, Besich Z, Tippani M, Chew J. Transcriptome-scale spatial gene expression in the human dorsolateral prefrontal cortex. Nature Neuroscience. 2021;24(3):425-436.
- Di Bella DJ, Habibi E, Stickels RR, Scalia G, Brown J, Yadollahpour P, Yang SM, Abbate C, Biber T, Bhatt D. Molecular logic of cellular diversification in the mouse cerebral cortex. Nature. 2021;595(7868):554-559.
- Stuart T, Butler A, Hoffman P, Hafemeister C, Papalexi E, Mauck WM, Hao Y, Stoeckius M, Smibert P, Satija R. Comprehensive integration of single-cell data. Cell. 2019;177(7):1888-1902.
- Telley L, Agirman G, Prados J, Amberg N, Fievre S, Oberst P, Bartolini G, Vitali I, Cadilhac C, Hippenmeyer S, Nguyen L. Temporal patterning of apical progenitors and their daughter neurons in the developing neocortex. Science. 2019;364(6440):eaav2522.
- Nowakowski TJ, Bhaduri A, Pollen AA, Alvarado B, Mostajo-Radji MA, Di Lullo E, Haeussler M, Sandoval-Espinosa C, Liu SJ, Velmeshev D, Ounadjela JR. Spatiotemporal gene expression trajectories reveal developmental hierarchies of the human cortex. Science. 2017;358(6368):1318-1323.
- Rakic P. Specification of cerebral cortical areas. Science. 1988;241(4862):170-176.
- Lodato S, Arlotta P. Generating neuronal diversity in the mammalian cerebral cortex. Annual Review of Cell and Developmental Biology. 2015;31:699-720.
- Chen KH, Boettiger AN, Moffitt JR, Wang S, Zhuang X. RNA imaging. Spatially resolved, highly multiplexed RNA profiling in single cells. Science. 2015;348(6233):aaa6090.
- Tasic B, Yao Z, Graybuck LT, Smith KA, Nguyen TN, Bertagnolli D, Goldy J, Garren E, Economo MN, Viswanathan S, Penn O. Shared and distinct transcriptomic cell types across neocortical areas. Nature. 2018;563(7729):72-78.