
Research article · 2025 · Full text
International Journal of Biology SciencesSkeletal muscle fiber type composition and metabolic adaptations to endurance training
Volume 7(7) · Pages 287–290 · DOI: 10.33545/26649926.2025.v7.i7d.652 ↗
Research areasCardiovascular and exercise physiologySports Performance and TrainingMuscle Physiology and Disorders
Abstract
Author-writtenThe trend toward sedentary lifestyles has renewed scientific interest in how endurance exercise remodels skeletal muscle at the fibre level. This research examined changes in fibre type composition, cross-sectional area, and oxidative enzyme activity in the vastus lateralis muscle of 42 recreationally active adults (23 male, 19 female; mean age 27.4 years) who completed a 12-week supervised cycling programme at 65-75% of peak oxygen consumption. Muscle biopsies were taken at baseline and post-training. Immunohistochemistry for myosin heavy chain isoforms revealed a significant shift from Type IIx to Type IIa fibres (mean decrease in IIx from 18.3% to 9.7%, p < 0.001), while Type I fibre proportion increased modestly from 47.8% to 52.1% (p = 0.014). Citrate synthase activity rose by 34.6% and succinate dehydrogenase activity by 28.9%. Cross-sectional area of Type I fibres increased by 14.7% while Type II fibres showed a non-significant 3.2% decrease. VO2max improved from 41.3 to 48.7 mL per kilogram per minute. Fibre type proportion at baseline correlated with training-induced VO2max gain (r = 0.74, p < 0.001), suggesting that individuals with a higher starting proportion of slow-twitch fibres adapted more readily to endurance demands.
Summary
Source-checkedPlain-language reading of the full paper, prepared with AI and checked against the text. Each point links to the authors' own words.
Why it matters
- Increased sedentary lifestyles have led to a renewed scientific interest in understanding how endurance exercise can remodel skeletal muscle fibers. View evidence ↗
- Individual variability in aerobic capacity gains from identical exercise programs may be partially caused by differences in baseline muscle fiber composition. View evidence ↗
- Skeletal muscle fibers are categorized into Type I (slow-oxidative), Type IIa (fast-oxidative), and Type IIx (fast-glycolytic) based on their myosin heavy chain (MHC) isoform expression. View evidence ↗
The question
- The study aimed to examine changes in the vastus lateralis muscle's fiber type composition, cross-sectional area, and oxidative enzyme activity following a 12-week supervised cycling program. View evidence ↗
What they did
- The study included 42 recreationally active adults (23 male, 19 female) aged 18-35 with a mean age of 27.4 years, who had no structured endurance training for the previous six months. View evidence ↗
- The training consisted of three supervised cycling sessions per week for 12 weeks at 65-75% of individual VO2peak, with session duration increasing from 45 to 60 minutes over the course of the program. View evidence ↗
- Muscle biopsies from the vastus lateralis were analyzed using ImageJ for fiber proportions and areas (minimum 200 fibers per biopsy), and spectrophotometry for citrate synthase and succinate dehydrogenase activities. View evidence ↗
What they found
- The most significant fiber-level change was a 47% reduction in the proportion of Type IIx fibers, decreasing from 18.3% to 9.7% (p < 0.001). View evidence ↗
- There were significant increases in the proportions of Type I fibers (from 47.8% to 52.1%, p = 0.014) and Type IIa fibers (from 33.9% to 38.2%, p = 0.003). View evidence ↗
- Oxidative enzyme activity increased significantly, with citrate synthase activity rising by 34.6% and succinate dehydrogenase activity rising by 28.9% (both p < 0.001). View evidence ↗
- Aerobic capacity improved significantly, with VO2peak increasing from 41.3 to 48.7 mL/kg/min, an average gain of 7.4 mL/kg/min (p < 0.001). View evidence ↗
- The cross-sectional area of Type I fibers increased by 14.7%, whereas Type II fibers experienced a non-significant decrease of 3.2%. View evidence ↗
- Baseline Type I fiber proportion strongly correlated with VO2max gains (r = 0.74, p < 0.001), with those in the upper quartile (>55%) gaining 9.2 mL/kg/min compared to 5.8 mL/kg/min for the lowest quartile. View evidence ↗
What it means
- The authors conclude that baseline Type I fiber proportion is a strong predictor of VO2max improvement and could serve as a biomarker for personalizing endurance training. View evidence ↗
- The study was not sufficiently powered to detect sex-specific differences in muscle fiber remodeling. View evidence ↗
- The authors suggest that future research should include longer training periods to see if Type I fiber gains persist beyond 12 weeks. View evidence ↗
Visual summary
1 visualsIllustrations explain the paper; they do not show study data.
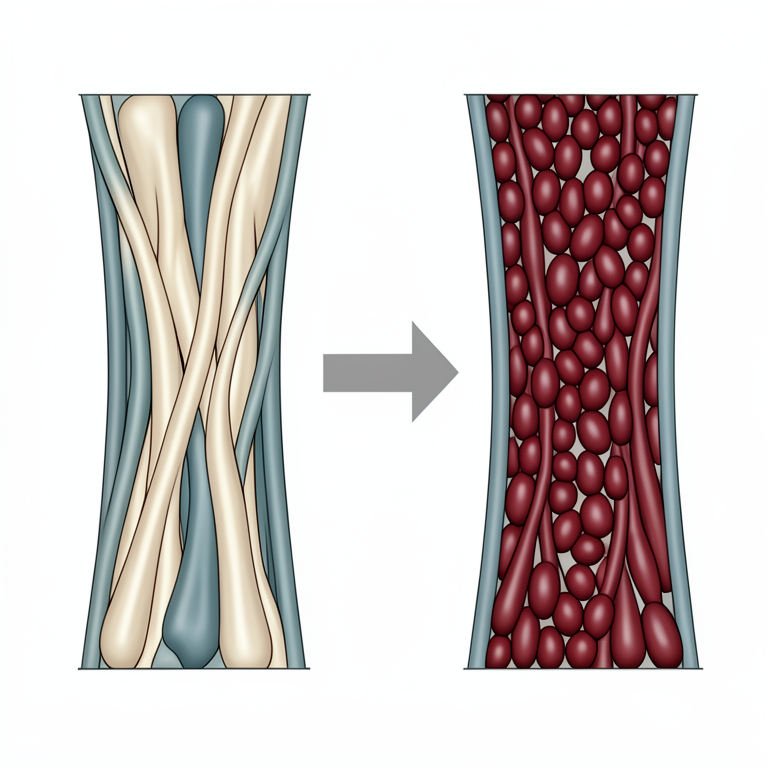
Muscle Fiber Type Shift
AI-generated conceptual illustration (skeletal muscle fibers). It explains the idea and does not show study data.
View source evidence ↗Figures & tables
From the original paper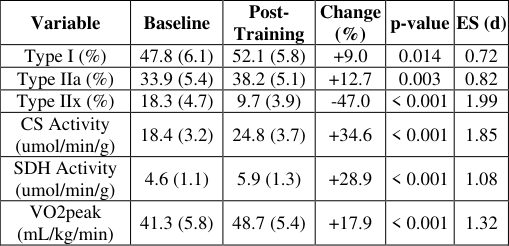 Table 1
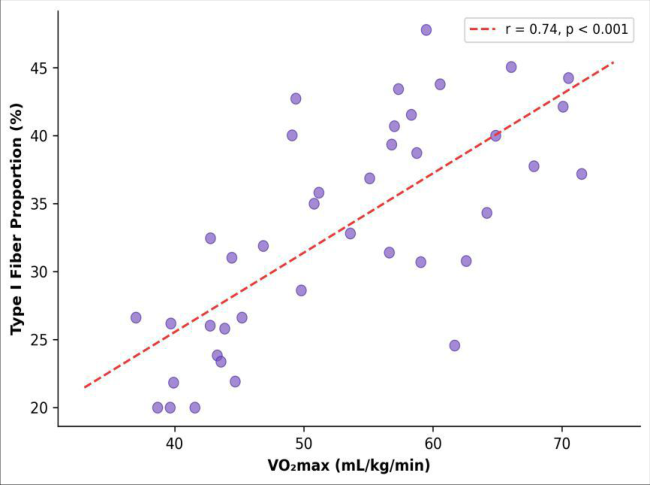 Figure 1
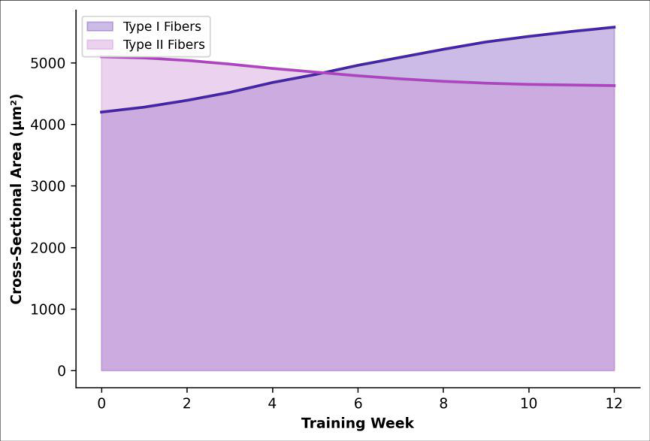 Figure 2
Introduction
A trend that has gained momentum in exercise science over the past decade is the use of molecular profiling to understand individual variability in training responses. Two people can follow identical exercise programmes yet show markedly different gains in aerobic capacity, and part of this variability appears rooted in baseline muscle fibre composition [1,2] . Skeletal muscle fibres are classified by their myosin heavy chain (MHC) isoform expression into slow-oxidative Type I, fast-oxidative Type IIa, and fast-glycolytic Type IIx categories, each with distinct contractile and metabolic properties [3] . Endurance training is known to shift the fibre profile toward a more oxidative phenotype, primarily by converting Type IIx fibres to Type IIa, with more modest increases in Type I proportion [4,5] . Accompanying these shifts are increases in mitochondrial density, capillarisation, and oxidative enzyme activity that together raise the muscle's capacity for aerobic energy production [6] . But most published time courses have used small samples, mixed-sex designs without stratification, or training protocols that vary widely in intensity and duration, making it difficult to establish reliable effect sizes [7] . This research applied a standardised 12-week cycling protocol to a moderately sized cohort, with pre-and post-training muscle biopsies analysed by immunohistochemistry and enzyme activity assays. Work was conducted at the Casablanca Institute of Biological Sciences, Casablanca, Morocco, between April 2023 and February 2024.
Training Protocol
Participants completed three supervised cycling sessions per week for 12 weeks on electronically braked ergometers (Lode Excalibur Sport, Groningen, Netherlands). Sessions lasted 45 minutes during weeks 1-4, increasing to 55 minutes during weeks 5-8 and 60 minutes during weeks 9-12. Intensity was maintained at 65-75% of individual VO2peak, verified by heart rate monitoring and periodic gas exchange spot-checks. Compliance was defined as attendance at 90% or more of scheduled sessions; three participants who fell below this threshold were excluded from analysis.
Anthropometric and Physiological Profile
Anthropometric and Physiological Profile
Methods
Muscle biopsies were taken from the vastus lateralis under local anaesthesia (2% lidocaine) using a Bergstrom needle with suction. Samples were oriented in OCT compound, frozen in isopentane cooled by liquid nitrogen, and stored at -80 degrees Celsius. Serial 10-um cryosections were immunostained with antibodies against MHC I (BA-D5), MHC IIa (SC-71), and MHC IIx (6H1), all from the Developmental Studies Hybridoma Bank (Iowa City, IA, USA). Fibre type proportions and cross-sectional areas were quantified using ImageJ on a minimum of 200 fibres per biopsy. Citrate synthase and succinate dehydrogenase activities were measured spectrophotometrically in muscle homogenates. Statistical analysis used paired t-tests for prepost comparisons and Pearson correlation for associations, with significance at p < 0.05. Type I fibres grew steadily throughout the programme, while Type II fibres showed a slight but non-significant decline (Figure 2). The divergence became apparent from week 4 onward and continued to widen through week 12.
Results
Results
Discussion
The near-halving of Type IIx fibre proportion is the most dramatic change we observed and sits at the upper end of published effect sizes for moderate-intensity endurance training [8,9] . This shift likely reflects a genuine transition in MHC isoform expression rather than selective hypertrophy, since Type IIa fibres increased proportionally. The underlying mechanism involves activation of PGC-1alpha and calcineurin signalling pathways that promote oxidative gene programmes and suppress fast-glycolytic transcription [10, 11] .
The correlation between baseline Type I proportion and VO2max gain raises the possibility that fibre composition acts as a ceiling on trainability. Individuals starting with more slow-twitch fibres may have a larger mitochondrial substrate on which training can act, amplifying the oxidative adaptation [12] . Alternatively, baseline fibre type may simply reflect prior physical activity levels not captured by our sixmonth washout criterion [13] .
Our cohort included both sexes but was not powered to detect sex-specific differences in fibre remodelling.
Published data suggest that women may show smaller Type IIx-to-IIa shifts but comparable oxidative enzyme gains, a pattern that warrants dedicated investigation [14,15] .
Conclusion
Conclusion
Figures and tables from the paper
| Variable | Baseline | Post- Training | Change (%) | p-value | ES (d) |
|---|---|---|---|---|---|
| Type I (%) | 47.8 (6.1) | 52.1 (5.8) | +9.0 | 0.014 | 0.72 |
| Type IIa (%) | 33.9 (5.4) | 38.2 (5.1) | +12.7 | 0.003 | 0.82 |
| Type IIx (%) | 18.3 (4.7) | 9.7 (3.9) | -47.0 | < 0.001 | 1.99 |
| CS Activity (umol/min/g) | 18.4 (3.2) | 24.8 (3.7) | +34.6 | < 0.001 | 1.85 |
| SDH Activity (umol/min/g) | 4.6 (1.1) | 5.9 (1.3) | +28.9 | < 0.001 | 1.08 |
| VO2peak (mL/kg/min) | 41.3 (5.8) | 48.7 (5.4) | +17.9 | < 0.001 | 1.32 |
Table text extracted from the original PDF; superscript letters are shown inline. The original table image is below.
View original table image
References
15 in the original paper- Bouchard C, An P, Rice T, et al. Familial aggregation of VO2max response to exercise training. Journal of Applied Physiology. 1999;87(3):1003-1008.
- Ross R, Goodpaster BH, Koch LG, et al. Precision exercise medicine: understanding exercise response variability. British Journal of Sports Medicine. 2019;53(18):1141-1153.
- Schiaffino S, Reggiani C. Fiber types in mammalian skeletal muscles. Physiological Reviews. 2011;91(4):1447-1531.
- Wilson JM, Loenneke JP, Jo E, et al. The effects of endurance, strength, and power training on muscle fiber type shifting. Journal of Strength and Conditioning Research. 2012;26(6):1724-1729.
- Howald H, Hoppeler H, Claassen H, et al. Influences of endurance training on the ultrastructural composition of the different muscle fiber types in humans. Pflugers Archiv. 1985;403(4):369-376.
- Holloszy JO, Coyle EF. Adaptations of skeletal muscle to endurance exercise and their metabolic consequences. Journal of Applied Physiology. 1984;56(4):831-838.
- Hawley JA, Hargreaves M, Joyner MJ, Zierath JR. Integrative biology of exercise. Cell. 2014;159(4):738749.
- Trappe S, Harber M, Creer A, et al. Single muscle fiber adaptations with marathon training. Journal of Applied Physiology. 2006;101(3):721-727.
- Andersen JL, Aagaard P. Effects of strength training on muscle fiber types and size: consequences for athletes training for high-intensity sport. Scandinavian Journal of Medicine and Science in Sports. 2010;20(Suppl 2):32-38.
- Lin J, Wu H, Tarr PT, et al. Transcriptional co-activator PGC-1alpha drives the formation of slow-twitch muscle fibres. Nature. 2002;418(6899):797-801.
- Egan B, Zierath JR. Exercise metabolism and the molecular regulation of skeletal muscle adaptation. Cell Metabolism. 2013;17(2):162-184.
- Coyle EF, Sidossis LS, Horowitz JF, Beltz JD. Cycling efficiency is related to the percentage of type I muscle fibers. Medicine and Science in Sports and Exercise. 1992;24(7):782-788.
- Simoneau JA, Bouchard C. Genetic determinism of fiber type proportion in human skeletal muscle. FASEB Journal. 1995;9(11):1091-1095.
- Staron RS, Hagerman FC, Hikida RS, et al. Fiber type composition of the vastus lateralis muscle of young men and women. Journal of Histochemistry and Cytochemistry. 2000;48(5):623-629.
- Joyner MJ, Coyle EF. Endurance exercise performance: the physiology of champions. Journal of Physiology. 2008;586(1):35-44.