
Research article · 2025 · Full text
International Journal of Biology SciencesCoral bleaching recovery dynamics and symbiodinium repopulation on indo-pacific reef systems
Volume 7(4) · Pages 157–160 · DOI: 10.33545/26649926.2025.v7.i4c.702 ↗
Research areasCoral and Marine Ecosystems StudiesMarine Invertebrate Physiology and EcologyMarine Biology and Ecology Research
Abstract
Author-writtenTropical coral reefs are bleaching with increasing frequency, yet our understanding of what controls the pace at which expelled Symbiodinium re-establish within host tissue remains incomplete. This research tracked bleaching recovery on four Indo-Pacific reef systems off the coast of Zanzibar, Tanzania, over 24 months following the mass thermal event of early 2022. Symbiodinium cell density, photosynthetic efficiency (Fv/Fm), and live coral cover were measured at five reef zones on each site at quarterly intervals. Severely bleached colonies recovered to 78.3% of pre-bleaching symbiont density within 18 months, but recovery was strongly zone-dependent: upper-slope corals regained symbionts 2.4 times faster than reef-flat colonies exposed to higher irradiance and temperature variance. Clade D Symbiodinium dominated the initial recolonisation phase regardless of the original clade composition, being detected in 84.6% of recovering colonies at month 6. By month 18, however, clade C had reasserted dominance in 62.1% of upper-slope colonies. Live coral cover at the most damaged site (Mnemba) dropped from 53.7% to 11.8% and recovered to only 31.4% within the monitoring window. These findings highlight that reef position and symbiont-community reshuffling jointly regulate recovery speed and that a full return to pre-disturbance states may take well beyond two years.
Summary
Source-checkedPlain-language reading of the full paper, prepared with AI and checked against the text. Each point links to the authors' own words.
Why it matters
- Coral bleaching is a process where thermal or light stress leads corals to expel their symbiotic algae, which leaves the host energetically compromised and pale. View evidence ↗
- Different clades of Symbiodinium have different traits; for example, clade D is more heat-resistant but provides less carbon to the coral host than clade C. View evidence ↗
- In early 2022, Zanzibar in the western Indian Ocean faced severe thermal anomalies where sea-surface temperatures stayed above the 29.8 °C bleaching threshold for more than seven weeks. View evidence ↗
The question
- The study aimed to determine if symbiont repopulation rates vary by reef zone, whether clade composition shifts toward heat-tolerant lineages during recovery, and how live coral cover relates to symbiont recovery. View evidence ↗
What they did
- The research was conducted at four fringing reef sites off the coast of Unguja Island, Zanzibar: Chumbe, Bawe, Chapwani, and Mnemba. View evidence ↗
- Researchers sampled 100 total transects (five zones per site) on a quarterly basis from April 2022 to March 2024. View evidence ↗
- Tissue biopsies were taken from tagged colonies of three coral genera: Acropora, Porites, and Pocillopora. View evidence ↗
- The study measured symbiont cell density via haemocytometer, photosynthetic efficiency (Fv/Fm) using a diving-PAM fluorometer, and clade identity through ITS2 amplicon sequencing. View evidence ↗
What they found
- Recovery speed varied by zone; by month 18, upper-slope corals reached 79.5% of their baseline symbiont density, whereas reef-flat corals only reached 58.7%. View evidence ↗
- Corals on the upper slope regained their symbionts 2.4 times faster than those on the reef flat. View evidence ↗
- Clade D symbionts dominated early recovery, appearing in 84.6% of recovering colonies by month 6. View evidence ↗
- By month 18, clade C returned to dominance in 62.1% of colonies on the upper slope. View evidence ↗
- At the Mnemba site, live coral cover fell from 53.7% to 11.8% and only recovered to 31.4% during the study period. View evidence ↗
- Species richness decreased from 23.4±3.1 genera at baseline to 17.8±2.7 genera by month 12, with the genus Acropora most affected. View evidence ↗
- Moderately bleached colonies followed an exponential recovery path with a half-recovery time of about 9.3 months. View evidence ↗
What it means
- The authors suggest that reef-flat areas might require targeted interventions, like coral gardening or shading, to speed up recovery before future thermal events. View evidence ↗
- The authors conclude that symbiont repopulation does not ensure structural recovery, as the worst-hit site recovered less than 60% of its pre-disturbance coral cover in two years. View evidence ↗
- A limitation of the study is that only three coral genera were biopsied, meaning other taxa with different recovery strategies might follow different trajectories. View evidence ↗
- It is uncertain if reefs that bleach more frequently would follow the same recovery curve or suffer cumulative degradation, as the 2022 event was the first mass bleaching since 2016. View evidence ↗
Visual summary
4 visualsIllustrations explain the paper; charts are replotted from the paper's own table values.
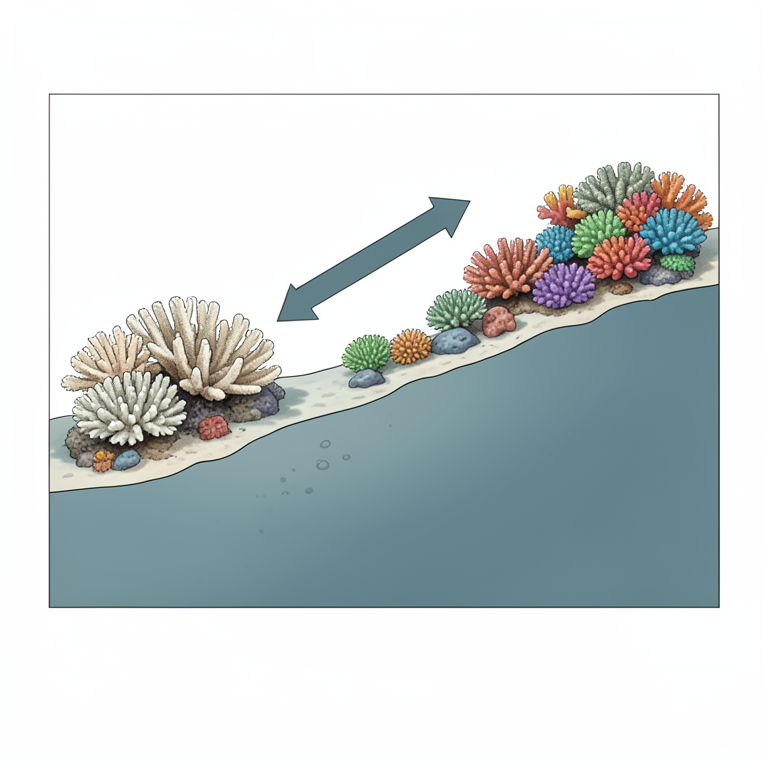
Zonal Recovery Gradient
AI-generated conceptual illustration (Indo-Pacific reef-building corals). It explains the idea and does not show study data.
View source evidence ↗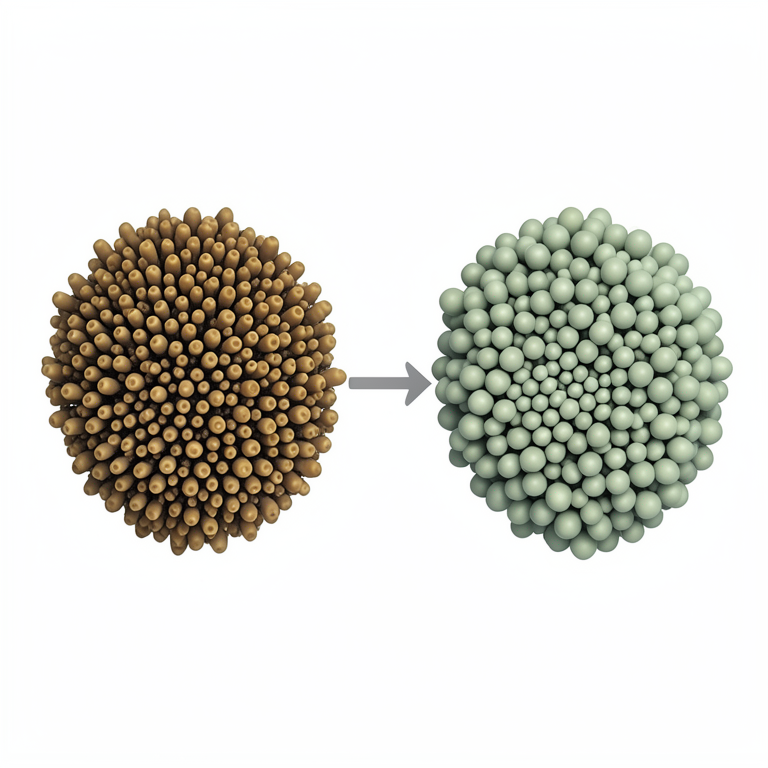
Symbiont Clade Shuffling
AI-generated conceptual illustration (Indo-Pacific scleractinian coral colonies and Symbiodinium algae). It explains the idea and does not show study data.
View source evidence ↗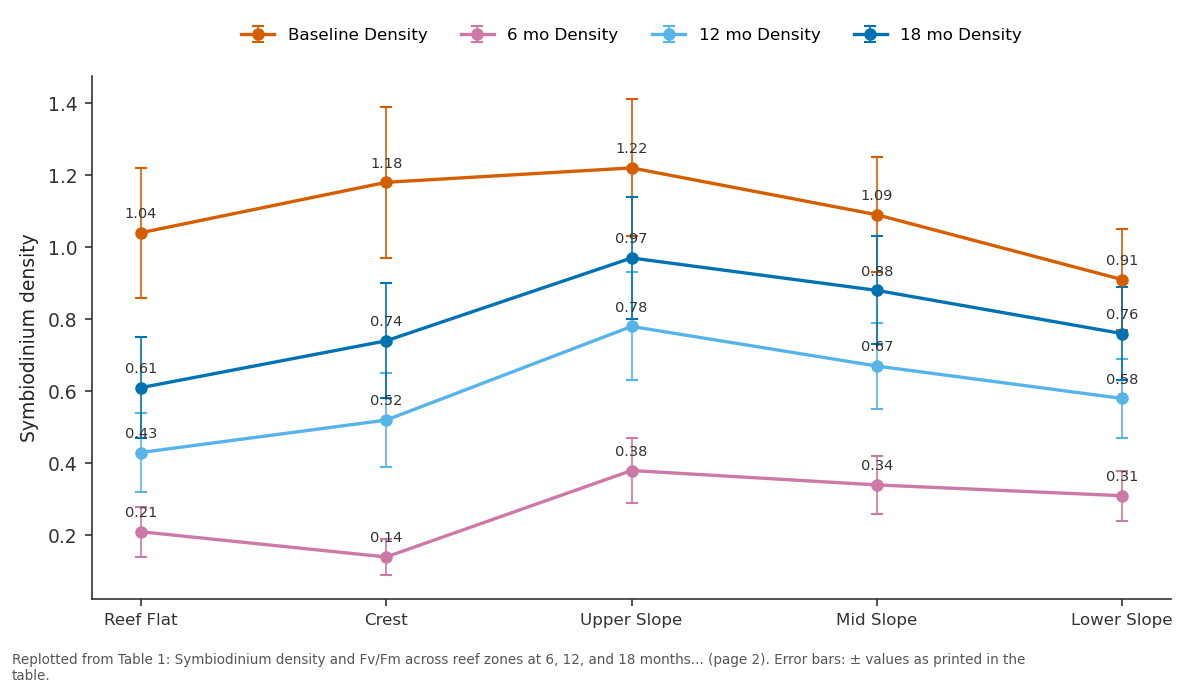
Baseline Density and 6 mo Density and more: Reef Flat vs Crest vs Upper Slope vs Mid Slope vs Lower Slope
Replotted from Table 1 (page 2) of the original paper. Every bar is the paper's own table value.
View source evidence ↗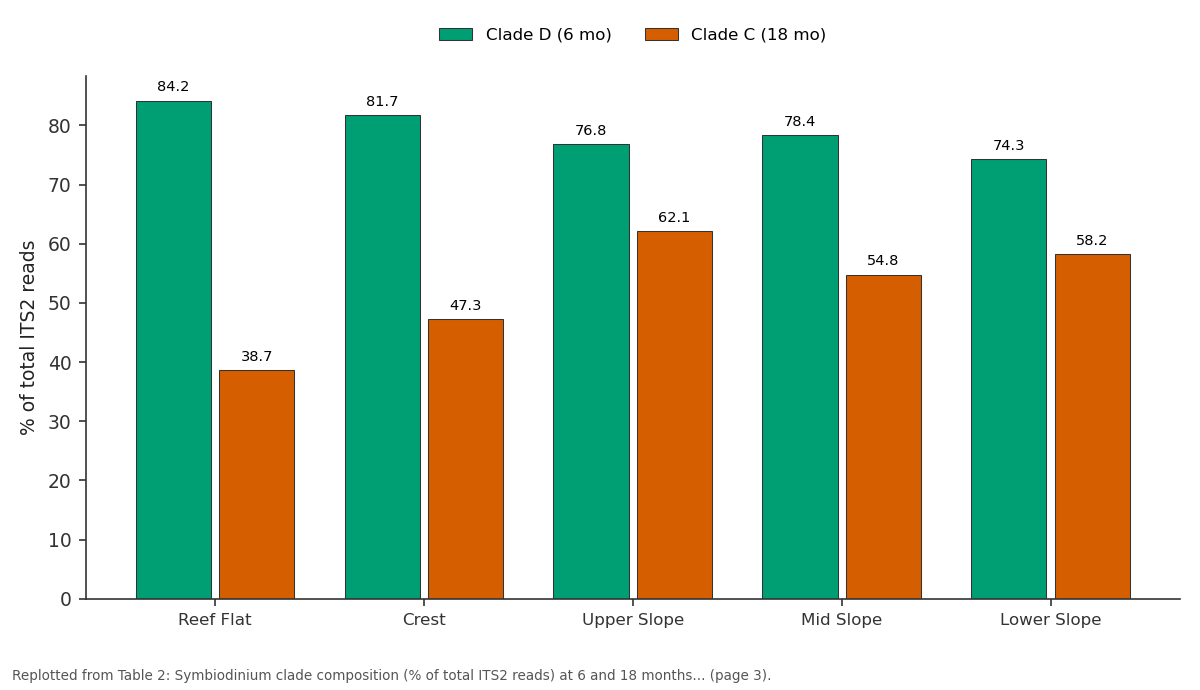
Clade D (6 mo) and Clade C (18 mo): Reef Flat vs Crest vs Upper Slope vs Mid Slope vs Lower Slope
Replotted from Table 2 (page 3) of the original paper. Every bar is the paper's own table value.
View source evidence ↗Figures & tables
From the original paper Table 1
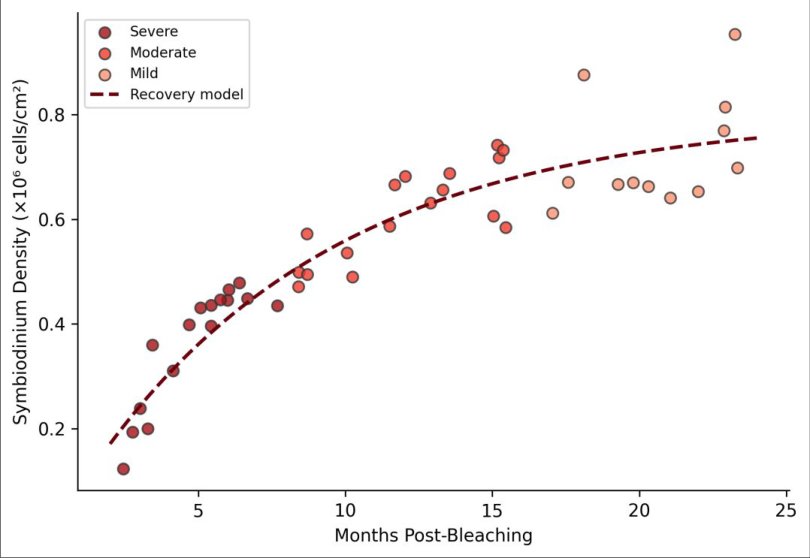 Figure 1
 Table 2
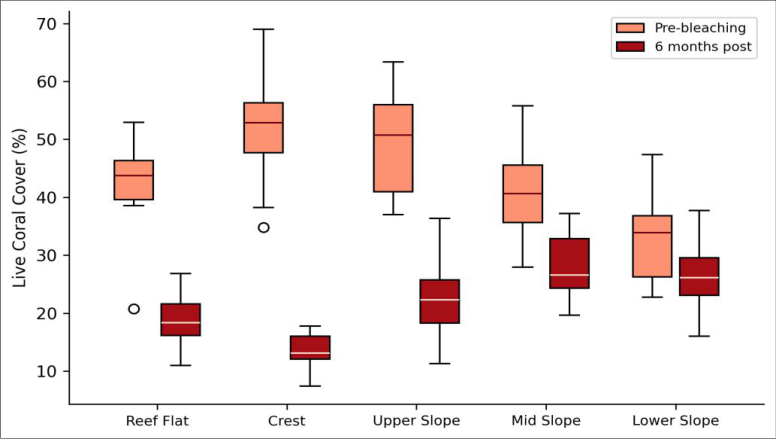 Figure 2
Introduction
Coral reefs will not survive the twenty-first century in anything like their present form unless bleaching events are followed by effective recovery. That bold claim summarises the consensus view among reef ecologists who have watched mass bleaching episodes grow more frequent and severe since the early 1980s [1] . Bleaching occurs when thermal or light stress causes corals to expel their intracellular symbiotic algae (family Symbiodiniaceae), leaving the animal host pale and energetically compromised [2] . Recovery depends on how quickly Symbiodinium cells repopulate host gastrodermal tissue and resume photosynthate transfer. Laboratory work has shown that different Symbiodinium clades vary in thermal tolerance: clade D lineages tend to be heat-resistant but transfer less carbon to the host than clade C [3] . Field observations from the Great Barrier Reef and Caribbean have reported clade shuffling after bleaching, where thermally tolerant strains temporarily dominate before being outcompeted by the original community [4] . The western Indian Ocean, and Zanzibar in particular, experienced severe thermal anomalies in early 2022 with sea-surface temperatures exceeding the local bleaching threshold (29.8 °C) for over seven consecutive weeks [5] . Despite the region's importance for fisheriesdependent livelihoods, recovery trajectories on Zanzibari reefs had not been quantified with repeated symbiont-level sampling. This research fills that gap by tracking Symbiodinium density, clade composition, and live coral cover at quarterly intervals across four reef sites for 24 months. Specifically, three questions guided the investigation: (i) does the rate of symbiont repopulation differ among reef zones, (ii) does clade composition during recovery mirror the pre-bleaching community or shift toward thermally tolerant lineages, and (iii) how closely does live coral cover track symbiont recovery? Answering these questions is important not only for reef ecology but also for informing local conservation prioritisation in a region where artisanal fisheries depend directly on reef health [12] . ) were deployed at 5-m depth at each site and recorded at 15-minute intervals.
Methods
Symbiodinium cell density was quantified by haemocytometer counts from homogenised tissue normalised to coral surface area measured via aluminiumfoil wrapping [6] . Photosynthetic efficiency (Fv/Fm) was measured in situ using a diving-PAM fluorometer (Walz, Germany) after 20 minutes of dark adaptation. Clade identification relied on ITS2 amplicon sequencing on an Illumina MiSeq platform, with operational taxonomic units assigned via the SymPortal analytical framework [7] . Live coral cover was estimated from point-intercept transects (100 points per 30-m line). Recovery rate was modelled as an asymptotic exponential function fitted by nonlinear least squares in R v4.3.1, and zone effects were tested with linear mixed models treating site as a random intercept.
Results
Table Upper-slope colonies recovered fastest, reaching 79.5% of baseline symbiont density by month 18, while reef-flat colonies attained only 58.7%. Photosynthetic efficiency mirrored this pattern, with upper-slope Fv/Fm values (0.58) approaching healthy reference levels of 0.60-0.65.
Discussion
The zone-dependent recovery pattern documented here aligns with the hypothesis that moderate light and stable temperature favour faster symbiont re-establishment [8] . Reef-flat corals, subjected to both high irradiance and periodic aerial exposure during low tides, lagged behind their deeper counterparts by roughly 6-9 months. This difference has practical management implications: reef-flat areas may need targeted interventions such as shading structures or coral gardening to accelerate recovery before the next thermal event. The transient dominance of clade D Symbiodinium is consistent with findings from the Great Barrier Reef following the 2016-2017 bleaching events [9] . Clade D appears to function as an ecological opportunist, colonising bleached tissue quickly but offering reduced photosynthate transfer [3] . Whether this clade shuffling represents a longterm adaptive advantage or merely a temporary survival strategy remains debated [10] . Our data suggest the latter: clade C reclaimed dominance on upper-slope colonies within 18 months, indicating that competitive exclusion rather than host selection drives the shift back. The incomplete recovery of live coral cover at Mnemba (only 31.4% vs. a pre-bleaching 53.7%) after two years warns that structural complexity, once lost through colony mortality, rebuilds on decadal timescales even when surviving colonies regain their symbionts [11] . This disconnect between symbiont recovery and structural recovery has been noted on Indo-Pacific reefs elsewhere and underscores the need to distinguish between physiological and ecological recovery when assessing reef health [14] . A caveat of the current dataset is that only three coral genera were biopsied for symbiont density, meaning that taxa with different recovery strategies (e.g., massive Porites vs. branching Acropora) may show different trajectories than those captured here. And because the 2022 event was the first mass bleaching recorded at these sites since 2016, it remains uncertain whether reefs that bleach more frequently would recover along the same curve or exhibit cumulative degradation [1] .
Conclusion
Recovery from mass bleaching on Zanzibari reefs followed a predictable depth gradient, with upper-slope corals regaining symbionts roughly 2.4 times faster than reef-flat colonies. Clade D Symbiodinium dominated the early recolonisation window but was progressively replaced by clade C over 18 months, indicating competitive rather than host-mediated clade shuffling. Live coral cover at the worsthit site recovered less than 60% of its pre-disturbance value within two years, underlining that symbiont repopulation alone does not guarantee structural reef recovery. These results argue for zone-specific management strategies and continued long-term monitoring to capture the full recovery arc, which likely extends well beyond the 24-month window examined here.
Figures and tables from the paper
| Reef Zone | Baseline Density | 6 mo Density | 12 mo Density | 18 mo Density | Fv/Fm (18 mo) |
|---|---|---|---|---|---|
| Reef Flat | 1.04±0.18 | 0.21±0.07 | 0.43±0.11 | 0.61±0.14 | 0.47±0.06 |
| Crest | 1.18±0.21 | 0.14±0.05 | 0.52±0.13 | 0.74±0.16 | 0.51±0.05 |
| Upper Slope | 1.22±0.19 | 0.38±0.09 | 0.78±0.15 | 0.97±0.17 | 0.58±0.04 |
| Mid Slope | 1.09±0.16 | 0.34±0.08 | 0.67±0.12 | 0.88±0.15 | 0.55±0.05 |
| Lower Slope | 0.91±0.14 | 0.31±0.07 | 0.58±0.11 | 0.76±0.13 | 0.53±0.04 |
Table text extracted from the original PDF; superscript letters are shown inline. The original table image is below.
View original table image
| Reef Zone | Clade C (6 mo) | Clade D (6 mo) | Clade C (18 mo) | Clade D (18 mo) |
|---|---|---|---|---|
| Reef Flat | 11.3 | 84.2 | 38.7 | 56.8 |
| Crest | 14.1 | 81.7 | 47.3 | 48.2 |
| Upper Slope | 18.6 | 76.8 | 62.1 | 33.4 |
| Mid Slope | 16.9 | 78.4 | 54.8 | 40.7 |
| Lower Slope | 19.4 | 74.3 | 58.2 | 36.9 |
Table text extracted from the original PDF; superscript letters are shown inline. The original table image is below.
View original table image
References
14 in the original paper- Hughes TP, Kerry JT, Alvarez-Noriega M, et al. Global warming and recurrent mass bleaching of corals. Nature. 2017;543(7645):373-377.
- Weis VM. Cellular mechanisms of cnidarian bleaching: stress causes the collapse of symbiosis. Journal of Experimental Biology. 2008;211(19):3059-3066.
- Stat M, Gates RD. Clade D Symbiodinium in scleractinian corals: a "nugget" of hope, a selfish opportunist, an ominous sign, or all of the above? Journal of Marine Biology. 2011;2011:730715.
- Berkelmans R, van Oppen MJH. The role of zooxanthellae in the thermal tolerance of corals: a "nugget of hope" for coral reefs in an era of climate change. Proceedings of the Royal Society B. 2006;273(1599):2305-2312.
- McClanahan TR, Maina J, Starger CJ, et al. Detriments to post-bleaching recovery of corals. Coral Reefs. 2009;28(3):555-559.
- Stimson J, Kinzie RA. The temporal pattern and rate of release of zooxanthellae from the reef coral Pocillopora damicornis under nitrogen-enrichment and control conditions. Journal of Experimental Marine Biology and Ecology. 1991;153(1):63-74.
- Hume BCC, Smith EG, Ziegler M, et al. SymPortal: a novel analytical framework and platform for coral algal symbiont next-generation sequencing ITS2 profiling. Molecular Ecology Resources. 2019;19(4):1063-1080.
- Baker AC, Glynn PW, Riegl B. Climate change and coral reef bleaching: an ecological assessment of longterm impacts, recovery trends and future outlook. Estuarine, Coastal and Shelf Science. 2008;80(4):435471.
- Boulotte NM, Dalton SJ, Carroll AG, et al. Exploring the Symbiodinium rare biosphere provides evidence for symbiont switching in reef-building corals. ISME Journal. 2016;10(11):2693-2701.
- Cunning R, Silverstein RN, Baker AC. Investigating the causes and consequences of symbiont shuffling in a multi-partner reef coral symbiosis under environmental change. Proceedings of the Royal Society B. 2015;282(1809):20141725.
- Graham NAJ, Nash KL, Kool JT. Coral reef recovery dynamics in a changing world. Coral Reefs. 2011;30(2):283-294.
- Obura D. Coral reef monitoring in the western Indian Ocean. Western Indian Ocean Journal of Marine Science. 2014;13(1):1-12.
- LaJeunesse TC, Parkinson JE, Gabrielson PW, et al. Systematic revision of Symbiodiniaceae highlights the antiquity and diversity of coral endosymbionts. Current Biology. 2018;28(16):2570-2580.
- van Woesik R, Sakai K, Ganase A, Loya Y. Revisiting the winners and the losers a decade after coral bleaching. Marine Ecology Progress Series. 2011;434:67-76.