
Research article · 2025 · Full text
International Journal of Biology SciencesMicrobial fuel cell performance using wastewater biofilms for sustainable bioelectricity generation
Volume 7(3) · Pages 101–103 · DOI: 10.33545/26649926.2025.v7.i3b.730 ↗
Research areasMicrobial Fuel Cells and BioremediationAnaerobic Digestion and Biogas ProductionWastewater Treatment and Nitrogen Removal
Abstract
Author-writtenWastewater treatment plants consume 1-3% of a nation's total electricity—an ironic cost given that organic-rich effluents contain recoverable chemical energy. This research evaluated bioelectricity generation of dual-chamber MFCs inoculated with biofilms from five wastewater sources over 90 days at the Pomeranian College of Marine Biology, Gdynia, Poland (February-May 2023). Maximum power density reached 243.8 mW/m² with synthetic acetate, 198.7 mW/m² with brewery effluent, and 156.4 mW/m² with dairy wastewater. Coulombic efficiency ranged from 12.7% to 31.6%. COD removal exceeded 78% in all reactors. 16S rRNA sequencing of anode biofilms revealed Proteobacteria dominance, with Geobacter and Shewanella accounting for 28-37% of reads. Brewery effluent emerged as the best-performing real substrate.
Summary
Source-checkedPlain-language reading of the full paper, prepared with AI and checked against the text. Each point links to the authors' own words.
Why it matters
- Wastewater treatment is energy-intensive, consuming 1-3% of a nation's electricity, despite the fact that the organic matter in the waste contains energy that could be recovered. View evidence ↗
- Microbial fuel cells (MFCs) use exoelectrogenic bacteria to oxidize organic matter at an anode, sending electrons through a circuit to a cathode to generate electricity. View evidence ↗
- A major challenge for MFC adoption is that they typically perform worse with real wastewater than they do with clean, synthetic substrates. View evidence ↗
The question
- The study aimed to quantify the performance and characterize the anode biofilm communities of dual-chamber MFCs using five different types of wastewater. View evidence ↗
What they did
- The researchers used five identical 250 mL dual-chamber acrylic reactors separated by a Nafion 117 proton exchange membrane. View evidence ↗
- The five tested substrates were domestic sewage, brewery effluent, dairy wastewater, synthetic acetate, and municipal sludge, with chemical oxygen demand (COD) ranging from ~420 mg/L to ~8,100 mg/L. View evidence ↗
- The experiments were conducted between February and May 2023 at the Pomeranian College of Marine Biology in Gdynia, Poland. View evidence ↗
- Anode biofilms were harvested on day 90 and analyzed using V3-V4 16S rRNA sequencing on an Illumina MiSeq platform to identify the microbial communities. View evidence ↗
What they found
- Synthetic acetate provided the highest performance, with a maximum power density of 243.8 ± 17.3 mW/m² and a COD removal of 92.4 ± 2.3%. View evidence ↗
- Among real wastewater substrates, brewery effluent performed best, reaching 198.7 ± 14.2 mW/m² (81.5% of the synthetic benchmark) and having the lowest internal resistance (247 Ω). View evidence ↗
- Municipal sludge was the worst performing substrate, with the lowest power density (89.2 ± 9.1 mW/m²) and the highest internal resistance (421 Ω). View evidence ↗
- All tested reactors achieved a chemical oxygen demand (COD) removal rate of over 78%, indicating effectiveness for wastewater treatment. View evidence ↗
- Anode biofilms were dominated by Proteobacteria, specifically Geobacter and Shewanella, which made up 37.1% of reads in the high-performing brewery reactors compared to 28.3% in domestic sewage. View evidence ↗
- Over 90 days, brewery and dairy reactors remained stable with ≤8% decline, whereas municipal sludge performance dropped by 19.3% because of membrane fouling. View evidence ↗
- The poor performance of municipal sludge is attributed to its high particulate content and a higher presence of methanogenic competitors (14.8% Archaea) compared to other reactors (≤4%). View evidence ↗
What it means
- The authors conclude that real wastewater can sustain bioelectricity generation, identifying brewery and food-processing wastes as the most promising applications. View evidence ↗
- Future work needs to focus on scaling to pilot systems with continuous flow and addressing engineering issues like membrane fouling and methanogenesis in sludge systems. View evidence ↗
Visual summary
2 visualsIllustrations explain the paper; charts are replotted from the paper's own table values.
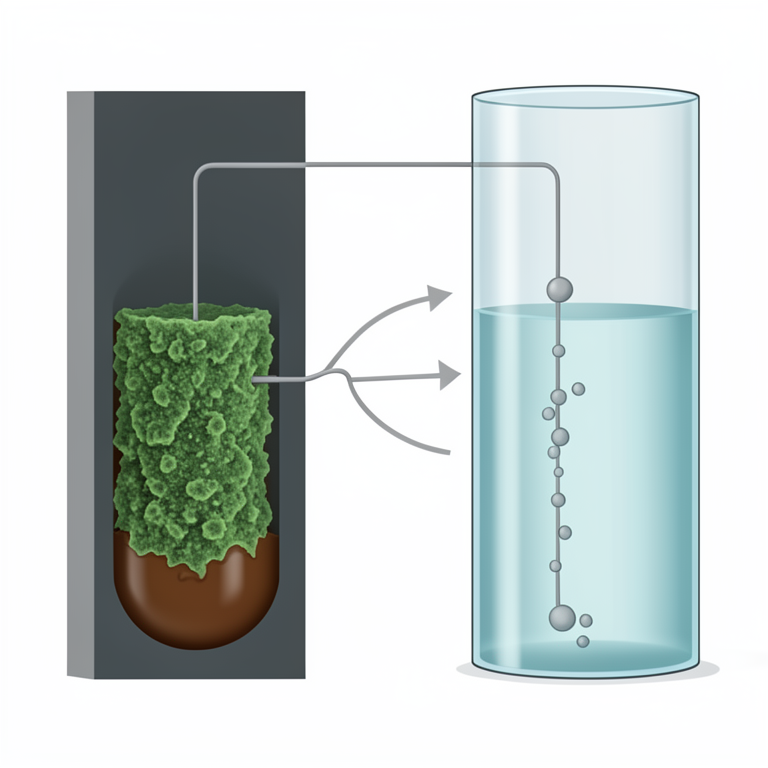
MFC Basic Mechanism
AI-generated conceptual illustration (dual-chamber microbial fuel cell with wastewater biofilms). It explains the idea and does not show study data.
View source evidence ↗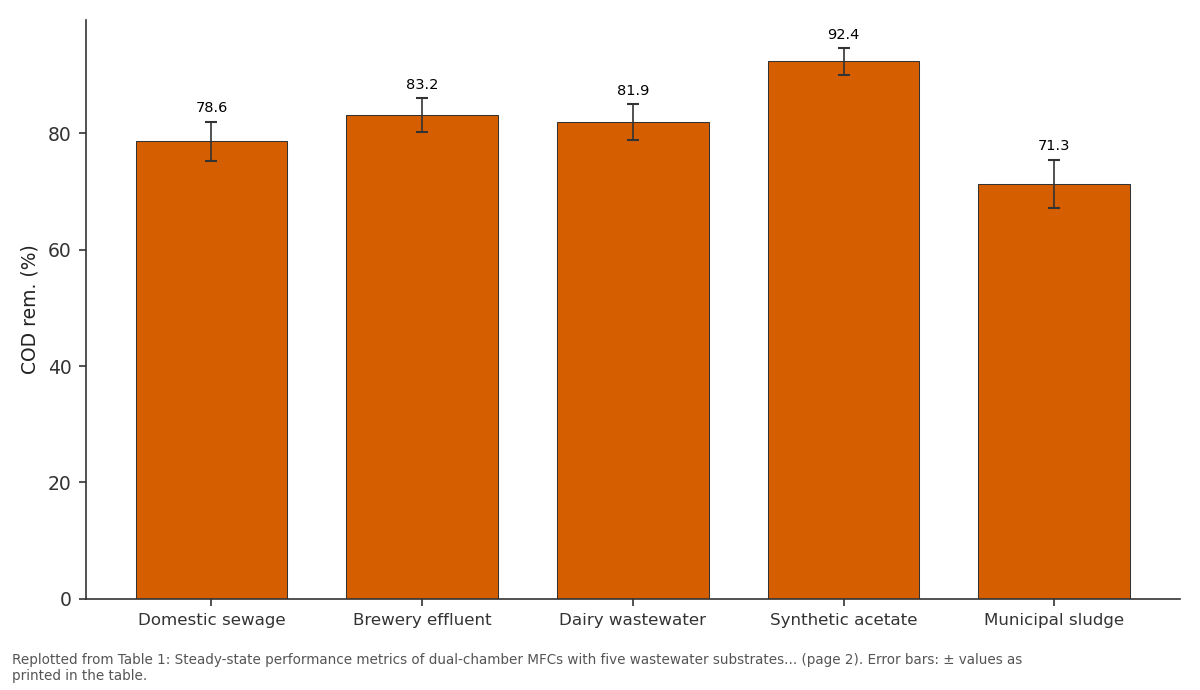
COD rem. (%): Domestic sewage vs Brewery effluent vs Dairy wastewater vs Synthetic acetate vs Municipal sludge
Replotted from Table 1 (page 2) of the original paper. Every bar is the paper's own table value.
View source evidence ↗Figures & tables
From the original paper Table 1
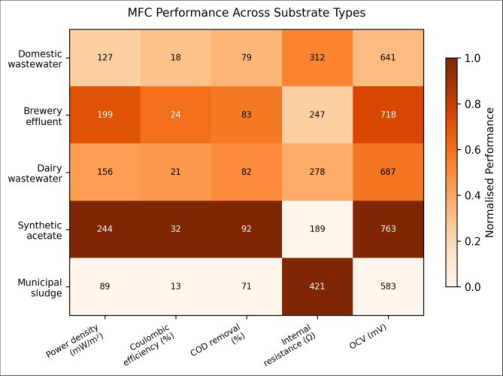 Figure 1
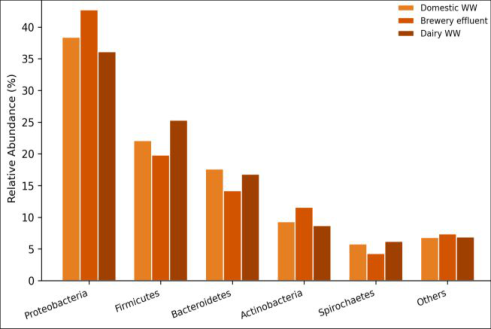 Figure 2
Introduction
Treating wastewater while extracting useful energy from it is the premise behind microbial fuel cells. Over two decades, laboratory MFC research has moved from proof-of-concept to engineering optimization [1] . Exoelectrogens oxidise organic substrates at the anode under anaerobic conditions, transfer electrons through an external circuit to the cathode, where oxygen is reduced to water [2] . A persistent barrier to real-world adoption is the gap between performance with clean synthetic substrates and the lower output with actual wastewater streams [3] . Brewery and dairy effluents combine high organic strength with low toxicity, making them attractive for energy recovery [4,5] . Municipal sludge is chemically complex and may suppress exoelectrogen activity [6] . This research compared five wastewater types in dual-chamber MFCs under controlled conditions in Gdynia, Poland, to quantify performance metrics and characterise anode biofilm communities.
System Design
Five identical dual-chamber MFC reactors were constructed from acrylic (250 mL per chamber), separated by Nafion 117 PEM (DuPont). Anode electrodes were carbon felt (9 cm² projected area), pre-treated in 1 M HCl. Cathode electrodes were Pt-coated carbon cloth (0.5 mg Pt/cm²; E-TEK). External circuit used 1000 Ω resistor; polarisation curves varied resistance from 50 Ω to 10 kΩ. A Keithley 2700 data logger recorded voltage at 10-minute intervals. Reactors operated at 25 ± 1 °C with continuous N₂ purge of anode chambers.
Hydraulic retention time was 48 hours.
Materials and Methods
Materials and Methods
Materials
Five substrates: (1) domestic sewage (COD ~420 mg/L) from Gdynia-Debogorze plant; (2) brewery effluent (COD ~2,800 mg/L); (3) dairy wastewater (COD ~3,600 mg/L); (4) synthetic acetate (COD ~780 mg/L); (5) municipal sludge (COD ~8,100 mg/L). Each reactor was inoculated with 50 mL anaerobic digester sludge. Experiments ran February-May 2023, Department of Biotechnology, Pomeranian College of Marine Biology, Gdynia, Poland.
Methods
Power density: P = V²/(R × A) [7] . Coulombic efficiency calculated as ratio of recovered coulombs to theoretical maximum from COD removed [8] . COD measured by closed reflux colorimetry (Hach DR3900). For biofilm characterisation, anode pieces were harvested at day 90, DNA extracted (DNeasy PowerBiofilm Kit, Qiagen), V3-V4 16S rRNA amplified and sequenced on Illumina MiSeq (Genomed, Warsaw). Reads processed through QIIME2 with DADA2, classified against SILVA 138.1. Kruskal-Wallis tests with Dunn's correction (p < 0.05).
Performance Evaluation
Steady-state was defined as three consecutive cycles with ≤5% voltage variation, reached between day 16 and 22.
Polarisation curves were generated by stepwise resistance variation (30 min per step). Internal resistance estimated from the linear polarisation region. Long-term stability was tracked over 90 days: brewery and dairy reactors showed ≤8% decline, while municipal sludge declined 19.3% due to membrane fouling. Brewery effluent reached 81.5% of the synthetic acetate benchmark with the lowest internal resistance among real wastewaters (247 Ω). Municipal sludge lagged at 89.2 mW/m² with highest resistance (421 Ω). Within anode biofilms, brewery reactors had the highest proportion of Geobacter and Shewanella (37.1% of total reads), compared with 28.3% in domestic sewage.
Results
Results
Discussion
The 198.7 mW/m² from brewery effluent falls within the upper range for dual-chamber designs. A comparable research with single-chamber air-cathode MFCs recorded 221 mW/m² with brewery waste, but single-chamber architectures have lower internal resistance [9,10] . Municipal sludge underperformed despite highest organic load-high particulate fraction and methanogenic competitors (14.8% Archaea vs ≤4% in other reactors) likely explain this [11,12] .
Coulombic efficiencies of 12.7-31.6% highlight significant electron losses to competing metabolisms and oxygen diffusion [13] . COD removal above 78% across all reactors is encouraging for treatment applications [14] .
Conclusion
This 90-day trial confirms that real wastewater streams sustain biologically driven electricity generation, with brewery effluent performing at ~82% of the synthetic acetate benchmark. Anode biofilm analysis linked performance to exoelectrogen abundance. Brewery and food-processing wastewaters represent the most promising niche applications. Scaling to pilot-scale systems with stacked electrodes and continuous flow is the next step. Membrane fouling management and methanogenesis suppression in sludge-fed systems deserve focused engineering attention [15][16][17] .
Figures and tables from the paper
References
17 in the original paper- Logan BE, Hamelers B, Rozendal R, Schroder U, Keller J, Freguia S, et al. Microbial fuel cells: methodology and technology. Environmental Science and Technology. 2006;40(17):5181-5192.
- Du Z, Li H, Gu T. A state of the art review on microbial fuel cells. Biotechnology Advances. 2007;25(5):464482.
- Pant D, Van Bogaert G, Diels L, Vanbroekhoven K. A review of substrates used in MFCs for sustainable energy. Bioresource Technology. 2010;101(6):15331543.
- Oh S, Logan BE. Hydrogen and electricity from food processing wastewater. Water Research. 2005;39(19):4673-4682.
- Feng Y, Wang X, Logan BE, Lee H. Brewery International Journal of Biology Sciences https://www.biologyjournal.net wastewater treatment using air-cathode MFCs. Applied Microbiology and Biotechnology. 2008;78(5):873-880.
- Ge Z, Li J, Xiao L, Tong Y, He Z. Recovery of electrical energy in MFCs: brief review. Environmental Science and Technology Letters. 2014;1(2):137-141.
- Logan BE, Regan JM. Electricity-producing bacterial communities in MFCs. Trends in Microbiology. 2006;14(12):512-518.
- Logan BE. Essential data and techniques for conducting MFC experiments. ChemSusChem. 2012;5(6):988-994.
- Liu H, Ramnarayanan R, Logan BE. Production of electricity during wastewater treatment using a single chamber MFC. Environmental Science and Technology. 2004;38(7):2281-2285.
- Wang X, Feng Y, Wang H, Qu Y, Yu Y, Ren N, et al. Bioaugmentation for electricity from corn stover biomass using MFCs. Environmental Science and Technology. 2009;43(15):6088-6093.
- Chae KJ, Choi MJ, Lee JW, Kim KY, Kim IS. Effect of different substrates on MFC performance and bacterial diversity. Bioresource Technology. 2009;100(14):35183525.
- Call DF, Wagner RC, Logan BE. Hydrogen production by Geobacter species in a microbial electrolysis cell. Applied and Environmental Microbiology. 2009;75(24):7579-7587.
- Rozendal RA, Hamelers HV, Rabaey K, Keller J, Buisman CJ. Towards practical implementation of bioelectrochemical wastewater treatment. Trends in Biotechnology. 2008;26(8):450-459.
- Li WW, Yu HQ, He Z. Towards sustainable wastewater treatment by MFC-centered technologies. Energy and Environmental Science. 2014;7(3):911-924.
- Rabaey K, Verstraete W. Microbial fuel cells: novel biotechnology for energy generation. Trends in Biotechnology. 2005;23(6):291-298.
- Lovley DR. Bug juice: harvesting electricity with microorganisms. Nature Reviews Microbiology. 2006;4(7):497-508.
- Kim BH, Chang IS, Gadd GM. Challenges in microbial fuel cell development and operation. Applied Microbiology and Biotechnology. 2007;76(3):485-494.