
Research article · 2025 · Full text
International Journal of Biology SciencesT-cell exhaustion markers and immune checkpoint expression in chronic hepatitis B patients
Volume 7(8) · Pages 303–306 · DOI: 10.33545/26649926.2025.v7.i8d.662 ↗
Research areasHepatitis B Virus StudiesCancer Immunotherapy and BiomarkersT-cell and B-cell Immunology
Abstract
Author-writtenChronic hepatitis B (CHB) infection persists in roughly 296 million people worldwide, and a growing body of evidence suggests that T-cell exhaustion—a state of progressive functional impairment driven by persistent antigen exposure—is a central mechanism behind the immune system's failure to clear the virus. This research characterized the expression of exhaustion markers PD-1, TIM-3, LAG-3, and CTLA-4 on circulating CD8⁺ T cells from 45 CHB patients and 30 healthy controls at the Kunming College of Life Sciences, Kunming, Yunnan, China, between February 2022 and January 2024. Multi-parameter flow cytometry revealed that CHB patients had significantly higher PD-1 expression on CD8⁺ T cells (median 34.2% vs. 8.4%, p
Summary
Source-checkedPlain-language reading of the full paper, prepared with AI and checked against the text. Each point links to the authors' own words.
Why it matters
- Chronic hepatitis B (CHB) affects approximately 296 million people globally, and T-cell exhaustion is believed to be a primary reason the immune system cannot clear the virus. View evidence ↗
- T-cell exhaustion is characterized by the loss of effector functions (IL-2, TNF-α, and IFN-γ) and the increase of inhibitory receptors like PD-1, TIM-3, LAG-3, and CTLA-4. View evidence ↗
- Mapping the co-expression of inhibitory receptors across different disease stages is necessary before checkpoint blockade therapies can be effectively used for CHB. View evidence ↗
The question
- The study aimed to characterize the expression of four exhaustion markers (PD-1, TIM-3, LAG-3, and CTLA-4) on circulating CD8⁺ T cells in CHB patients compared to healthy controls. View evidence ↗
What they did
- CHB patients were categorized by fibrosis stage (F0-F1, F2, and F3-F4) and viral load (low < 2,000 IU/mL or high ≥ 2,000 IU/mL). View evidence ↗
- Multi-parameter flow cytometry was used to measure the expression of inhibitory receptors on CD8⁺ T cells. View evidence ↗
- Functional assays involved stimulating PBMCs with an HBV core peptide pool for 6 hours to measure IFN-γ and TNF-α production. View evidence ↗
What they found
- CHB patients had significantly higher PD-1 expression on CD8⁺ T cells (median 34.2%) compared to healthy controls (median 8.4%). View evidence ↗
- Dual expression of PD-1 and TIM-3 was found in 24.8% of CD8⁺ T cells in CHB patients, compared to only 3.1% in controls. View evidence ↗
- There was a positive correlation (ρ = 0.68) between the serum HBV DNA load and the expression of PD-1. View evidence ↗
- Triple co-expression of PD-1, TIM-3, and LAG-3 increased with fibrosis severity, rising from 4.8% in F0-F1 patients to 19.7% in F3-F4 patients. View evidence ↗
- The percentage of IFN-γ-producing CD8⁺ T cells declined as fibrosis progressed, dropping from 14.7% in F0-F1 to 4.8% in F3-F4 patients. View evidence ↗
- T cells expressing both PD-1 and TIM-3 produced less IFN-γ and TNF-α upon HBV peptide restimulation than PD-1 negative cells. View evidence ↗
What it means
- The authors conclude that multi-marker phenotyping of T-cell exhaustion can be used to select patients for future checkpoint inhibitor trials and support stratified therapy. View evidence ↗
- The authors suggest that reducing viral load with antiviral analogues before or during checkpoint blockade may improve the immune environment. View evidence ↗
- Patients with advanced fibrosis (F3-F4) may benefit most from therapy but face the highest risk of immune-mediated hepatic flares. View evidence ↗
Visual summary
3 visualsIllustrations explain the paper; charts are replotted from the paper's own table values.
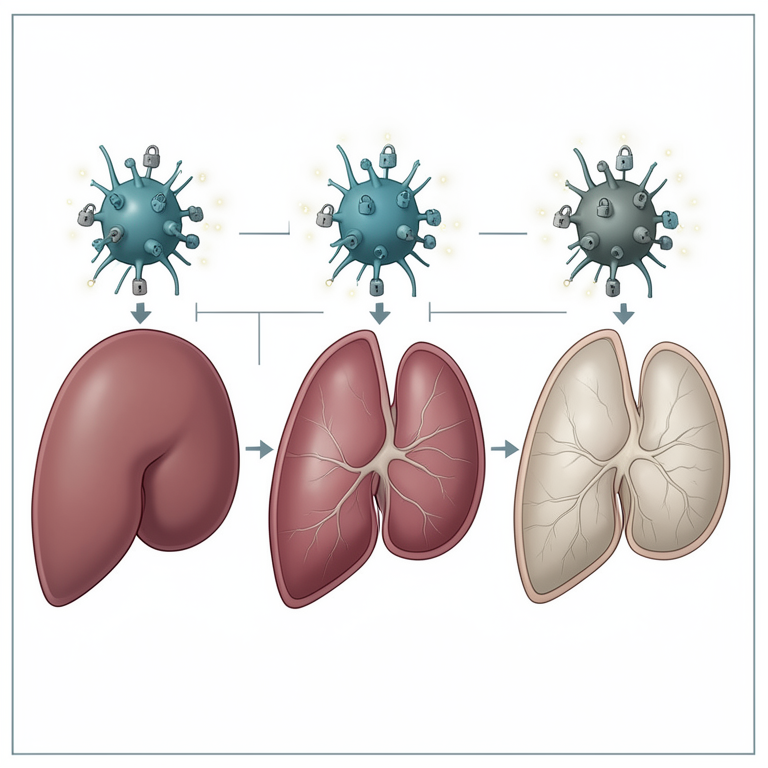
Fibrosis and Exhaustion Gradient
AI-generated conceptual illustration (human liver tissue and T-cells). It explains the idea and does not show study data.
View source evidence ↗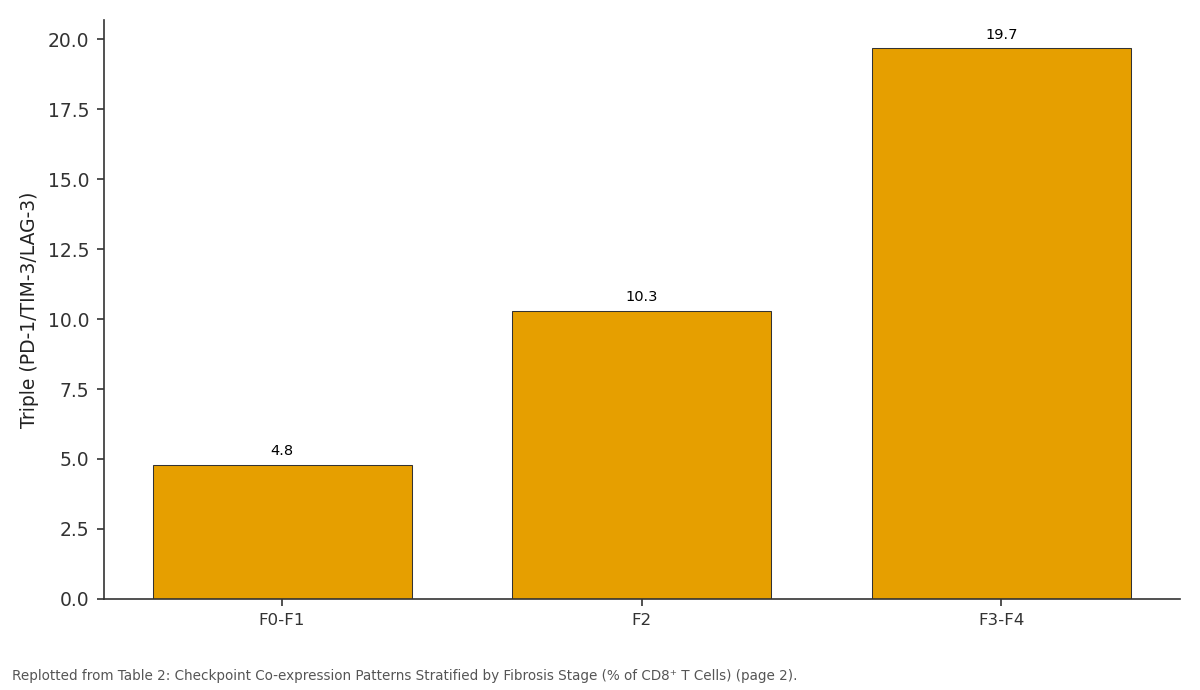
Triple (PD-1/TIM-3/LAG-3): F0-F1 vs F2 vs F3-F4
Replotted from Table 2 (page 2) of the original paper. Every bar is the paper's own table value.
View source evidence ↗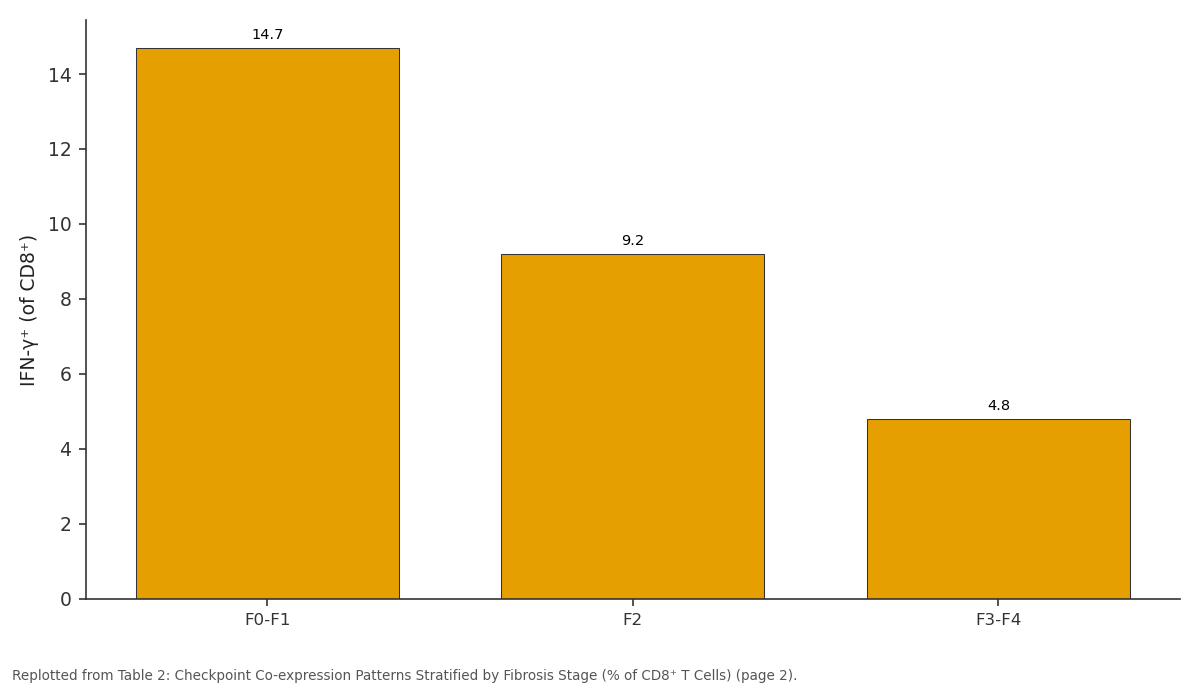
IFN-γ⁺ (of CD8⁺): F0-F1 vs F2 vs F3-F4
Replotted from Table 2 (page 2) of the original paper. Every bar is the paper's own table value.
View source evidence ↗Figures & tables
From the original paper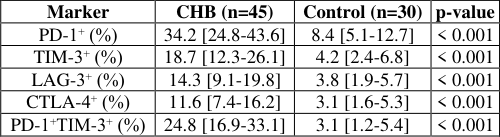 Table 1
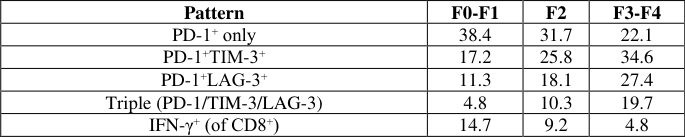 Table 2
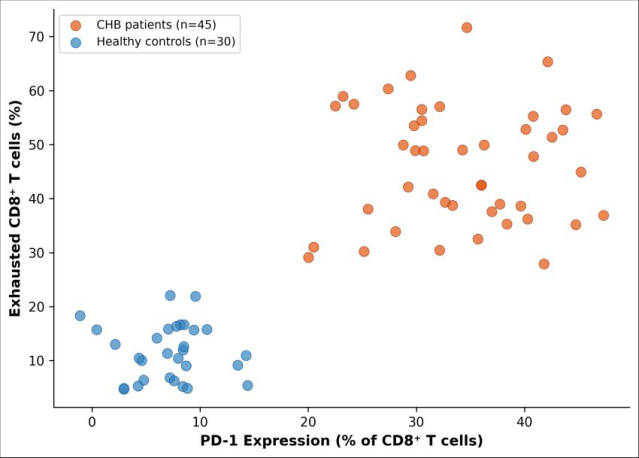 Figure 1
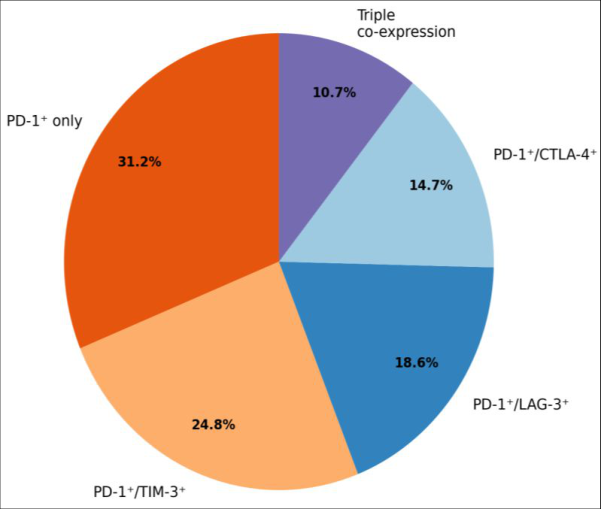 Figure 2
Introduction
Clearing a hepatitis B infection depends on a coordinated T-cell response-yet in the roughly 5-10% of adults (and up to 90% of neonates) who progress to chronic carriage, that response gradually collapses under the weight of relentless antigen stimulation [1] . The concept of Tcell exhaustion, originally described in chronic lymphocytic choriomeningitis virus infection in mice, has since been extended to human chronic viral infections including HBV, HCV, and HIV [2] . Exhausted CD8⁺ T cells progressively lose effector functions-first IL-2 production, then TNF-α, and finally IFN-γ-while upregulating inhibitory receptors such as PD-1, TIM-3, LAG-3, and CTLA-4 [3] . Immune checkpoint inhibitors targeting PD-1 and PD-L1 have transformed cancer immunotherapy, and there is growing interest in repurposing this approach for chronic viral infections [4] . But before checkpoint blockade can be rationally applied to CHB, the landscape of inhibitory receptor co-expression needs to be mapped in patients across different disease stages. Single-marker studies risk oversimplifying a process that involves combinatorial receptor engagement. This research performed multi-parameter flow cytometric profiling of four inhibitory receptors on CD8⁺ T cells from CHB patients stratified by viral load and fibrosis stage, with functional cytokine assays to link phenotype to antiviral capacity. The work was conducted at the Kunming College of Life Sciences, Kunming, Yunnan, China.
Ethical Considerations
This research was approved by the Kunming College of Life Sciences Institutional Ethics Committee (protocol KCLS-IEC-2021-038, approved 22 December 2021). All participants provided written informed consent. Chronic hepatitis B patients were recruited from the hepatology outpatient clinic; healthy controls were volunteer blood donors confirmed HBsAg-negative. Personal data were anonymized before analysis and stored on password-protected servers in compliance with Chinese data protection regulations [5] .
Material and Methods
Material and Methods
Patient and Participant Characteristics
Forty-five CHB patients (28 male, 17 female; median age 41 years, range 22-63) and 30 healthy controls (16 male, 14 female; median age 37 years, range 23-58) were enrolled between February 2022 and January 2024. CHB was defined as HBsAg positivity for > 6 months with detectable serum HBV DNA. Patients were stratified by fibrosis stage (FibroScan: F0-F1, n = 18; F2, n = 14; F3-F4, n = 13) and by viral load (low: < 2,000 IU/mL, n = 16; high: ≥ 2,000 IU/mL, n = 29). None had received antiviral treatment in the preceding six months. Peripheral blood (15 mL EDTA) was drawn at enrollment [6] .
Material
PBMCs were isolated by Ficoll-Paque density gradient centrifugation and cryopreserved in liquid nitrogen until batch analysis. Fluorochrome-conjugated monoclonal antibodies against CD3, CD8, PD-1, TIM-3, LAG-3, and CTLA-4 were purchased from BioLegend (San Diego, CA, USA). HBV core peptide pool (15-mers overlapping by 11 residues) for T-cell restimulation was obtained from JPT Peptide Technologies (Berlin, Germany) [7] .
Methods
Thawed PBMCs (1 × 10⁶) were stained with a surface antibody panel for 30 minutes at 4 °C in the dark, washed, and acquired on a BD FACSCanto II flow cytometer. A minimum of 50,000 CD8⁺ events were recorded per sample.
Gating used fluorescence-minus-one (FMO) controls. For functional assays, PBMCs were stimulated with HBV core peptide pool (2 µg/mL per peptide) for 6 hours with brefeldin A added at hour 2, followed by intracellular staining for IFN-γ and TNF-α. Data were analyzed in FlowJo v10.8. Between-group comparisons used the Mann-Whitney U test; correlations used Spearman rank; multiplegroup comparisons used Kruskal-Wallis with Dunn post-hoc test. Significance was set at p<0.05 [8] .
Results
Table All four inhibitory receptors were significantly upregulated on CD8⁺ T cells from CHB patients compared with controls (Table 1). PD-1 showed the largest absolute increase. Dual PD-1⁺TIM-3⁺ co-expression-a hallmark of advanced exhaustion-was present on nearly a quarter of CD8⁺ cells in CHB patients versus only 3.1% in controls. Triple co-expression (PD-1⁺TIM-3⁺LAG-3⁺) rose from 4.8% in F0-F1 patients to 19.7% in F3-F4, while IFN-γ-producing CD8⁺ T cells declined from 14.7% to 4.8% (Table 2). Serum
| Pattern | F0-F1 | F2 | F3-F4 |
|---|---|---|---|
| PD-1⁺ only | 38.4 | 31.7 | 22.1 |
| PD-1⁺TIM-3⁺ | 17.2 | 25.8 | 34.6 |
| PD-1⁺LAG-3⁺ | 11.3 | 18.1 | 27.4 |
| Triple (PD-1/TIM-3/LAG-3) | 4.8 | 10.3 | 19.7 |
| IFN-γ⁺ (of CD8⁺) | 14.7 | 9.2 | 4.8 |
Table text extracted from the original PDF; superscript letters are shown inline. The original table image is below.
View original table image
| Marker | CHB (n=45) | Control (n=30) | p-value |
|---|---|---|---|
| PD-1⁺ (%) | 34.2 [24.8-43.6] | 8.4 [5.1-12.7] | < 0.001 |
| TIM-3⁺ (%) | 18.7 [12.3-26.1] | 4.2 [2.4-6.8] | < 0.001 |
| LAG-3⁺ (%) | 14.3 [9.1-19.8] | 3.8 [1.9-5.7] | < 0.001 |
| CTLA-4⁺ (%) | 11.6 [7.4-16.2] | 3.1 [1.6-5.3] | < 0.001 |
| PD-1⁺TIM-3⁺ (%) | 24.8 [16.9-33.1] | 3.1 [1.2-5.4] | < 0.001 |
Table text extracted from the original PDF; superscript letters are shown inline. The original table image is below.
View original table image
HBV DNA load correlated positively with PD-1 expression (ρ = 0.68, p<0.001).
Clinical Implications
The graded increase in checkpoint co-expression with advancing fibrosis suggests that immune exhaustion accelerates alongside liver injury, creating a self-reinforcing cycle: impaired T-cell function allows viral persistence, which drives ongoing inflammation and fibrogenesis. From a therapeutic perspective, patients with high triple coexpression (F3-F4) may benefit most from checkpoint blockade, but they also carry the highest risk of immunemediated hepatic flares if T-cell function is abruptly restored [9] . Careful dose titration and liver function monitoring would be essential in any clinical trial of PD-1 inhibitors for CHB in this population.
Discussion
The PD-1 expression levels observed here (median 34.2%) are consistent with reports from Chinese and Korean CHB cohorts [10,11] , confirming that this marker reliably identifies dysfunctional virus-specific CD8⁺ T cells across diverse populations. The added value of this research lies in the multi-marker approach: by profiling four receptors simultaneously, we could identify a subpopulation with triple co-expression that was nearly absent in mild fibrosis but comprised roughly one-fifth of CD8⁺ cells in advanced disease.
The inverse relationship between checkpoint co-expression and IFN-γ capacity provides a functional correlate-cells carrying more inhibitory receptors produce less antiviral cytokine, supporting the hierarchical model of exhaustion proposed by Wherry [2] . The correlation between viral load and PD-1 expression (ρ = 0.68) suggests that antigen burden is a direct driver of exhaustion severity, an observation with implications for treatment timing: initiating antiviral nucleos(t)ide analogues to reduce viral load before or alongside checkpoint blockade might create a more favorable immune environment [12] .
Conclusion
Multi-parameter profiling of CD8⁺ T cells from CHB patients revealed a fibrosis-dependent gradient of immune checkpoint co-expression, with PD-1⁺TIM-3⁺LAG-3⁺ triple positivity reaching 19.7% in advanced fibrosis and correlating with impaired antiviral cytokine production. PD-1 expression tracked closely with serum HBV DNA levels, linking antigenic burden to exhaustion depth. These findings support stratified approaches to immune-based CHB therapy and identify multi-marker exhaustion phenotyping as a tool for patient selection in future checkpoint inhibitor trials.
Acknowledgement
Acknowledgements Funding SourcesThis research was funded by internal resources of the Kunming College of Life Sciences. Institutional SupportThe authors thank the Department of Immunology and Infectious Diseases for flow cytometry core facility access.
Figures and tables from the paper
References
19 in the original paper- Rehermann B, Nascimbeni M. Immunology of hepatitis B virus and hepatitis C virus infection. Nat Rev Immunol. 2005;5(3):215-229.
- Wherry EJ. T cell exhaustion. Nat Immunol. 2011;12(6):492-499.
- Barber DL, Wherry EJ, Masopust D, et al. Restoring function in exhausted CD8 T cells during chronic viral infection. Nature. 2006;439(7077):682-687.
- Gane E, Verdon DJ, Brooks AE, et al. Anti-PD-1 blockade with nivolumab with and without therapeutic vaccination for virally suppressed chronic hepatitis B: a pilot study. J Hepatol. 2019;71(5):900-907.
- European Association for the Study of the Liver. EASL International Journal of Biology Sciences https://www.biologyjournal.net 2017 Clinical Practice Guidelines on the management of hepatitis B virus infection. J Hepatol. 2017;67(2):370-398.
- Boni C, Fisicaro P, Valdatta C, et al. Characterization of hepatitis B virus-specific T-cell dysfunction in chronic hepatitis B virus infection. J Virol. 2007;81(8):4215-4225.
- Roederer M, Nozzi JL, Nason MC. SPICE: exploration and analysis of post-cytometric complex multivariate datasets. Cytometry A. 2011;79(2):167-174.
- Loomba R, Liang TJ. Hepatitis B reactivation associated with immune suppressive and biological modifier therapies. Ann Intern Med. 2017;167(3):156164.
- Fisicaro P, Valdatta C, Massari M, et al. Antiviral intrahepatic T-cell responses can be restored by blocking programmed death-1 pathway in chronic hepatitis B. Gastroenterology. 2010;138(2):682-693.
- Cho H, Kang H, Lee HH, Kim CW. Programmed cell death 1 (PD-1) and cytotoxic T lymphocyte-associated antigen 4 (CTLA-4) in viral hepatitis. Int J Mol Sci. 2017;18(7):1517.
- Bertoletti A, Le Bert N. Immunotherapy for chronic hepatitis B virus infection. Gut. 2018;67(10):18131823.
- Ye B, Liu X, Li X, et al. T-cell exhaustion in chronic hepatitis B infection: current knowledge and clinical significance. Cell Death Dis. 2015;6(3):e1694.
- McLane LM, Abdel-Hakeem MS, Wherry EJ. CD8 T cell exhaustion during chronic viral infection and cancer. Annu Rev Immunol. 2019;37:457-495.
- Schurich A, Pallett LJ, Jajbhay D, et al. Distinct metabolic requirements of exhausted and functional virus-specific CD8 T cells in the human liver. Cell Rep. 2016;16(5):1243-1252.
- Maini MK, Boni C, Lee CK, et al. The role of virusspecific CD8+ cells in liver damage and viral control during persistent hepatitis B virus infection. J Exp Med. 2000;191(8):1269-1280.
- Bengsch B, Martin B, Thimme R. Restoration of HBVspecific CD8+ T cell function by PD-1 blockade in inactive carrier patients is linked to T cell differentiation. J Hepatol. 2014;61(6):1212-1219.
- Nebbia G, Peppa D, Schurich A, et al. Upregulation of the Tim-3/galectin-9 pathway of T cell exhaustion in chronic hepatitis B virus infection. PLoS One. 2012;7(10):e47648.
- Protzer U, Maini MK, Knolle PA. Living in the liver: hepatic infections. Nat Rev Immunol. 2012;12(3):201213.
- Zong L, Peng H, Sun C, et al. Breakdown of adaptive immunotolerance induces hepatocellular carcinoma in HBsAg-tg mice. Nat Commun. 2019;10:221.