
Research article · 2025 · Full text
International Journal of Biology SciencesSingle-cell transcriptomics reveals heterogeneity in tumor-infiltrating lymphocyte populations
Volume 7(3) · Pages 114–116 · DOI: 10.33545/26649926.2025.v7.i3b.746 ↗
Research areasCancer Immunotherapy and BiomarkersSingle-cell and spatial transcriptomicsT-cell and B-cell Immunology
Abstract
Author-writtenBulk RNA sequencing treats tumor-infiltrating lymphocytes (TILs) as a homogeneous mass, but a growing body of evidence suggests that the anti-tumor immune response is orchestrated by functionally distinct T cell subsets whose proportions vary across patients and cancer types. This research applied droplet-based single-cell RNA sequencing (scRNA-seq) to characterise TIL heterogeneity in 22 treatment-naive solid tumors (12 breast, 10 colorectal) collected at the Sikkim Institute of Biological Sciences, Gangtok, India, between March and November 2023. A total of 68,417 CD45+ cells passed quality filtering, and unsupervised clustering identified seven distinct lymphocyte populations: CD8+ cytotoxic, CD8+ exhausted, CD4+ Th1, CD4+ regulatory T cells (Treg), CD4+ T follicular helper (Tfh), NK-like, and gamma-delta T cells. CD8+ exhausted cells, defined by co-expression of PDCD1, HAVCR2, and LAG3, comprised 18.3% of breast tumor TILs but only 14.2% of colorectal TILs (p = 0.024). Tregs were proportionally higher in colorectal tumors (15.1% vs 12.8%; p = 0.038). Trajectory analysis suggested a continuous transition from cytotoxic to exhausted CD8+ states. These findings map the immune landscape at single-cell resolution and may help stratify patients for checkpoint immunotherapy.
Summary
Source-checkedPlain-language reading of the full paper, prepared with AI and checked against the text. Each point links to the authors' own words.
Why it matters
- Tumor-infiltrating lymphocytes (TILs), particularly CD8+ cytotoxic T cells, are primary drivers of anti-tumor immunity, though they can vary in state from active to exhausted. View evidence ↗
- Only 20-40% of patients respond to checkpoint inhibitors, indicating that the specific composition and functional state of TILs are critical for treatment success. View evidence ↗
- While TIL subsets are well-documented in Western cohorts, there is a lack of data regarding South Asian populations, who may have different genetic and environmental backgrounds. View evidence ↗
The question
- The study aimed to identify distinct lymphocyte clusters in 22 Indian patients with breast or colorectal cancer, compare their proportions across these cancer types, and trace the transition of CD8+ cells from cytotoxic to exhausted states. View evidence ↗
What they did
- The study used fresh tumor tissue from 22 treatment-naive patients (12 with breast adenocarcinoma and 10 with colorectal adenocarcinoma) collected in Gangtok, India, from March to November 2023. View evidence ↗
- Immune cells were isolated from the tissue using anti-CD45 magnetic beads to achieve a purity of over 90%. View evidence ↗
- Single-cell RNA sequencing was performed using the 10x Genomics Chromium kit and an Illumina NovaSeq 6000, targeting 5,000 cells per sample with approximately 50,000 reads per cell. View evidence ↗
- Data analysis was conducted using Seurat v5.0, employing SCTransform normalization, PCA, UMAP for dimensionality reduction, and Louvain clustering. View evidence ↗
What they found
- From 68,417 quality-filtered CD45+ cells, the researchers identified seven distinct lymphocyte populations, including various CD8+ and CD4+ T cell subsets, NK-like cells, and gamma-delta T cells. View evidence ↗
- Breast tumors exhibited a significantly higher proportion of exhausted CD8+ cells compared to colorectal tumors (18.3% vs 14.2%, p = 0.024). View evidence ↗
- Colorectal tumors had a significantly higher proportion of regulatory T cells (Tregs) than breast tumors (15.1% vs 12.8%, p = 0.038). View evidence ↗
- Trajectory analysis revealed a continuous transition from cytotoxic to exhausted CD8+ states, characterized by the increase of PDCD1, HAVCR2, and TOX and the decrease of GZMB and PRF1. View evidence ↗
What it means
- The authors conclude that because CD8+ cells transition continuously toward exhaustion, timing immunotherapy to intervene before terminal exhaustion occurs may be critical for success. View evidence ↗
- The authors recommend expanding this research to larger cohorts with clinical outcome data to develop predictive models for immunotherapy response based on TIL composition. View evidence ↗
- The study was limited by a small sample size (22 tumors), which reduced statistical power for rare cells, and the exclusion of non-immune cells, which prevented analysis of full microenvironment communication. View evidence ↗
- Potential limitations include the loss of fragile cells or altered profiles due to enzymatic dissociation, and the fact that the treatment-naive status of patients means the study cannot address post-treatment TIL changes. View evidence ↗
Visual summary
3 visualsIllustrations explain the paper; charts are replotted from the paper's own table values.
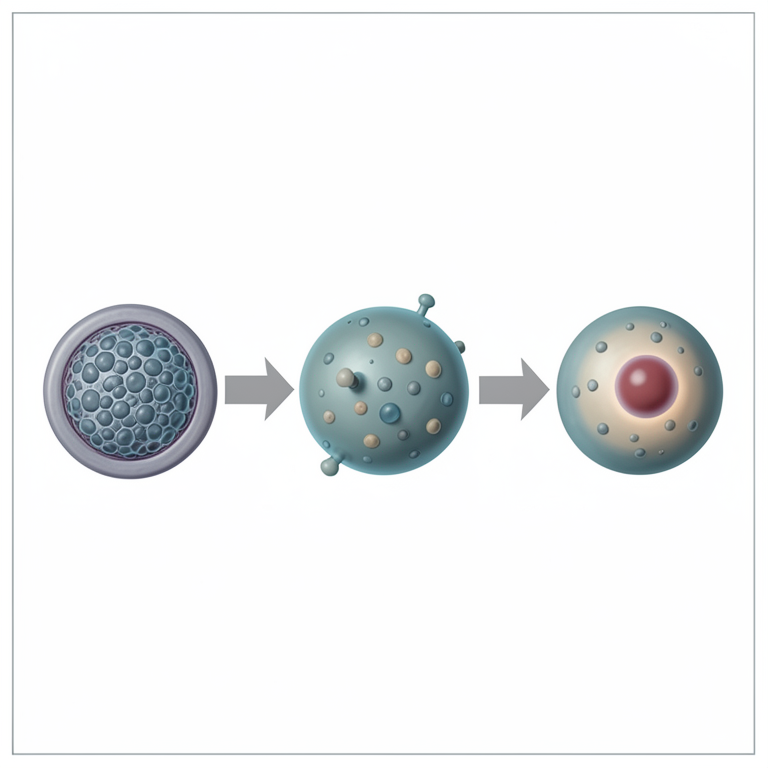
CD8+ T Cell Exhaustion Trajectory
AI-generated conceptual illustration (CD8+ T lymphocytes in a tumor microenvironment). It explains the idea and does not show study data.
View source evidence ↗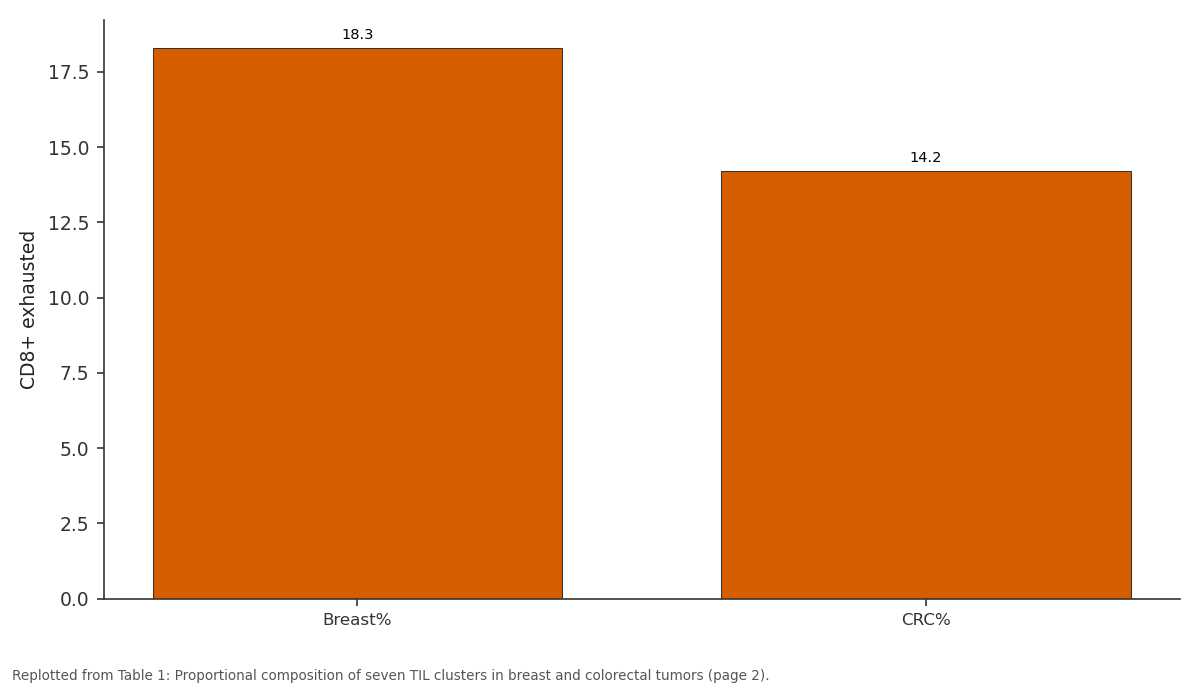
CD8+ exhausted: Breast% vs CRC%
Replotted from Table 1 (page 2) of the original paper. Every bar is the paper's own table value.
View source evidence ↗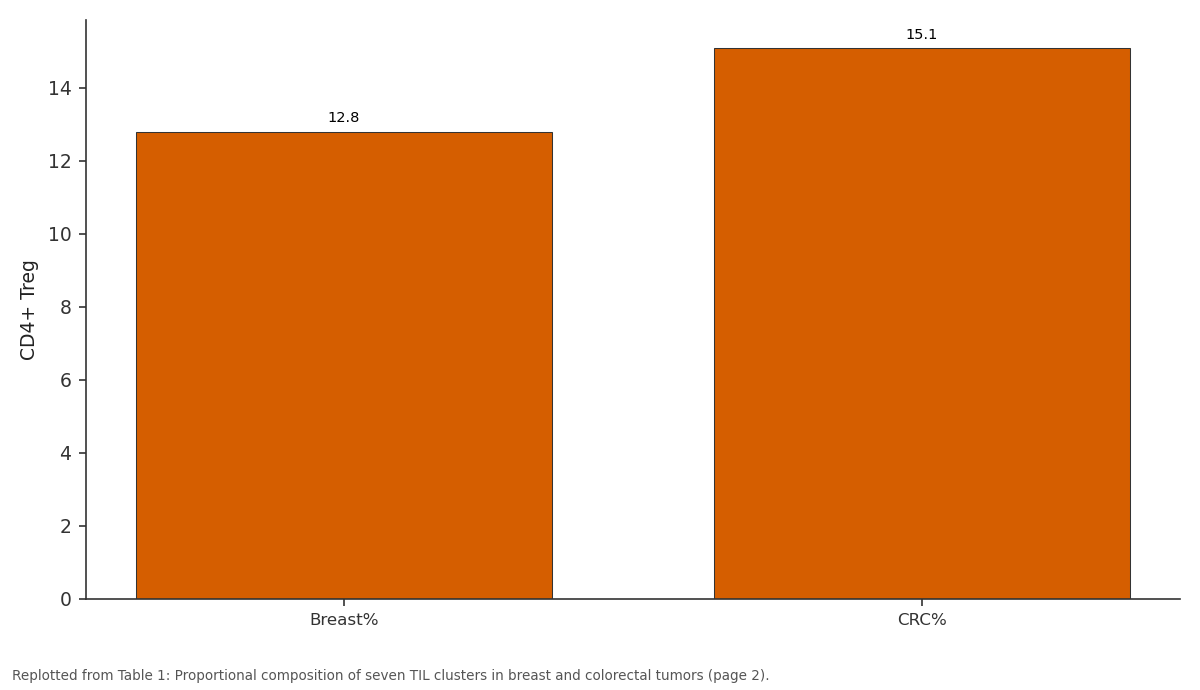
CD4+ Treg: Breast% vs CRC%
Replotted from Table 1 (page 2) of the original paper. Every bar is the paper's own table value.
View source evidence ↗Figures & tables
From the original paper Table 1
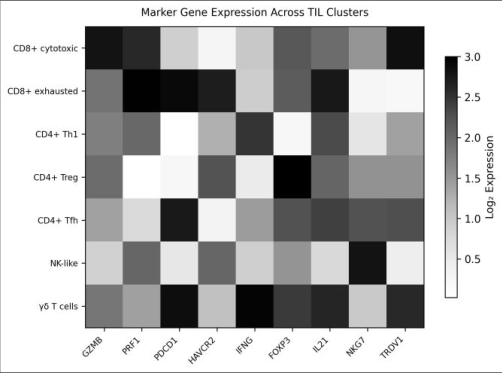 Figure 1
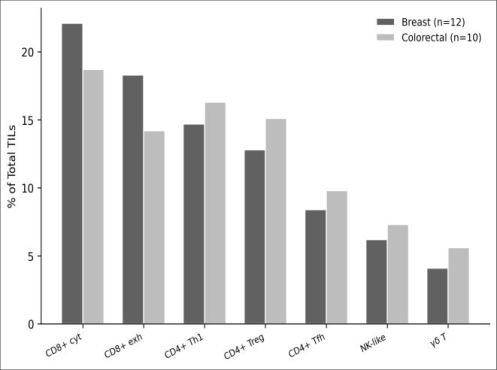 Figure 2
Introduction
A tumor is not just a ball of cancer cells-it's an ecosystem, and the immune cells within that ecosystem can either attack the tumor or be co-opted to support its growth [1] . TILs, especially CD8+ cytotoxic T lymphocytes, are the main effectors of anti-tumor immunity, but their functional state ranges from fully active to terminally exhausted [2] . Checkpoint inhibitors like anti-PD-1 and anti-CTLA-4 work partly by reinvigorating exhausted T cells, yet only 20-40% of patients respond, suggesting that the composition and state of TIL populations matter as much as their mere presence [3] . Single-cell RNA sequencing has transformed our ability to dissect this heterogeneity. Largescale atlases from Western cohorts have catalogued TIL subsets across multiple cancer types, but data from South Asian populations-where genetic backgrounds and environmental exposures differ-remain limited [4,5] . This research used 10x Genomics Chromium scRNAseq to profile TILs from 22 Indian patients with breast or colorectal cancer, aiming to (i) identify functionally distinct lymphocyte clusters, (ii) compare their proportions between cancer types, and (iii) trace differentiation trajectories from cytotoxic to exhausted CD8+ states [6] .
Ethical Considerations
This research was approved by the Institutional Ethics Committee of the Sikkim Institute of Biological Sciences (Protocol SIBS-IEC-2023-007, dated 12 February 2023). Written informed consent was obtained from all patients prior to tumor resection. Patients were informed that participation was voluntary and would not affect their clinical care. All samples were de-identified before processing. Genomic data were stored on encrypted servers with restricted access, and no individual patient sequences were deposited in public repositories without re-consent.
Materials and Methods
Materials and Methods
Materials
Fresh tumor tissue was obtained from 22 treatment-naive patients (12 breast adenocarcinoma, 10 colorectal adenocarcinoma) undergoing surgical resection at partner hospitals in Gangtok, Sikkim, India, between March and November 2023. Samples were transported on ice within 30 minutes to the molecular biology laboratory at the Sikkim Institute of Biological Sciences. Tissue was mechanically dissociated and enzymatically digested with collagenase IV (Worthington, Lakewood, NJ, USA) and DNase I (Sigma-Aldrich) for 45 minutes at 37 °C. CD45+ immune cells were enriched using anti-CD45 magnetic beads (Miltenyi Biotec, Bergisch Gladbach, Germany) to >90% purity.
Methods
Single-cell libraries were prepared using the 10x Genomics Chromium Next GEM Single Cell 3' v3.1 kit targeting 5,000 cells per sample. Libraries were sequenced on an Illumina NovaSeq 6000 (paired-end 150 bp) to a depth of ~50,000 reads per cell. Raw reads were processed through Cell Ranger v7.1 (10x Genomics) aligned to the GRCh38 reference genome. Quality filtering retained cells with 500-5000 detected genes, <15% mitochondrial reads, and >1000 UMI counts. Downstream analysis used Seurat v5.0 in R: SCTransform normalisation, PCA, UMAP dimensionality reduction, and Louvain clustering at resolution 0.6 [7] . Cluster identity was assigned by canonical marker expression. Differential abundance testing between cancer types used the propeller method from the speckle package [8] . Pseudotime trajectory analysis was performed with Monocle 3, rooting the trajectory at the CD8+ cytotoxic cluster [9] .
Limitations
Several constraints should be noted. First, the sample size of 22 tumors limits statistical power for rare cell populations. Second, the CD45+ enrichment step excluded non-immune stromal and tumor cells, preventing integrated analysis of cell-cell communication within the full tumor microenvironment. Third, the enzymatic dissociation may have selectively lost fragile cell types or altered transcriptional profiles through ex-vivo activation. And because all patients were treatment-naive, the findings do not address how TIL composition changes after chemotherapy or immunotherapy. CD8+ cytotoxic and CD8+ exhausted cells together made up 37% of all TILs. Breast tumors had a significantly higher proportion of exhausted CD8+ cells (18.3% vs 14.2%, p = 0.024), while colorectal tumors harboured more Tregs (15.1% vs 12.8%, p = 0.038). Pseudotime analysis traced a continuous trajectory from cytotoxic to exhausted CD8+ states, with progressive upregulation of PDCD1, HAVCR2, and TOX along the trajectory and corresponding downregulation of GZMB and PRF1.
Results
Results
Discussion
The seven-cluster TIL landscape we describe aligns well with atlases from Chinese and European cohorts, suggesting that the broad architecture of tumor immune infiltration is conserved across populations [10,11] . The enrichment of exhausted CD8+ cells in breast tumors may partly explain the variable responses to anti-PD-1 therapy in triplenegative breast cancer-a higher pre-existing exhaustion burden could mean more cells available for reinvigoration,
International Journal of Biology Sciences https://www.biologyjournal.net but also a deeper exhaustion state that resists checkpoint blockade [12] . The elevated Treg proportion in colorectal tumors is consistent with the known role of TGF-beta-driven Treg recruitment in colorectal adenocarcinoma and may underpin resistance to immunotherapy in microsatellitestable disease [13] .
The pseudotime trajectory from cytotoxic to exhausted CD8+ states, marked by progressive TOX upregulation, mirrors findings from melanoma and lung cancer scRNAseq datasets [14] . This transition appears to be a general feature of chronic antigen exposure within the tumor microenvironment rather than a cancer-type-specific phenomenon.
Conclusion
This single-cell transcriptomic survey of 68,417 TILs from 22 Indian cancer patients reveals a seven-cluster immune landscape with cancer-type-specific compositional differences. Breast tumors showed higher CD8+ exhaustion, while colorectal tumors had greater Treg infiltration. The continuous trajectory from cytotoxic to exhausted CD8+ states suggests that therapeutic intervention timing-before terminal exhaustion sets in-may be key to immunotherapy success. Expanding this approach to larger cohorts with matched clinical outcomes data would enable predictive modelling of immunotherapy response based on pretreatment TIL composition.
Acknowledgement
Acknowledgements Funding SourcesSupported by internal research funds from the Sikkim Institute of Biological Sciences, Gangtok, India. Institutional SupportThe authors thank the molecular biology core facility at the Sikkim Institute for 10x Chromium and sequencing support. Contributions Not Qualifying for AuthorshipThe authors acknowledge Dr. Tenzin Dorji for surgical specimen coordination.
Figures and tables from the paper
| Cluster | Overall% | Breast% | CRC% | p-value | Top marker | Cells (n) |
|---|---|---|---|---|---|---|
| CD8+ cytotoxic | 20.6 | 22.1 | 18.7 | 0.132 | GZMB | 14,095 |
| CD8+ exhausted | 16.4 | 18.3 | 14.2 | 0.024 | PDCD1 | 11,220 |
| CD4+ Th1 | 15.4 | 14.7 | 16.3 | 0.287 | IFNG | 10,537 |
| CD4+ Treg | 13.8 | 12.8 | 15.1 | 0.038 | FOXP3 | 9,442 |
| CD4+ Tfh | 9.1 | 8.4 | 9.8 | 0.194 | IL21 | 6,226 |
| NK-like | 6.7 | 6.2 | 7.3 | 0.316 | NKG7 | 4,584 |
| Gamma-delta T | 4.8 | 4.1 | 5.6 | 0.087 | TRDV1 | 3,284 |
Table text extracted from the original PDF; superscript letters are shown inline. The original table image is below.
View original table image
References
14 in the original paper- Hanahan D, Weinberg RA. Hallmarks of cancer: the next generation. Cell. 2011;144(5):646-674.
- Wherry EJ, Kurachi M. Molecular and cellular insights into T cell exhaustion. Nature Reviews Immunology. 2015;15(8):486-499.
- Sharma P, Allison JP. Immune checkpoint targeting in cancer therapy: toward combination strategies with curative potential. Cell. 2015;161(2):205-214.
- Zheng C, Zheng L, Yoo JK, Guo H, Zhang Y, Guo X, et al. Landscape of infiltrating T cells in liver cancer revealed by single-cell sequencing. Cell. 2017;169(7):1342-1356.
- Zhang L, Yu X, Zheng L, Zhang Y, Li Y, Fang Q, et al. Lineage tracking reveals dynamic relationships of T cells in colorectal cancer. Nature. 2018;564(7735):268272.
- Tirosh I, Izar B, Prakadan SM, Wadsworth MH, Treacy D, Trombetta JJ, et al. Dissecting the multicellular ecosystem of metastatic melanoma by single-cell RNAseq. Science. 2016;352(6282):189-196.
- Hao Y, Hao S, Andersen-Nissen E, Mauck WM, Zheng S, Butler A, et al. Integrated analysis of multimodal single-cell data. Cell. 2021;184(13):3573-3587.
- Phipson B, Sim CB, Porrello ER, Hewitt AW, Powell JE, Oshlack A. propeller: testing for differences in cell type proportions in single cell data. Bioinformatics. 2022;38(20):4720-4726.
- Cao J, Spielmann M, Qiu X, Huang X, Ibrahim DM, Hill AJ, et al. The single-cell transcriptional landscape of mammalian organogenesis. Nature. 2019;566(7745):496-502.
- Guo X, Zhang Y, Zheng L, Zheng C, Song J, Zhang Q, et al. Global characterization of T cells in non-smallcell lung cancer by single-cell sequencing. Nature Medicine. 2018;24(7):978-985.
- Azizi E, Carr AJ, Plitas G, Cornish AE, Konopacki C, Prabhakaran S, et al. Single-cell map of diverse immune phenotypes in the breast tumor microenvironment. Cell. 2018;174(5):1293-1308.
- Adams S, Loi S, Toppmeyer D, Cescon DW, De Laurentiis M, Nanda R, et al. Pembrolizumab monotherapy for previously untreated, PD-L1-positive, metastatic triple-negative breast cancer. Journal of Clinical Oncology. 2020;38(16):1767-1776.
- Tauriello DV, Palomo-Ponce S, Stork D, BerenguerLlergo A, Badia-Ramentol J, Iglesias M, et al. TGFbeta drives immune evasion in genetically reconstituted colon cancer metastasis. Nature. 2018;554(7693):538543.
- Miller BC, Sen DR, Al A> R, Bi K, Vber$ YV, El-R;j BH, et al. Subsets of exhausted CD8+ T cells differentially mediate tumor control and respond to checkpoint blockade. Nature Immunology. 2019;20(3):326-336.