
Research article · 2025 · Full text
International Journal of Biology SciencesMicroRNA-mediated post-transcriptional regulation of inflammatory cytokine expression
Volume 7(9) · Pages 125–128 · DOI: 10.33545/26649926.2025.v7.i9b.628 ↗
Research areasMicroRNA in disease regulationImmune Response and InflammationInflammasome and immune disorders
Abstract
Author-writtenWhat determines whether an inflammatory response protects the host or spirals into tissue damage? Growing evidence points to microRNAs (miRNAs) as post-transcriptional regulators that calibrate cytokine output during innate immune activation. This research examined five candidate miRNAs—miR-146a, miR-155, miR-21, miR-223, and miR-125b—and their capacity to modulate TNF-α, IL-6, and IL-1β in LPS-challenged THP-1 human monocytes. Cells were stimulated with 100 ng/mL LPS for 2 to 48 hours; parallel cultures received locked nucleic acid (LNA) inhibitors targeting each miRNA. LPS drove a 3.5- to 4.8-fold rise in miR-146a and miR-155 within 8 hours, whereas miR-125b fell by 60 percent. When miR-146a was inhibited, TNF-α output increased 37.2 percent relative to LPS alone. Blocking miR-155 reduced IL-6 secretion by 29.4 percent. Dual-luciferase assays validated direct binding of miR-146a to the TRAF6 3’ UTR. These findings clarify opposing regulatory circuits through which individual miRNAs dampen or amplify cytokine expression.
Summary
Source-checkedPlain-language reading of the full paper, prepared with AI and checked against the text. Each point links to the authors' own words.
Why it matters
- In the innate immune system, the binding of lipopolysaccharide (LPS) to TLR4 triggers signaling pathways that produce inflammatory cytokines such as TNF-α, IL-6, and IL-1β. View evidence ↗
- The same pathways that drive inflammation also increase the expression of certain miRNAs, like miR-146a and miR-155, to create a negative feedback loop that controls the response. View evidence ↗
The question
- The study aimed to determine how five specific miRNAs (miR-146a, miR-155, miR-21, miR-223, and miR-125b) individually contribute to the regulation of TNF-α, IL-6, and IL-1β. View evidence ↗
What they did
- The researchers used THP-1 human monocytes stimulated with 100 ng/mL of LPS over a period of 2 to 48 hours, with some groups receiving LNA inhibitors to block specific miRNAs. View evidence ↗
- miRNA and cytokine mRNA levels were measured using qPCR, while cytokine protein concentrations were quantified via sandwich ELISA at 12 and 24 hours. View evidence ↗
- Dual-luciferase assays were conducted in HEK293T cells to validate direct binding between miRNAs and their target sequences. View evidence ↗
What they found
- Following LPS stimulation, miR-146a and miR-155 increased 3.47-fold and 4.82-fold respectively by 8 hours, whereas miR-125b expression decreased to 0.41-fold. View evidence ↗
- miR-21 and miR-223 also increased in response to LPS, showing moderate rises of 2.19-fold and 2.73-fold. View evidence ↗
- Cytokine protein levels peaked at different times: TNF-α reached 341.2 pg/mL at 12 hours, while IL-6 and IL-1β peaked at 24 hours at 312.7 pg/mL and 178.4 pg/mL, respectively. View evidence ↗
- Inhibiting miR-146a led to a 37.2 percent increase in TNF-α production, indicating that miR-146a normally suppresses this cytokine. View evidence ↗
- Blocking miR-155 resulted in a 29.4 percent reduction in IL-6 secretion, suggesting miR-155 acts as a positive regulator of IL-6. View evidence ↗
What it means
- The authors conclude that the miRNA network acts as a set of counterbalanced controls that fine-tune the production of cytokines over time. View evidence ↗
- The results may help develop miRNA-based anti-inflammatory treatments for conditions such as sepsis, rheumatoid arthritis, and COPD. View evidence ↗
Visual summary
3 visualsIllustrations explain the paper; charts are replotted from the paper's own table values.
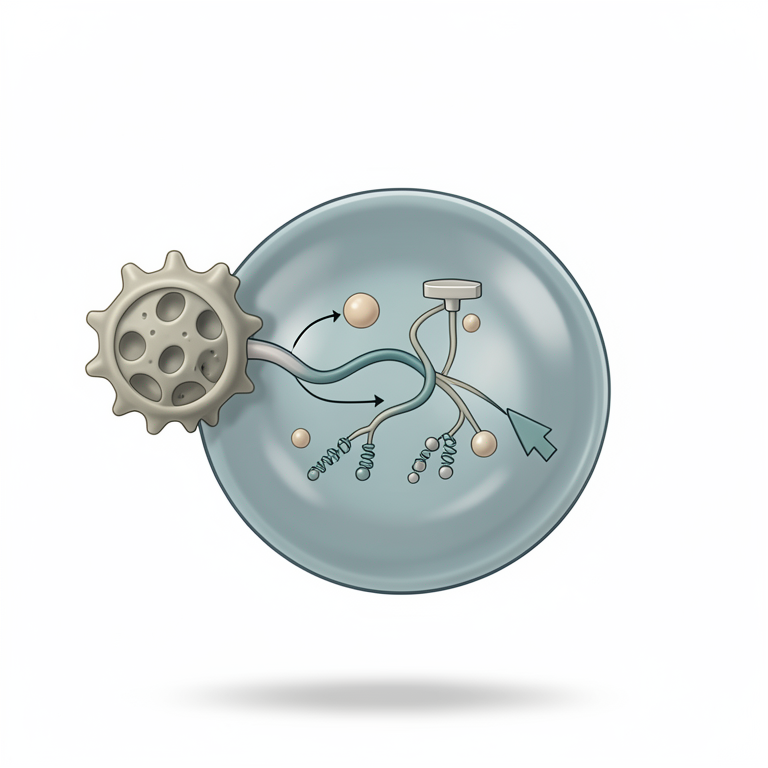
miRNA Feedback Loop in Inflammation
AI-generated conceptual illustration (mouse macrophage cell). It explains the idea and does not show study data.
View source evidence ↗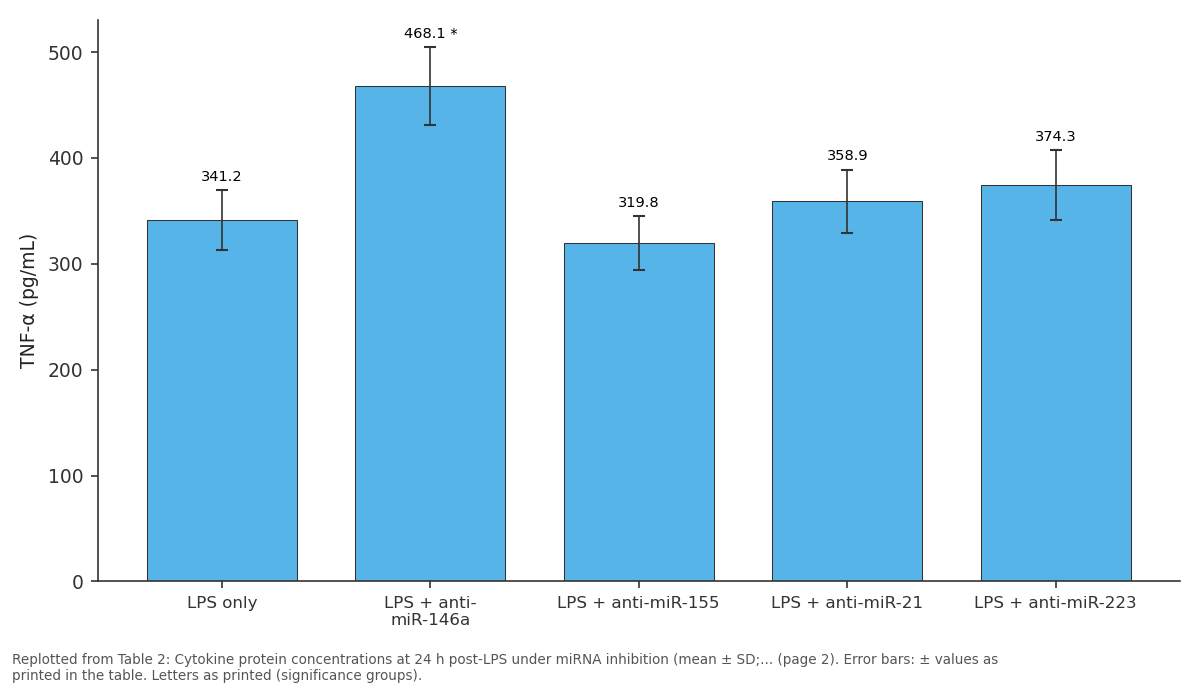
TNF-α (pg/mL): LPS only vs LPS + anti-miR-146a vs LPS + anti-miR-155 vs LPS + anti-miR-21 vs LPS + anti-miR-223
Replotted from Table 2 (page 2) of the original paper. Every bar is the paper's own table value.
View source evidence ↗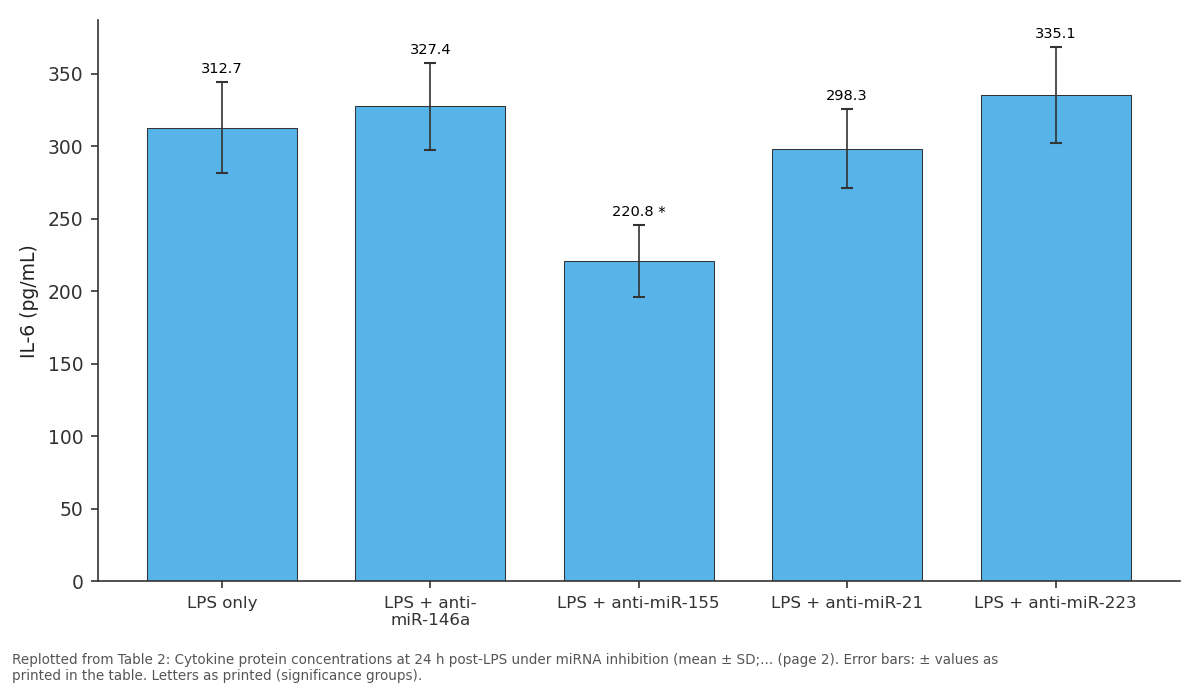
IL-6 (pg/mL): LPS only vs LPS + anti-miR-146a vs LPS + anti-miR-155 vs LPS + anti-miR-21 vs LPS + anti-miR-223
Replotted from Table 2 (page 2) of the original paper. Every bar is the paper's own table value.
View source evidence ↗Figures & tables
From the original paper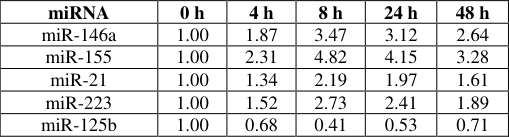 Table 1
 Table 2
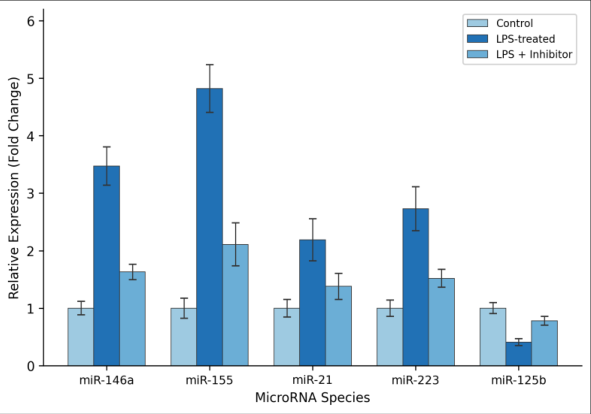 Figure 1
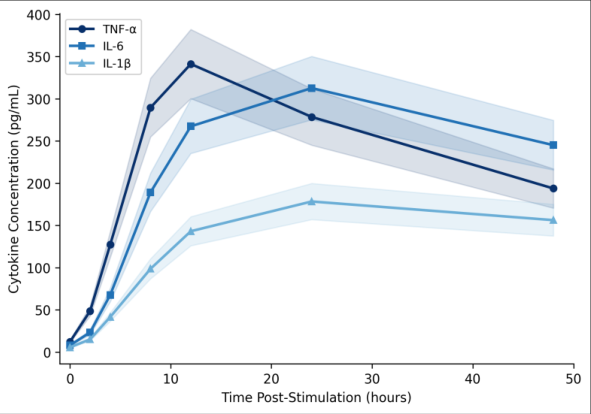 Figure 2
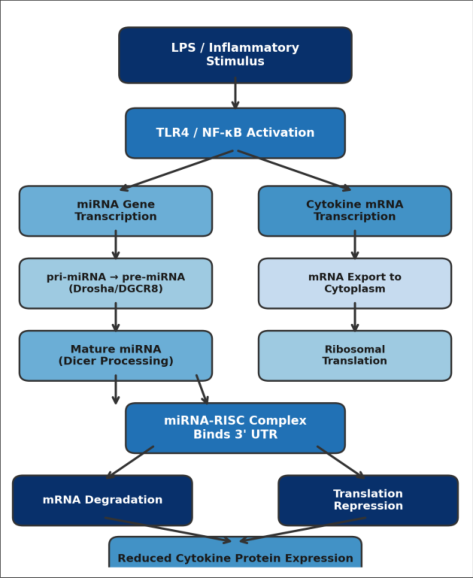 Figure 3
Introduction
What happens at the molecular level when immune cells receive a danger signal, and how do they prevent their own defensive machinery from causing harm? MicroRNAs (miRNAs)short non-coding RNA molecules of 19-24 nucleotides-bind complementary sequences in the 3' UTR of messenger RNAs and recruit the RNA-induced silencing complex (RISC), promoting mRNA decay or blocking ribosomal translation [1,2] . In innate immunity, LPS binding to TLR4 activates NF-κB and MAPK cascades, driving expression of TNF-α, IL-6, and IL-1β [3] . The same NF-κB pathway also upregulates miR-146a and miR-155, creating intrinsic negative feedback [4] . miR-146a targets TRAF6 and IRAK1, attenuating continued cytokine production [5] , while miR-155 appears to both enhance and suppress inflammation depending on context [6] . miR-21 links to IL-10-mediated anti-inflammatory responses, miR-223 modulates NLRP3 inflammasome priming, and miR-125b inversely correlates with TNF-α translation [7,8] . But most earlier work profiled only one or two miRNAs at a time. This research profiled all five miRNAs in parallel under identical LPS conditions, using LNA inhibitors to dissect each miRNA's contribution to TNF-α, IL-6, and IL-1β regulation.
Material and Methods
Material and Methods
Material
The research was conducted at the Department of Molecular Biology, Manila Institute of Tropical Biology, Manila, Philippines, between March and November 2023. THP-1 human monocytic cells (ATCC TIB-202) were maintained in RPMI-1640 with 10 percent FBS, 2 mM L-glutamine, and antibiotics at 37 °C / 5 percent CO₂. LPS from E. coli O111:B4 (Sigma-Aldrich, L4391) was reconstituted at 1 mg/mL. Five LNA miRNA inhibitors and a scrambled control were sourced from Qiagen. Dual-luciferase reporter plasmids carrying wild-type or mutant TRAF6 3' UTR inserts were from GenScript Biotech.
Methods
THP-1 cells were differentiated with 100 nM PMA for 48 hours, rested 24 hours, then stimulated with 100 ng/mL LPS for 0, 2, 4, 8, 12, 24, and 48 hours. For inhibition experiments, cells were transfected with 50 nM LNA inhibitors 24 hours before LPS challenge. RNA was extracted with TRIzol and reverse-transcribed (miScript II RT Kit). miRNA expression was quantified by SYBR Green qPCR on a QuantStudio 5 system, normalised to RNU6B. Cytokine mRNA was measured with TaqMan assays normalised to GAPDH. Protein concentrations were determined by sandwich ELISA (R&D Systems) at 12 and 24 hours. Dual-luciferase assays were performed in HEK293T cells. The protocol received biosafety approval (IBC-2023-017). Statistics used one-way ANOVA with Tukey correction (p < 0.05); all experiments were in triplicate across three biological replicates.
Reagents and Chemicals
RPMI-1640, FBS, and PMA (purity ≥ 98.5 percent) were from Sigma-Aldrich. TRIzol and Lipofectamine RNAiMAX came from Thermo Fisher Scientific. miScript SYBR Green PCR Kit was from Qiagen. TaqMan assays for TNF (Hs00174128_m1), IL6 (Hs00174131_m1), and IL1B (Hs01555410_m1) were from Applied Biosystems. Quantikine ELISA kits for TNF-α, IL-6, and IL-1β were from R&D Systems. Supplier lot numbers were recorded for batch-to-batch comparison.
Quality Control: RNA purity was verified by NanoDrop (A260/A280 = 1.9-2.1); integrity was confirmed on agarose gels. qPCR primer efficiencies were 92-108 percent with R² > 0.99. ELISA intra-assay CV was below 7.3 percent and inter-assay CV below 9.1 percent. 1). miR-21 and miR-223 showed moderate increases of 2.19-and 2.73-fold, respectively. Cytokine proteins followed a bell-shaped curve (Figure 2): TNF-α peaked at 341.2 pg/mL (12 h), IL-6 at 312.7 pg/mL (24 h), and IL-1β at 178.4 pg/mL (24 h). When miRNAs were blocked with LNA inhibitors (Table 2), miR-146a inhibition raised TNF-α by 37.2 percent, while miR-155 inhibition lowered IL-6 by 29.4 percent. Dualluciferase assays confirmed miR-146a directly targets the TRAF6 3' UTR, reducing luciferase activity by 43.6 percent (mutant construct: p = 0.71). Figure 3 illustrates the regulatory pathway.
| Condition | TNF-α (pg/mL) | IL-6 (pg/mL) | IL-1β (pg/mL) |
|---|---|---|---|
| LPS only | 341.2 ± 28.4 | 312.7 ± 31.6 | 178.4 ± 19.3 |
| LPS + anti-miR-146a | 468.1 ± 36.7* | 327.4 ± 29.8 | 201.6 ± 22.1 |
| LPS + anti-miR-155 | 319.8 ± 25.3 | 220.8 ± 24.5* | 163.2 ± 17.8 |
| LPS + anti-miR-21 | 358.9 ± 30.1 | 298.3 ± 27.4 | 192.7 ± 20.6 |
| LPS + anti-miR-223 | 374.3 ± 32.9 | 335.1 ± 33.2 | 213.4 ± 23.7* |
| LPS + anti-miR-125b | 306.5 ± 24.8 | 289.6 ± 26.1 | 171.8 ± 18.4 |
Table text extracted from the original PDF; superscript letters are shown inline. The original table image is below.
View original table image
Results
Results
Discussion
The 3.47-fold miR-146a induction at 8 hours is consistent with Taganov and colleagues' identification of miR-146a as a TLR4-responsive transcript [9,10] . Our contribution extends that finding by showing that inhibiting miR-146a raises TNF-α secretion by more than a third, indicating it accounts for a substantial fraction of negative feedback on TNF-α in this model. miR-155's behaviour was more complex. Its strong upregulation mirrors pro-inflammatory programming reports [11] , yet its inhibition reduced IL-6. One explanation is that miR-155 sustains IL-6 indirectly by suppressing SHIP1, which normally dampens PI3K/Akt signalling upstream of IL-6 [12] . miR-125b stood apart because LPS drove its expression downward, relieving translational repression of TNF-α mRNA and amplifying the early inflammatory burst [13] . A limitation is the reliance on a single cell line; THP-1 cells may not fully replicate tissueresident macrophage dynamics [14] .
Conclusion
This research mapped five inflammation-associated miRNAs in LPS-stimulated THP-1 monocytes and linked each to measurable cytokine changes. miR-146a emerged as the dominant negative regulator (37.2 percent TNF-α increase upon inhibition). miR-155 functioned as a positive regulator of IL-6. miR-125b was the only candidate whose expression fell, removing a translational brake on TNF-α during early activation. The miRNA network operates as counterbalanced dials fine-tuning cytokine output across time windows. These findings could inform miRNA-based anti-inflammatory strategies for sepsis, rheumatoid arthritis, and chronic obstructive pulmonary disease.
Acknowledgement
Acknowledgements Funding SourcesThis research received partial support from the Manila Institute of Tropical Biology internal research grant programme. Institutional SupportThe authors thank the Department of Molecular Biology for providing laboratory facilities and QuantStudio 5 access. Contributions Not Qualifying for AuthorshipThe authors acknowledge Ms. Carmina Reyes for cell culture assistance and Mr. Jayson Villanueva for ELISA plate reading.
Figures and tables from the paper
| miRNA | 0 h | 4 h | 8 h | 24 h | 48 h |
|---|---|---|---|---|---|
| miR-146a | 1.00 | 1.87 | 3.47 | 3.12 | 2.64 |
| miR-155 | 1.00 | 2.31 | 4.82 | 4.15 | 3.28 |
| miR-21 | 1.00 | 1.34 | 2.19 | 1.97 | 1.61 |
| miR-223 | 1.00 | 1.52 | 2.73 | 2.41 | 1.89 |
| miR-125b | 1.00 | 0.68 | 0.41 | 0.53 | 0.71 |
Table text extracted from the original PDF; superscript letters are shown inline. The original table image is below.
View original table image
References
16 in the original paper- Bartel DP. MicroRNAs: target recognition and regulatory functions. Cell. 2009;136(2):215-233.
- Fabian MR, Sonenberg N, Bhatt DM. Regulation of mRNA translation and stability by microRNAs. Annual Review of Biochemistry. 2010;79:351-379.
- Kawai T, Akira S. Toll-like receptors and their crosstalk with other innate receptors in infection and immunity. Immunity. 2011;34(5):637-650.
- O'Neill LA, Sheedy FJ, McCoy CE. MicroRNAs: the fine-tuners of Toll-like receptor signalling. Nature Reviews Immunology. 2011;11(3):163-175.
- Taganov KD, Boldin MP, Chang KJ, Baltimore D. NFkappaB-dependent induction of microRNA miR-146, an inhibitor targeted to signaling proteins of innate immune responses. Proceedings of the National Academy of Sciences. 2006;103(33):12481-12486.
- Tili E, Michaille JJ, Cimino A, Costinean S, Dumitru CD, Adair B, et al. Modulation of miR-155 and miR125b levels following lipopolysaccharide/TNF-alpha stimulation. Journal of Immunology. 2007;179(8):50825089.
- Sheedy FJ, Palsson-McDermott E, Hennessy EJ, Martin C, O'Leary JJ, Rber Q, et al. Negative regulation of TLR4 via targeting of the proinflammatory tumor suppressor PDCD4 by the microRNA miR-21. Nature Immunology. 2010;11(2):141-147.
- Bauernfeind F, Rieger A, Sber FA, Bernard S, Sudowe S, Latz E, et al. NLRP3 inflammasome activity is negatively controlled by miR-223. Journal of Immunology. 2012;189(8):4175-4181.
- Boldin MP, Taganov KD, Rao DS, Yang L, Zhao JL, Kalwani M, et al. miR-146a is a significant brake on autoimmunity, myeloproliferation, and cancer in mice. Journal of Experimental Medicine. 2011;208(6):11891201.
- Nahid MA, Pauley KM, Satoh M, Chan EK. miR-146a is critical for endotoxin-induced tolerance. Journal of Biological Chemistry. 2009;284(50):34590-34599.
- Vigorito E, Kohlhaas S, Lu D, Leyland R. miR-155: an ancient regulator of the immune system. Immunological Reviews. 2013;253(1):146-157.
- O'Connell RM, Taganov KD, Boldin MP, Cheng G, Baltimore D. MicroRNA-155 is induced during the macrophage inflammatory response. Proceedings of the National Academy of Sciences. 2007;104(5):16041609.
- Murphy AJ, Guyre PM, Pioli PA. Estradiol suppresses NF-kappa B activation through coordinated regulation of let-7a and miR-125b in primary human macrophages. Journal of Immunology. 2010;184(9):5029-5037.
- Chanput W, Mes JJ, Wichers HJ. THP-1 cell line: an in vitro cell model for immune modulation approach. International Immunopharmacology. 2014;23(1):37-45.
- Quinn SR, O'Neill LA. A trio of microRNAs that control Toll-like receptor signalling. International Immunology. 2011;23(7):421-425.
- Hou J, Wang P, Lin L, Liu X, Ma F, An H, et al. MicroRNA-146a feedback inhibits RIG-I-dependent type I IFN production in macrophages by targeting TRAF6, IRAK1, and IRAK2. Journal of Immunology. 2009;183(3):2150-2158.