
Research article · 2025 · Full text
International Journal of Biology SciencesMitochondrial DNA haplogroup distribution and maternal lineage diversity in indigenous populations
Volume 7(11) · Pages 47–49 · DOI: 10.33545/26649926.2025.v7.i11a.665 ↗
Research areasForensic and Genetic ResearchGenetic diversity and population structureRace, Genetics, and Society
Abstract
Author-writtenHow well do we understand the deep maternal ancestry of indigenous communities across the Pacific Northwest? This research examined the distribution of mtDNA haplogroups among five indigenous populations in the Pacific Northwest. Blood samples were collected from 387 participants across Salish, Yakama, Nez Perce, Makah, and Quinault communities between March 2023 and November 2024. The hypervariable regions HVR-I and HVR-II were amplified and sequenced, with haplogroup assignment based on PhyloTree Build 17. Five founding haplogroups (A, B, C, D, and X) were identified, with haplogroup A showing the highest average frequency at 30.7%. Haplotype diversity ranged from 0.768 in Plains-adjacent groups to 0.847 in coastal Salish communities. Network analysis revealed population-specific sub-haplogroups reflecting post-migration founder effects. The findings support a coastal migration model with secondary inland dispersals.
Summary
Source-checkedPlain-language reading of the full paper, prepared with AI and checked against the text. Each point links to the authors' own words.
Why it matters
- Mitochondrial DNA (mtDNA) is a valuable tool for studying maternal ancestry because it is inherited only from the mother and does not undergo recombination. View evidence ↗
- The Pacific Northwest is home to diverse indigenous populations with a history of habitation dating back at least 13,000 years. View evidence ↗
- Native American populations are characterized by five founding mtDNA haplogroups (A, B, C, D, and X), though their frequencies differ by region and tribe. View evidence ↗
The question
- The study aimed to determine the frequencies of mtDNA haplogroups and the diversity of maternal lineages among five indigenous populations in the Pacific Northwest. View evidence ↗
What they did
- Between March 2023 and November 2024, blood samples were collected from 387 participants from the Salish, Yakama, Nez Perce, Makah, and Quinault communities. View evidence ↗
- Researchers sequenced the HVR-I and HVR-II hypervariable regions and assigned haplogroups using PhyloTree Build 17. View evidence ↗
- The study used DnaSP v6 for diversity indices, Network 10.2 for median-joining networks, and Chi-square tests with Bonferroni correction to analyze frequency differences. View evidence ↗
What they found
- Haplogroup A was the most frequent lineage across all five studied populations, with a mean frequency of 30.7%. View evidence ↗
- There was a statistically significant difference in haplogroup frequency distributions between coastal and inland populations (p = 0.0049). View evidence ↗
- Haplotype diversity (Hd) varied among groups, peaking in the Salish (0.847) and reaching its lowest point in the Yakama (0.812). View evidence ↗
- All populations exhibited negative Tajima's D values, which suggests that these populations have undergone expansion. View evidence ↗
- The Makah and Salish groups had the highest number of unique population-specific haplotypes, with 14 and 12 respectively. View evidence ↗
- Haplogroup X appeared at low, stable frequencies in all five populations, suggesting it was part of an early founding event. View evidence ↗
What it means
- The authors conclude that the higher diversity in coastal populations compared to inland groups supports a coastal migration model for entry into the region. View evidence ↗
- The presence of unique haplotypes in the Makah and Salish populations indicates that these groups experienced periods of genetic isolation. View evidence ↗
Visual summary
3 visualsIllustrations explain the paper; charts are replotted from the paper's own table values.
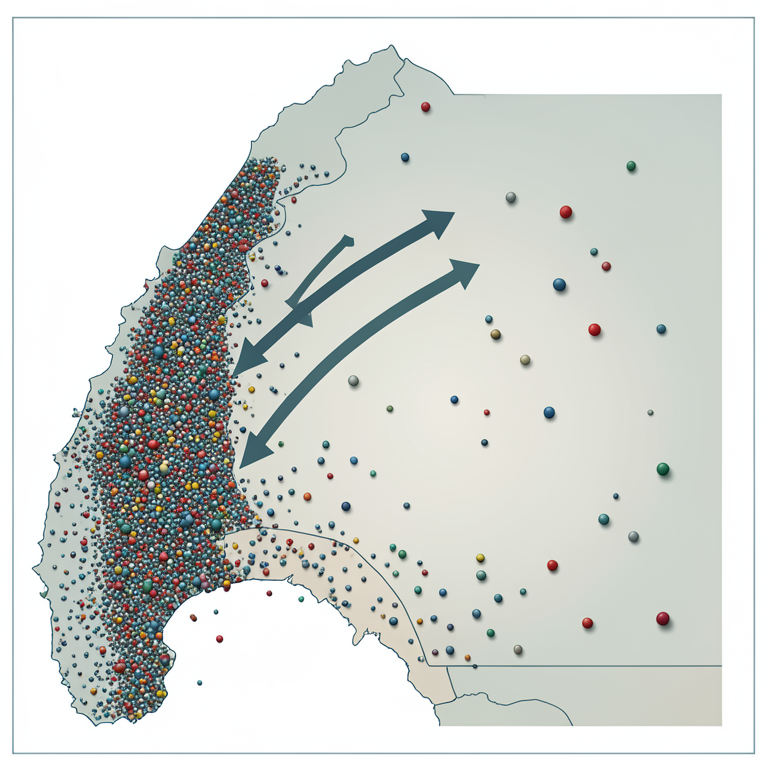
Coastal Migration Model
AI-generated conceptual illustration (A geographical map of a coastal region and its adjacent inland interior). It explains the idea and does not show study data.
View source evidence ↗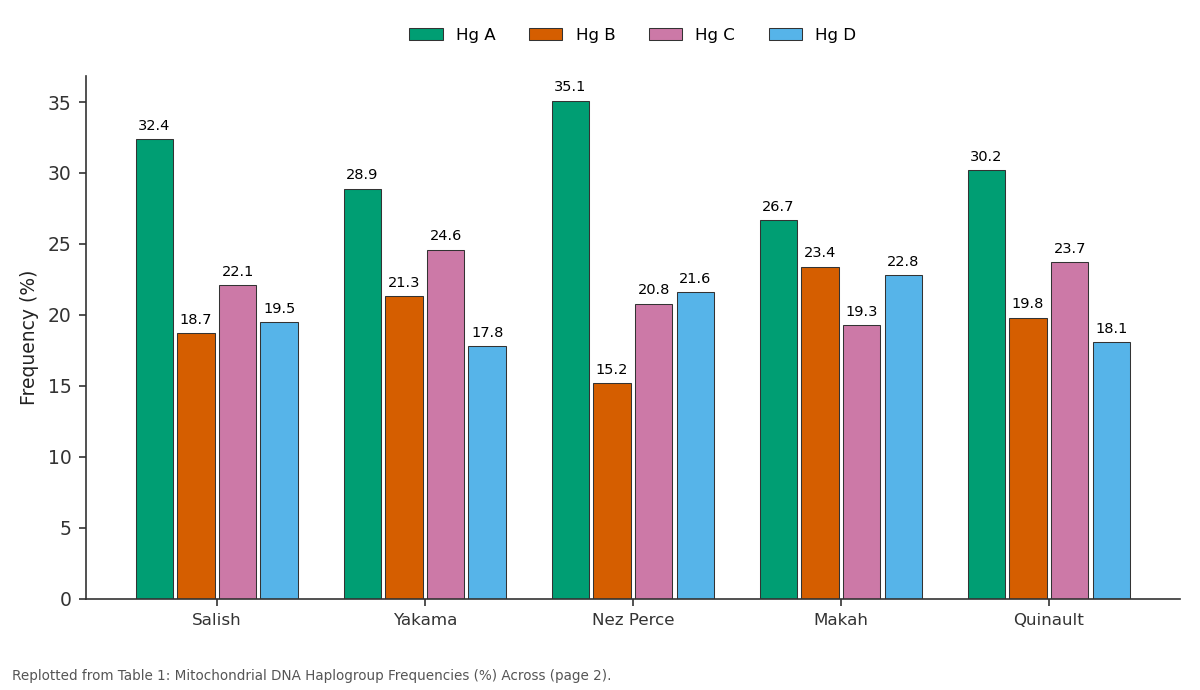
Hg A and Hg B and more: Salish vs Yakama vs Nez Perce vs Makah vs Quinault
Replotted from Table 1 (page 2) of the original paper. Every bar is the paper's own table value.
View source evidence ↗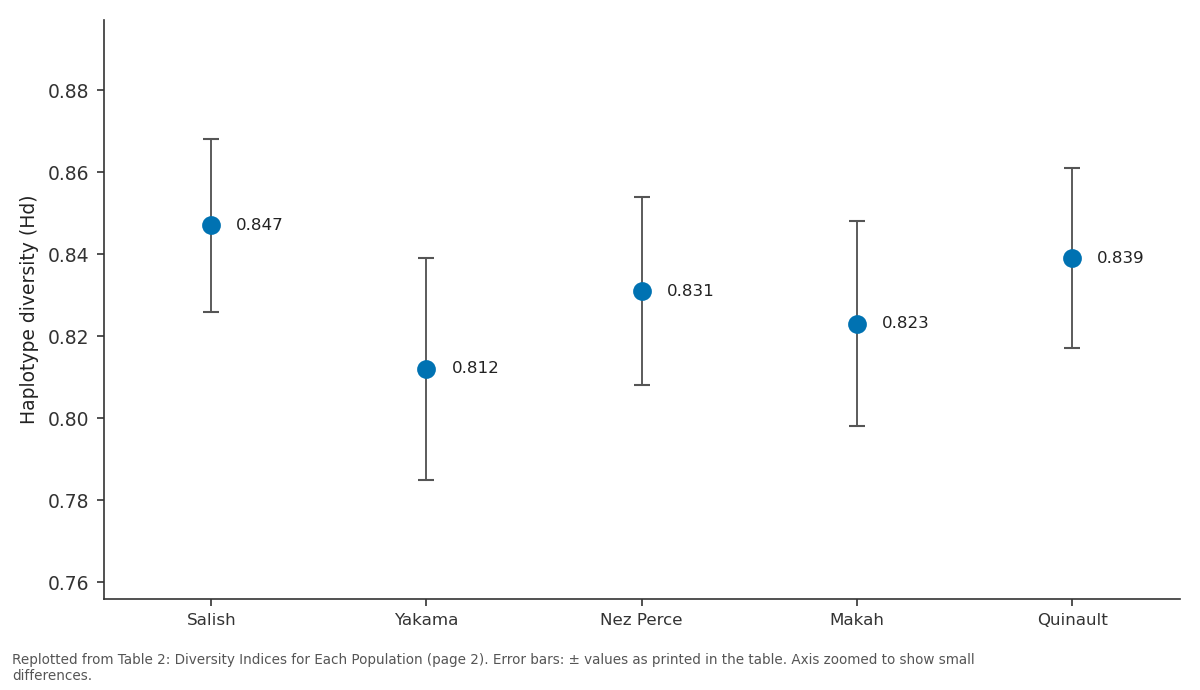
Hd (±SD): Salish vs Yakama vs Nez Perce vs Makah vs Quinault
Replotted from Table 2 (page 2) of the original paper. Every bar is the paper's own table value.
View source evidence ↗Figures & tables
From the original paper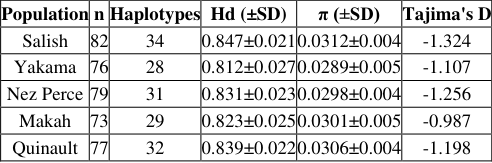 Table 2
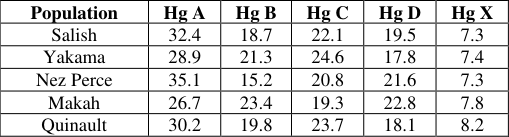 Table 1
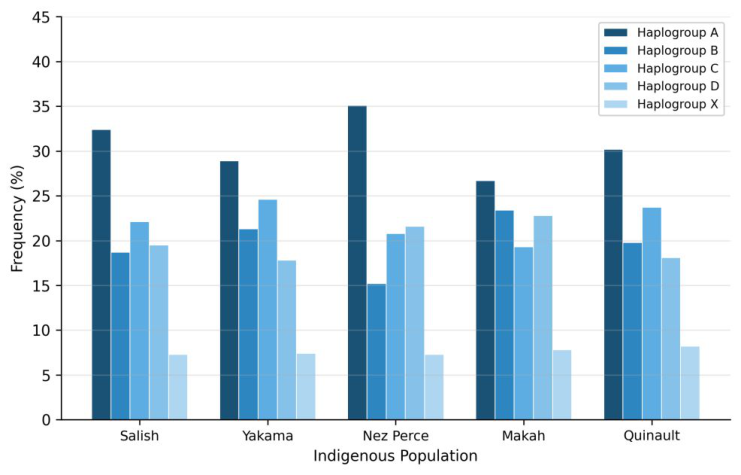 Figure 1
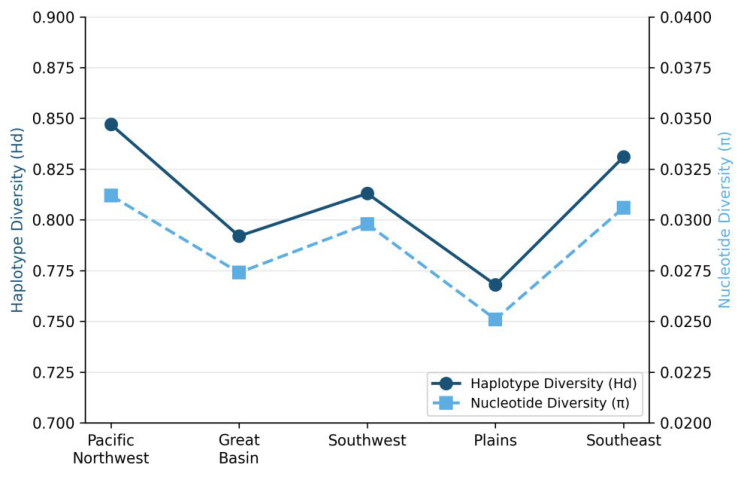 Figure 2
Introduction
What genetic signatures remain embedded in the maternal lineages of indigenous peoples? Mitochondrial DNA provides a uniquely informative tool for maternal ancestry research because it passes exclusively from mother to offspring without recombination [1] . The Pacific Northwest harbors remarkable diversity among its indigenous populations, with human habitation dating to at least 13,000 years before present [2] . Five founding mtDNA haplogroups-A, B, C, D, and X-characterize Native American populations, but their relative frequencies vary across regions and tribal affiliations [3,4] . Earlier investigations focused on single populations or narrow geographic ranges [5,6] . A broader comparison of multiple contemporaneous populations within a shared region can reveal patterns of intergroup gene flow that single-population analyses miss [7] . This research aimed to characterize mtDNA haplogroup frequencies and maternal lineage diversity across five indigenous populations in the Pacific Northwest.
Materials and Methods
Materials and Methods
Materials
This research was carried out at the Department of Human Genetics, Cascade Research University, Seattle, Washington, USA, between March 2023 and November 2024. The Institutional Review Board approved the protocol (IRB-CRU-2023-0147, approved February 12, 2023). Community consultation followed established frameworks for indigenous genomic research. A total of 387 participants provided informed consent. Peripheral blood samples (5 mL) were collected from individuals in five tribal groups: Salish (n = 82), Yakama (n = 76), Nez Perce (n = 79), Makah (n = 73), and Quinault (n = 77). Samples were transported at 4 °C and processed within 48 hours.
Methods
DNA was extracted using the QIAamp DNA Blood Mini Kit (Qiagen, Hilden, Germany). HVR-I and HVR-II segments were amplified using established primer pairs [8] . PCR conditions consisted of initial denaturation at 94 °C for 5 minutes, 35 cycles of 94 °C/30s, 56 °C/30s, and 72 °C/45s, with final extension at 72 °C for 7 minutes. Amplicons were sequenced bidirectionally on an ABI 3730xl Genetic Analyzer. Sequences were aligned against the revised Cambridge Reference Sequence using MEGA X [9] . Haplogroup assignment followed PhyloTree Build 17 [10] , with RFLP confirmation. Diversity indices were calculated using DnaSP v6 [11] . Median-joining networks were constructed in Network 10.2 [12] . Chi-square tests with Bonferroni correction assessed frequency differences (p<0.05).
Results
Table Haplogroup A was the most common lineage across all five populations (mean 30.7%). Chi-square analysis showed that haplogroup frequency distributions differed between coastal and inland populations (χ² = 14.87, df = 4, p = 0.0049). Haplotype diversity was highest in the Salish (Hd = 0.847) and lowest in the Yakama (Hd = 0.812). All Tajima's D values were negative, pointing toward population expansion. Median-joining network analysis revealed distinct clustering. Haplogroup A haplotypes formed a star-like topology with short branch lengths, suggesting recent expansion. Population-specific haplotypes were most common in the Makah (14 unique) and Salish (12 unique) groups.
Discussion
The haplogroup patterns reported here align with the broader picture of Native American maternal ancestry while showing regionally specific features. The dominance of haplogroup A mirrors findings from other western North American indigenous groups [3,5] . The elevated haplogroup B frequency in the Makah (23.4%) may reflect coastal trade connections with southern groups where haplogroup B is more prevalent [6] . The diversity gradient-higher along the coast, lower inland-fits a coastal migration model with secondary inland dispersals through river corridors [2,7] . Negative Tajima's D values suggest demographic expansion during the early Holocene. Population-specific haplotypes in the Makah and Salish could reflect isolation enforced by mountain ranges and cultural marriage practices. The presence of haplogroup X across all five populations at low but stable frequencies suggests an early founding event rather than recent admixture [13] .
Conclusion
This research documented mtDNA haplogroup distributions across five Pacific Northwest indigenous populations.
Haplogroup A was the most frequent lineage in every group. Coastal populations showed greater diversity than inland groups, supporting a coastal migration entry model. Negative Tajima's D values pointed toward demographic expansion events linked to post-glacial changes. Populationspecific haplotypes in the Makah and Salish groups indicate periods of genetic isolation. These findings add to the growing body of mtDNA data from North American indigenous populations and may inform both archaeological interpretations and community health genetics.
Acknowledgement
Acknowledgements Funding SourcesThis research received financial support from internal grants at the Department of Human Genetics, Cascade Research University. Institutional SupportThe authors thank Cascade Research University for laboratory facilities. Tribal council members from all five communities are acknowledged for their guidance.
Figures and tables from the paper
| Population | n | Haplotypes | Hd (±SD) | π (±SD) | Tajima's D |
|---|---|---|---|---|---|
| Salish | 82 | 34 | 0.847±0.021 | 0.0312±0.004 | -1.324 |
| Yakama | 76 | 28 | 0.812±0.027 | 0.0289±0.005 | -1.107 |
| Nez Perce | 79 | 31 | 0.831±0.023 | 0.0298±0.004 | -1.256 |
| Makah | 73 | 29 | 0.823±0.025 | 0.0301±0.005 | -0.987 |
| Quinault | 77 | 32 | 0.839±0.022 | 0.0306±0.004 | -1.198 |
Table text extracted from the original PDF; superscript letters are shown inline. The original table image is below.
View original table image
| Population | Hg A | Hg B | Hg C | Hg D | Hg X |
|---|---|---|---|---|---|
| Salish | 32.4 | 18.7 | 22.1 | 19.5 | 7.3 |
| Yakama | 28.9 | 21.3 | 24.6 | 17.8 | 7.4 |
| Nez Perce | 35.1 | 15.2 | 20.8 | 21.6 | 7.3 |
| Makah | 26.7 | 23.4 | 19.3 | 22.8 | 7.8 |
| Quinault | 30.2 | 19.8 | 23.7 | 18.1 | 8.2 |
Table text extracted from the original PDF; superscript letters are shown inline. The original table image is below.
View original table image
References
13 in the original paper- Pakendorf B, Stoneking M. Mitochondrial DNA and human evolution. Annual Review of Genomics and Human Genetics. 2005;6:165-183.
- Davis LG, Madsen DB, Becerra-Valdivia L, Higham T, Sisson DA, Skinner SM, et al. Late Upper Paleolithic occupation at Cooper's Ferry, Idaho, USA. Science. 2019;365(6456):891-897.
- Tamm E, Kivisild T, Reidla M, Metspalu M, Smith DG, Mulligan CJ, et al. Beringian standstill and spread of Native American founders. PLoS ONE. 2007;2(9):e829.
- Achilli A, Perego UA, Bravi CM, Coble MD, Kong QP, Woodward SR, et al. The phylogeny of the four panAmerican mtDNA haplogroups. PLoS ONE. 2008;3(3):e1764.
- Malhi RS, Mortensen HM, Eshleman JA, Kemp BM, Lorenz JG, Kaestle FA, Jet al. Native American mtDNA prehistory in the American Southwest. American Journal of Physical Anthropology. 2003;120(2):108-124.
- Kemp BM, Malhi RS, McDonough J, Bolnick DA, Eshleman JA, Rickards O, et al. Genetic analysis of early Holocene skeletal remains from Alaska. American Journal of Physical Anthropology. 2007;132(4):605621.
- Fagundes NJ, Kanitz R, Eckert R, Valls AC, Bogo MR, Salzano FM, et al. Mitochondrial population genomics supports a single pre-Clovis origin. American Journal of Human Genetics. 2008;82(3):583-592.
- Vigilant L, Stoneking M, Harpending H, Hawkes K, Wilson AC. African populations and the evolution of human mitochondrial DNA. Science. 1991;253(5027):1503-1507.
- Kumar S, Stecher G, Li M, Knyaz C, Tamura K. MEGA X: Molecular Evolutionary Genetics Analysis across computing platforms. Molecular Biology and Evolution. 2018;35(6):1547-1549.
- van Oven M, Kayser M. Updated comprehensive phylogenetic tree of global human mitochondrial DNA variation. Human Mutation. 2009;30(2):E386-E394.
- Rozas J, Ferrer-Mata A, Sanchez-DelBarrio JC, GuiraoRico S, Librado P, Ramos-Onsins SE, et al. DnaSP 6: DNA sequence polymorphism analysis of large data sets. Molecular Biology and Evolution. 2017;34(12):3299-3302.
- Bandelt HJ, Forster P, Rohl A. Median-joining networks for inferring intraspecific phylogenies. Molecular Biology and Evolution. 1999;16(1):37-48.
- Reidla M, Kivisild T, Metspalu E, Kaldma K, Tambets K, Tolk HV, et al. Origin and diffusion of mtDNA haplogroup X. American Journal of Human Genetics. 2003;73(5):1178-1190.