
Research article · 2025 · Full text
International Journal of Biology SciencesEndoplasmic reticulum stress response and unfolded protein pathway in pancreatic beta cells
Volume 7(4) · Pages 177–180 · DOI: 10.33545/26649926.2025.v7.i4c.735 ↗
Research areasEndoplasmic Reticulum Stress and DiseasePancreatic function and diabetesIon Channels and Receptors
Abstract
Author-writtenConsider a cell whose sole job is to fold and secrete a single protein insulin at rates that shift dramatically after every meal. Pancreatic beta cells operate under a chronic biosynthetic load that makes them uniquely sensitive to disturbances in endoplasmic reticulum (ER) homeostasis. This research examined the activation kinetics of the three canonical unfolded protein response (UPR) branches IRE1α, PERK, and ATF6 in the INS-1E rat beta-cell line exposed to three ER stressors: thapsigargin (pharmacological positive control), chronically elevated glucose (33 mM), and palmitate (0.5 mM). Cells were treated for 6, 12, 24, and 48 hours, and pathway activation was quantified by qRT-PCR and Western blot for key markers including BiP/GRP78, spliced XBP1, phospho-eIF2α, and CHOP. Thapsigargin induced the fastest and strongest response, with CHOP mRNA rising 5.1-fold by 12 hours. Palmitate activated all three branches within 24 hours (CHOP 4.1-fold, p-eIF2α 3.4-fold), while high glucose produced a more selective pattern dominated by PERK-eIF2α signalling (2.9-fold) with comparatively modest IRE1α activation. Cell viability at 48 hours was 54.3% for thapsigargin, 62.4% for palmitate, and 71.8% for high glucose relative to untreated controls. Pre-treatment with the chemical chaperone 4-phenylbutyric acid (4-PBA, 5 mM) rescued viability to 78.9% under thapsigargin stress and attenuated CHOP expression by 47.3%. These data indicate that glucotoxic and lipotoxic stresses engage partially overlapping but distinguishable UPR signatures in beta cells, with the PERK-CHOP axis serving as the principal apoptotic effector under all conditions tested.
Summary
Source-checkedPlain-language reading of the full paper, prepared with AI and checked against the text. Each point links to the authors' own words.
Why it matters
- Pancreatic beta cells are particularly vulnerable to endoplasmic reticulum (ER) instability because they must constantly fold and secrete insulin. View evidence ↗
- The unfolded protein response (UPR) uses three sensors, IRE1α, PERK, and ATF6, to try and restore ER balance by adjusting protein production and increasing chaperones. View evidence ↗
- If ER stress cannot be resolved, the UPR triggers the transcription factor CHOP, which leads to the death of the beta cell. View evidence ↗
The question
- The researchers aimed to determine if high glucose (glucotoxicity) and high fats (lipotoxicity) activate the UPR in different ways or to different degrees. View evidence ↗
What they did
- The study used INS-1E rat beta cells treated with thapsigargin, 33 mM glucose, or 0.5 mM palmitate to test UPR activation. View evidence ↗
- Pathway activation was measured at 6, 12, 24, and 48 hours using qRT-PCR and Western blot for markers such as BiP, sXBP1, p-eIF2α, and CHOP. View evidence ↗
- To test if the response could be mitigated, cells were pre-treated with 5 mM of the chemical chaperone 4-PBA before exposure to thapsigargin. View evidence ↗
What they found
- Thapsigargin caused the most rapid and intense UPR activation, increasing CHOP mRNA 5.1-fold within 12 hours. View evidence ↗
- Palmitate activated all three UPR branches by 24 hours, with CHOP increasing 4.1-fold and p-eIF2α increasing 3.4-fold. View evidence ↗
- High glucose showed a more selective activation pattern, primarily driving the PERK-eIF2α pathway (2.9-fold) with less effect on IRE1α. View evidence ↗
- At 48 hours, cell viability relative to controls was lowest for thapsigargin (54.3%), followed by palmitate (62.4%) and high glucose (71.8%). View evidence ↗
- Pre-treatment with 5 mM 4-PBA improved viability to 78.9% under thapsigargin stress and reduced CHOP expression by 47.3%. View evidence ↗
- CHOP expression was the strongest predictor of cell death across all stressors, showing a strong negative correlation (Pearson r = -0.91) with 48-hour viability. View evidence ↗
What it means
- The authors conclude that glucose and fat stresses create distinct UPR signatures, but both rely on the PERK-CHOP axis to trigger cell death. View evidence ↗
- The study's findings may not fully apply to primary beta cells because only the INS-1E cell line was used. View evidence ↗
- The therapeutic window of 4-PBA remains undefined as the study only tested a single dose. View evidence ↗
Visual summary
3 visualsIllustrations explain the paper; charts are replotted from the paper's own table values.
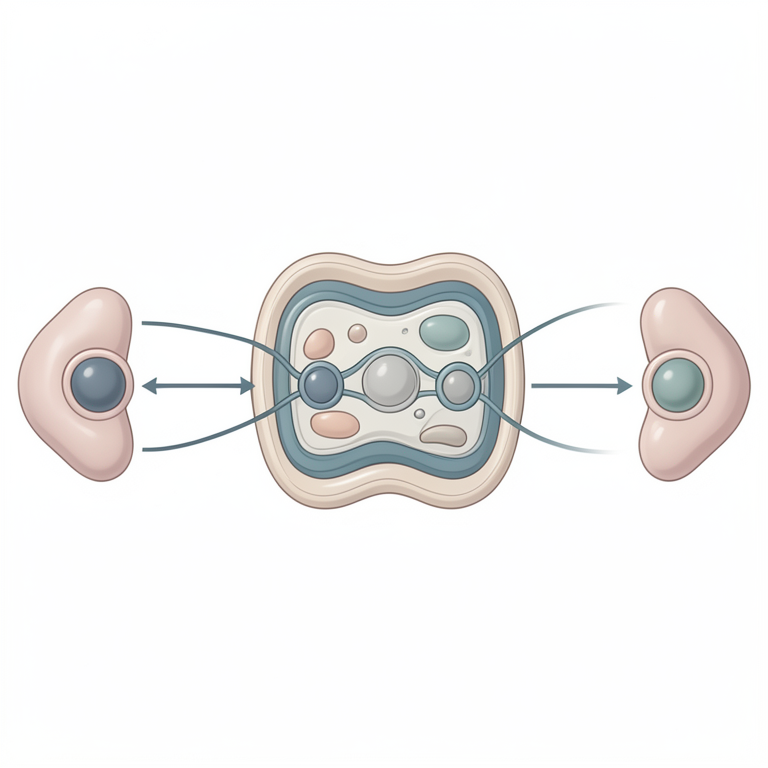
Comparative UPR Activation
AI-generated conceptual illustration (pancreatic beta cells). It explains the idea and does not show study data.
View source evidence ↗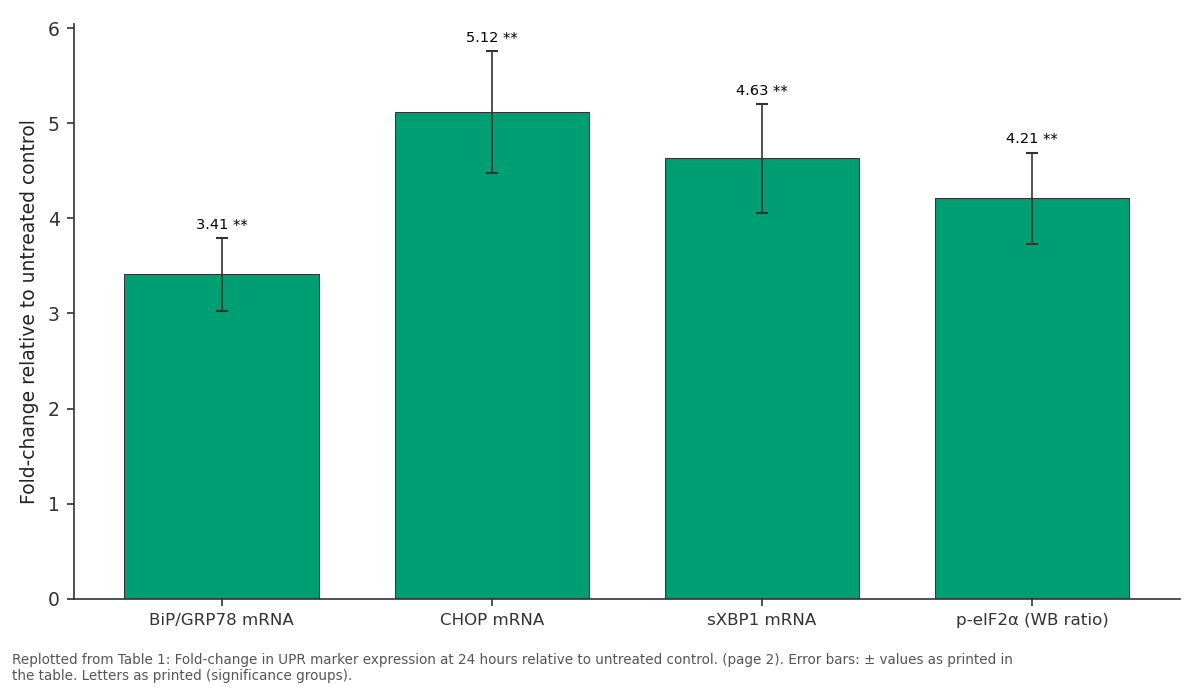
Thapsigargin: BiP/GRP78 mRNA vs CHOP mRNA vs sXBP1 mRNA vs p-eIF2α (WB ratio)
Replotted from Table 1 (page 2) of the original paper. Every bar is the paper's own table value.
View source evidence ↗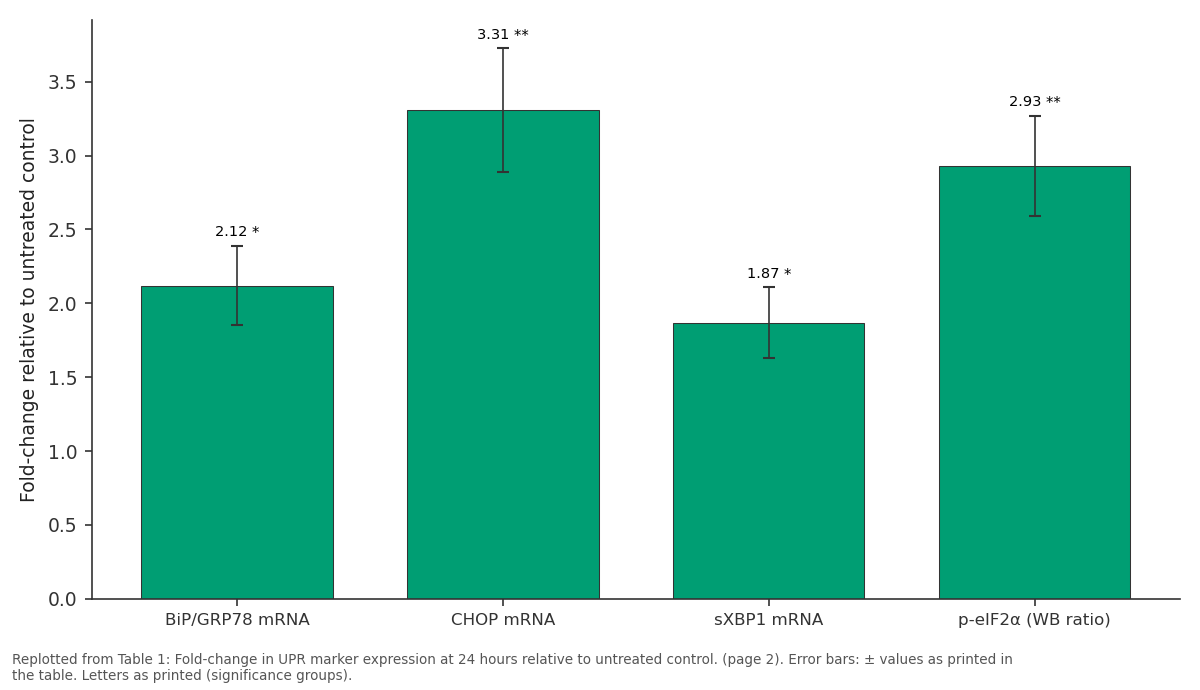
High Glucose: BiP/GRP78 mRNA vs CHOP mRNA vs sXBP1 mRNA vs p-eIF2α (WB ratio)
Replotted from Table 1 (page 2) of the original paper. Every bar is the paper's own table value.
View source evidence ↗Figures & tables
From the original paper Table 1
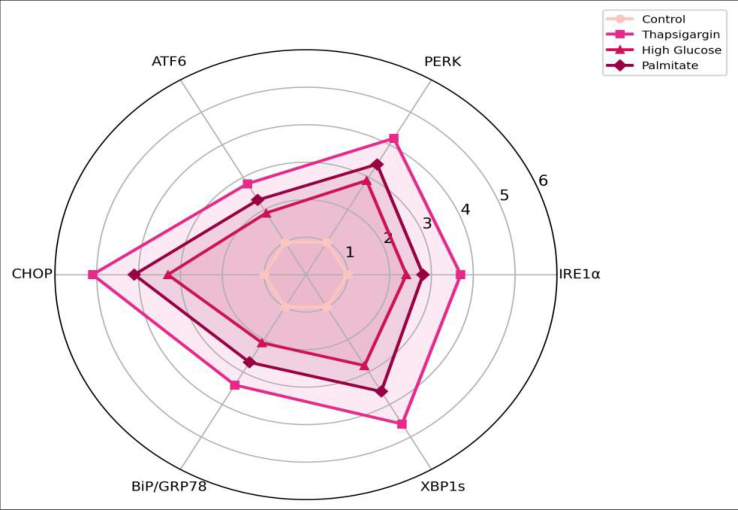 Figure 1
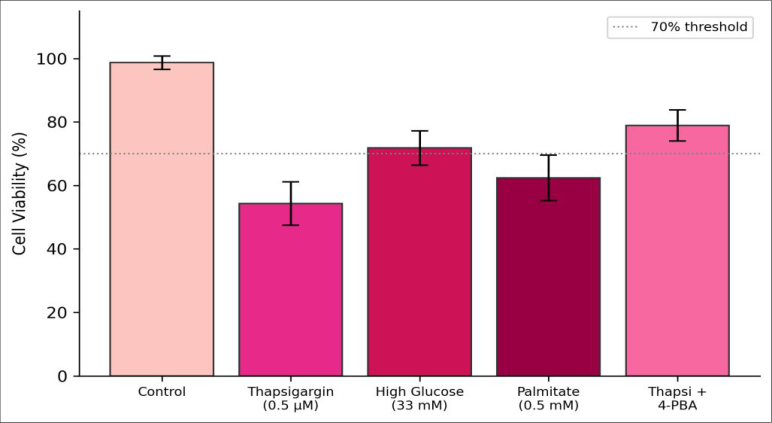 Figure 2
Introduction
A single human beta cell can produce and secrete up to one million molecules of proinsulin per minute during a postprandial insulin surge [1] . That extraordinary biosynthetic burden places the ER under sustained proteostatic pressure, and when the influx of unfolded or misfolded polypeptides exceeds the ER's folding capacity, a conserved signalling network called the unfolded protein response is activated [2] . The UPR comprises three transmembrane sensors IRE1α, PERK, and ATF6 each of which initiates a distinct downstream cascade aimed at restoring ER homeostasis through translational attenuation, upregulation of chaperones, and enhanced ER-associated degradation [3] . When ER stress is prolonged or unresolvable, the UPR shifts from adaptive to terminal, activating the transcription factor CHOP (C/EBP homologous protein), which drives betacell apoptosis [4] . This transition is widely considered a contributing mechanism in type 2 diabetes, where chronic hyperglycaemia and elevated free fatty acids subject beta cells to sustained glucotoxic and lipotoxic stress [5] . But whether glucotoxicity and lipotoxicity trigger quantitatively or qualitatively different UPR signatures remains unsettled. This research addressed that question by comparing the temporal activation profiles of the three UPR branches in INS-1E cells challenged with thapsigargin, high glucose, or palmitate over a 48-hour window. The specific aims were: (i) to map the kinetics of each branch under each stressor, (ii) to determine which branch most strongly predicts apoptosis, and (iii) to test whether the chemical chaperone 4-PBA can attenuate the pro-apoptotic arm of the response.
Quality Control
RNA integrity was verified on an Agilent 2100 Bioanalyzer; only samples with RIN ≥ 8.5 were used for qRT-PCR.
Western blot membranes were stripped and re-probed with β-actin to confirm equal loading, and densitometry was performed in triplicate using ImageJ v1.54. Each experiment was conducted in three independent biological replicates with three technical replicates per condition, and inter-assay coefficients of variation were kept below 12% for all ELISA-based measurements.
Material and Methods
Material and Methods
Material
INS-1E cells (passages 55-70) were maintained in RPMI 1640 supplemented with 10% FBS, 11.1 mM glucose, 10 mM HEPES, 1 mM sodium pyruvate, 50 μM 2mercaptoethanol, and 1% penicillin-streptomycin (all from Gibco, Thermo Fisher). Thapsigargin (Sigma T9033), sodium palmitate (Sigma P9767), and 4-PBA (Sigma SML0309) were prepared as described previously [6] . All cell culture and molecular assays were carried out at the Cell Biology Laboratory, Jeju Marine Biology Institute, Jeju, South Korea, between January and July 2023.
Methods
Cells were seeded at 2 × 10⁵ per well in 12-well plates and allowed to adhere for 24 hours before treatment. Three stressor conditions were applied: thapsigargin (0.5 μM), high glucose (33 mM), and sodium palmitate (0.5 mM conjugated to 0.5% BSA). For the rescue experiment, 4-PBA (5 mM) was added 1 hour before thapsigargin. At each time-point (6, 12, 24, 48 h), cells were harvested for RNA (TRIzol, Invitrogen) and protein (RIPA buffer with protease/phosphatase inhibitors). qRT-PCR used SYBR Green chemistry on a QuantStudio 5 system (Applied Biosystems) with validated primer pairs for BiP, CHOP, spliced XBP1, ATF4, and β-actin as the reference gene [7] . Relative expression was calculated by the 2⁻ΔΔCt method. Western blots for p-eIF2α (Cell Signaling #3398), total eIF2α (#5324), and ATF6 (#65880) were run on 10% SDS-PAGE gels and transferred to PVDF membranes. Cell viability was assessed by MTT assay (Sigma M5655) at 48 hours. Data were analysed by twoway ANOVA (stressor × time) followed by Tukey's HSD in R v4.3.1.
Results
Results
Discussion
The differential UPR signatures observed here suggest that glucotoxicity and lipotoxicity stress beta cells through partially distinct mechanisms. High glucose overloads the ER primarily with proinsulin, engaging the PERK-eIF2α-ATF4-CHOP axis that attenuates global translation while upregulating stress-response genes [2] . Palmitate, in contrast, perturbs ER membrane lipid composition, which activates IRE1α through its transmembrane domain in a manner independent of protein-folding load [8] . CHOP emerged as the strongest predictor of viability loss across all three stressors (Pearson r = -0.91 between CHOP fold-change and 48-h viability), confirming its role as the main executioner in beta-cell ER-stress-induced apoptosis [4] . The partial rescue by 4-PBA is encouraging from a translational standpoint: this chemical chaperone is already FDA-approved for urea-cycle disorders, and repurposing it for diabetes prevention has been proposed [9] . However, the incomplete rescue (viability improved from 54.3% to 78.9%) indicates that other death pathways, likely involving mitochondrial dysfunction, operate in parallel.
A practical consideration is that INS-1E cells, while a widely used beta-cell model, may not fully recapitulate human beta-cell biology [10] . Primary human islets or stemcell-derived beta cells would provide a more clinically relevant context for testing 4-PBA efficacy.
Limitations
The use of a single cell line (INS-1E) limits generalisability to primary beta cells. Palmitate was delivered conjugated to BSA, and the free-to-bound ratio may vary across replicates, introducing dosing variability. The 48-hour window may not capture chronic adaptive responses that develop over days to weeks in vivo. Finally, the chemical chaperone experiment tested only one dose of 4-PBA; a dose-response curve would better define its therapeutic window.
Conclusion
Glucotoxic and lipotoxic ER stressors engage overlapping but distinguishable UPR profiles in INS-1E beta cells. High glucose preferentially activates the PERK branch, palmitate broadly stimulates all three branches, and thapsigargin serves as a maximal activator. CHOP expression is the best single predictor of apoptotic outcome regardless of stressor type. The chemical chaperone 4-PBA partially rescued viability and suppressed CHOP, supporting further investigation of ER-chaperone-based strategies to protect beta cells in the diabetic milieu. Validation in primary human islets and dose-ranging studies are the logical next steps.
Acknowledgement
Acknowledgements Funding SourcesThis research was supported by departmental research funds of the Jeju Marine Biology Institute. Institutional SupportThe authors acknowledge the Cell Biology Laboratory at the Jeju Marine Biology Institute for providing tissue-culture and imaging facilities.
Figures and tables from the paper
| Marker | Control | Thapsigargin | High Glucose | Palmitate |
|---|---|---|---|---|
| BiP/GRP78 mRNA | 1.00 | 3.41±0.38** | 2.12±0.27* | 2.73±0.31** |
| CHOP mRNA | 1.00 | 5.12±0.64** | 3.31±0.42** | 4.14±0.51** |
| sXBP1 mRNA | 1.00 | 4.63±0.57** | 1.87±0.24* | 3.58±0.44** |
| p-eIF2α (WB ratio) | 1.00 | 4.21±0.48** | 2.93±0.34** | 3.41±0.39** |
| ATF6 (WB cleaved) | 1.00 | 2.84±0.33** | 1.91±0.22* | 2.31±0.28** |
Table text extracted from the original PDF; superscript letters are shown inline. The original table image is below.
View original table image
References
18 in the original paper- Schuit FC, Kiekens R, Pipeleers DG. Measuring the balance between insulin synthesis and insulin release. Biochemical and Biophysical Research Communications. 1991;178(3):1182-1187.
- Walter P, Ron D. The unfolded protein response: from stress pathway to homeostatic regulation. Science. 2011;334(6059):1081-1086.
- Hetz C. The unfolded protein response: controlling cell fate decisions under ER stress and beyond. Nature Reviews Molecular Cell Biology. 2012;13(2):89-102.
- Oyadomari S, Mori M. Roles of CHOP/GADD153 in endoplasmic reticulum stress. Cell Death and Differentiation. 2004;11(4):381-389.
- Cnop M, Foufelle F, Velloso LA. Endoplasmic reticulum stress, obesity and diabetes. Trends in Molecular Medicine. 2012;18(1):59-68.
- Cunha DA, Hekerman P, Ladriere L, et al. Initiation and execution of lipotoxic ER stress in pancreatic betacells. Journal of Cell Science. 2008;121(14):2308-2318.
- Livak KJ, Schmittgen TD. Analysis of relative gene expression data using real-time quantitative PCR and the 2(-delta delta C(T)) method. Methods. 2001;25(4):402-408.
- Volmer R, van der Ploeg K, Ron D. Membrane lipid saturation activates endoplasmic reticulum unfolded protein response transducers through their transmembrane domains. Proceedings of the National Academy of Sciences. 2013;110(12):4628-4633.
- Ozcan U, Yilmaz E, Ozcan L, et al. Chemical chaperones reduce ER stress and restore glucose homeostasis in a mouse model of type 2 diabetes. Science. 2006;313(5790):1137-1140.
- Merglen A, Theander S, Rubi B, et al. Glucose sensitivity and metabolism-secretion coupling studied during two-year continuous culture in INS-1E insulinoma cells. Endocrinology. 2004;145(2):667-678.
- Eizirik DL, Cardozo AK, Cnop M. The role for endoplasmic reticulum stress in diabetes mellitus. Endocrine Reviews. 2008;29(1):42-61.
- Han J, Bhagavathula N, Varani J, et al. ER-stressinduced transcriptional regulation increases protein synthesis leading to cell death. Nature Cell Biology. 2013;15(5):481-490.
- Tabas I, Ron D. Integrating the mechanisms of apoptosis induced by endoplasmic reticulum stress. Nature Cell Biology. 2011;13(3):184-190.
- Poitout V, Robertson RP. Glucolipotoxicity: fuel excess and beta-cell dysfunction. Endocrine Reviews. 2008;29(3):351-366.
- Ghosh R, Wang L, Wang ES, et al. Allosteric inhibition of the IRE1α RNase preserves cell viability and function during endoplasmic reticulum stress. Cell. 2014;158(3):534-548.
- Laybutt DR, Preston AM, Åkerfeldt MC, et al. Endoplasmic reticulum stress contributes to beta cell apoptosis in type 2 diabetes. Diabetologia. 2007;50(4):752-763.
- Marchetti P, Bugliani M, Lupi R, et al. The endoplasmic reticulum in pancreatic beta cells of type 2 diabetes patients. Diabetologia. 2007;50(12):24862494.
- Fonseca SG, Gromada J, Bhatt UB, et al. Endoplasmic reticulum stress and pancreatic beta-cell death. Trends in Endocrinology and Metabolism. 2011;22(7):266-274.