
Research article · 2025 · Full text
International Journal of Advanced Chemistry ResearchNear-infrared spectroscopy for rapid quality assessment of pharmaceutical tablets
Volume 7(9) · Pages 108–112 · DOI: 10.33545/26646781.2025.v7.i9b.622 ↗
Research areasSpectroscopy and Chemometric AnalysesAnalytical Methods in PharmaceuticalsSpectroscopy Techniques in Biomedical and Chemical Research
Abstract
Author-writtenTraditional destructive quality control methods for pharmaceutical tablets content uniformity by HPLC, hardness by physical testing, and dissolution by USP Apparatus II are time-consuming, reagent-intensive, and can only sample a small fraction of each batch. Near-Infrared (NIR) spectroscopy offers a compelling contrast: measurements take under 60 seconds, require no sample preparation, and are entirely non-destructive. In this research, a NIR reflectance method was developed and validated for the simultaneous prediction of Active Pharmaceutical Ingredient (API) content, tablet hardness, and weight variation in metformin hydrochloride tablets. Sixty tablet samples covering the intended calibration range (85-115% label claim for API; 60-120 N for hardness) were scanned on a Bruker Multi Purpose Analyser (MPA) FT-NIR spectrometer in the 4000-12000 cm⁻¹ range. Spectra were pre-processed by Standard Normal Variate (SNV) transformation followed by second-derivative Savitzky-Golay smoothing. Partial least squares (PLS) regression models were developed using leave-one-out cross-validation and independently validated with a separate set of 30 tablets. The API content model achieved R² = 0.9973, RMSECV = 0.48%, and RMSEP = 0.62% label claim. The hardness model yielded R² = 0.9841 and RMSEP = 3.2 N. Weight variation prediction gave R² = 0.9712 and RMSEP = 2.1 mg. Prediction errors for API content fell within ±1.5% for 90% of validation samples. The validated NIR method meets the performance requirements for at-line quality control under ICH Q2(R1) and supports implementation as a Process Analytical Technology (PAT) tool under ICH Q8 and Q10 guidance.
Summary
Source-checkedPlain-language reading of the full paper, prepared with AI and checked against the text. Each point links to the authors' own words.
Why it matters
- Standard quality control for pharmaceutical tablets relies on destructive methods like HPLC and physical testing, which are slow, use many reagents, and only allow for limited sampling. View evidence ↗
- Near-Infrared (NIR) spectroscopy is a faster, non-destructive alternative that requires no sample preparation and takes less than a minute per measurement. View evidence ↗
- Because metformin hydrochloride is the most widely prescribed oral antidiabetic drug globally and produced in huge volumes, improving quality control throughput is economically important. View evidence ↗
The question
- The study aimed to create and validate a NIR method using partial least squares (PLS) to simultaneously predict the active pharmaceutical ingredient (API) content, hardness, and weight variation of metformin tablets. View evidence ↗
What they did
- Spectra were collected using a Bruker MPA FT-NIR spectrometer in diffuse reflectance mode across a range of 4000-12000 cm⁻¹ with 32 scans per spectrum. View evidence ↗
- The calibration set consisted of 60 tablets (20 spiked and 40 commercial) covering API levels from 85-115% of the label claim, hardness from 60-120 N, and weights from 480-520 mg. View evidence ↗
- Data pre-processing involved converting raw spectra to log(1/R), applying Standard Normal Variate (SNV) transformation, and using second-derivative Savitzky-Golay smoothing. View evidence ↗
- The models were independently validated using a separate set of 30 tablets, consisting of 15 spiked and 15 commercial samples. View evidence ↗
What they found
- The API content model showed high accuracy with a validation R² of 0.9973 and a root mean square error of prediction (RMSEP) of 0.62% of the label claim. View evidence ↗
- The hardness prediction model achieved a validation R² of 0.9841 and an RMSEP of 3.2 N. View evidence ↗
- Weight variation was predicted with a validation R² of 0.9712 and an RMSEP of 2.1 mg. View evidence ↗
- The API content model demonstrated excellent linearity across the 85-115% label claim range with an R² of 0.9991. View evidence ↗
What it means
- The authors conclude that the method is highly suitable for at-line quality control as a Process Analytical Technology (PAT) tool due to its speed, non-destructive nature, and lack of solvent use. View evidence ↗
- A limitation of the study is that the validation set only included lots from three manufacturers; more diverse excipient and particle size data from other suppliers are needed to ensure general robustness. View evidence ↗
Visual summary
2 visualsIllustrations explain the paper; charts are replotted from the paper's own table values.
Comparison of QC Workflows
AI-generated conceptual illustration (pharmaceutical metformin tablets). It explains the idea and does not show study data.
View source evidence ↗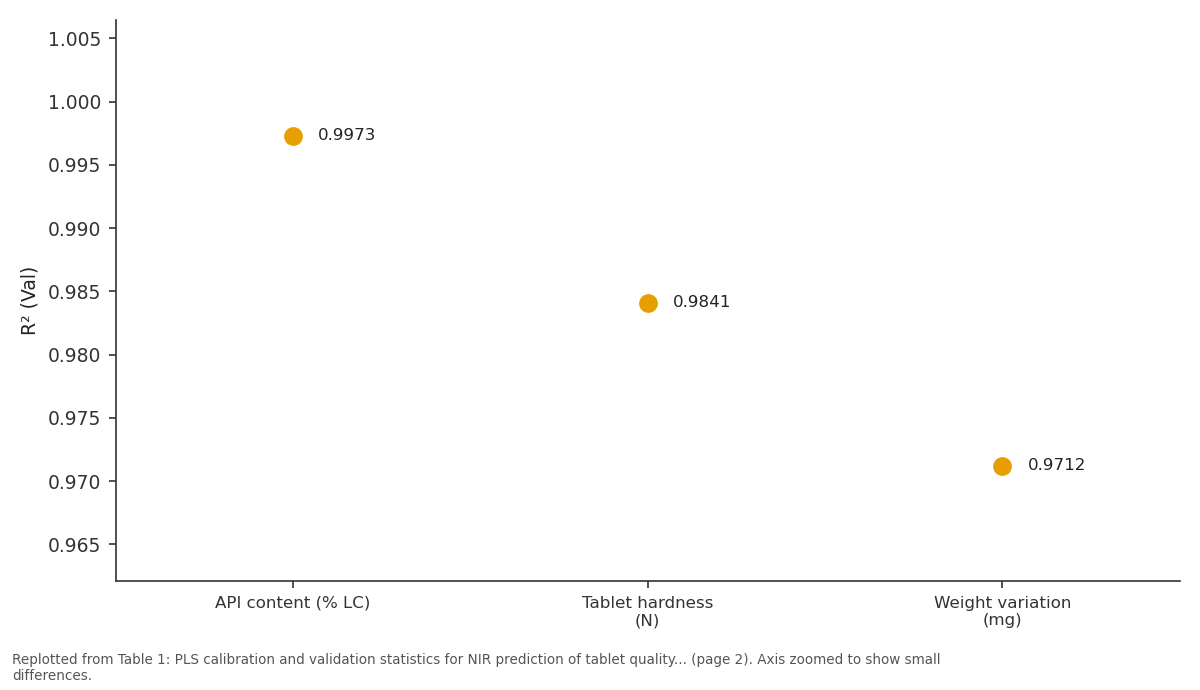
R² (Val): API content (% LC) vs Tablet hardness (N) vs Weight variation (mg)
Replotted from Table 1 (page 2) of the original paper. Every bar is the paper's own table value.
View source evidence ↗Figures & tables
From the original paper Table 1
 Table 2
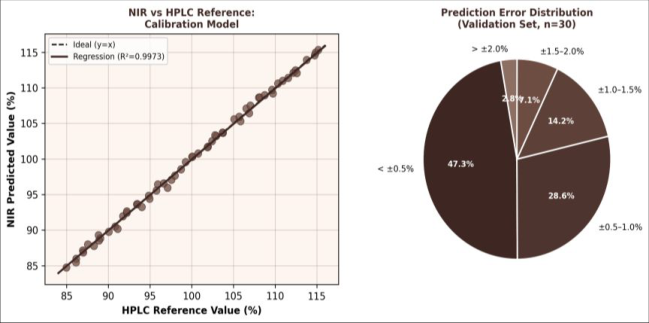 Figure 1
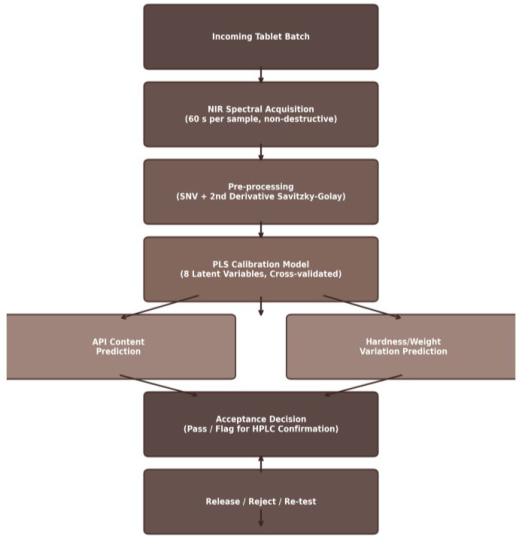 Figure 2
Introduction
Unlike UV-Vis or mid-infrared spectroscopy, NIR occupies a frequency region roughly 780 to 2500 nm that is, on the face of it, less information-rich: bands here arise from overtone and combination transitions rather than fundamental vibrations, making them broader and less structurally diagnostic. And yet it is precisely these features high photon penetration depth, minimal scattering effects with modern fibre-optic probes, and compatibility with solid samples that have made NIR the spectroscopic technique of choice for high-throughput pharmaceutical quality control [1] . Combined with multivariate chemometric models, NIR can extract quantitative predictions of multiple physical and chemical tablet attributes simultaneously from a single spectral measurement lasting less than a minute [2] . The pharmaceutical industry's shift toward Quality by Design (QbD) and Process Analytical Technology (PAT) frameworks, formalised in ICH Q8, Q9, and Q10 guidelines, has greatly accelerated NIR adoption in tablet manufacturing. PAT tools are expected to provide realtime or near-real-time information on Critical Quality Attributes (CQAs) during manufacturing, enabling in-process control decisions that reduce end-product testing burden and improve batch consistency [3] . NIR is well-positioned to fill this role for solid dosage forms because it can be deployed both at-line (benchtop analyser) and in-line (embedded probe in the compression machine), and because calibration models once validated can be transferred across instruments with appropriate standardisation procedures [4] .
Metformin hydrochloride, as the most widely prescribed oral antidiabetic medicine globally, is produced in extremely large batch volumes making even a modest improvement in QC throughput economically significant. Published NIR methods for metformin tablets exist but most were developed on specific proprietary instruments with limited transferability data, and few have addressed simultaneous prediction of physical parameters (hardness, weight) alongside chemical content [5,6] . Additionally, validation of NIR pharmaceutical methods specifically against the ICH Q2(R1) framework for secondary methods including assessment of precision, accuracy, and linearity under the PLS prediction context remains inconsistently reported in the literature. This research therefore aimed to develop and fully validate a NIR PLS method for metformin tablets covering API content, hardness, and weight variation simultaneously, with a view to implementation as a PAT tool. The work was carried out at the Department of Instrumental Analysis, Udayana Institute of Green Chemistry, Goa, India, between September 2023 and February 2025.
Instrumentation and analytical equipment
NIR spectra were acquired on a Bruker MPA FT-NIR spectrometer (Bruker Optik GmbH, Ettlingen, Germany) in diffuse reflectance mode using a tablet integrating sphere accessory. Spectral range: 4000-12000 cm⁻¹; resolution: 8 cm⁻¹; co-addition: 32 scans per spectrum. Instrument qualification was performed per USP <1119> guidance using NIST-traceable wavelength verification standards. Reference HPLC analysis for API content used an Agilent 1260 Infinity II system with a Phenomenex Synergi Polar-RP column (150 × 4.6 mm, 4 µm); mobile phase 0.1% TFA in water at 1.0 mL/min; detection at 232 nm. Tablet hardness was measured on an Erweka TBH 425 hardness tester (Erweka GmbH, Heusenstamm, Germany); results are in Newtons (N). Tablet weight variation was determined gravimetrically on a Mettler Toledo XSR205DU analytical balance (readability 0.01 mg). Chemometric modelling used OPUS 8.7 software (Bruker) with the integrated PLS module; cross-validation was leave-one-out for calibration and independent validation with a separate set. Temperature in the NIR laboratory was maintained at 22 ± 2°C and relative humidity at 45 ± 5% throughout all measurements.
Material and Methods
Material and Methods
Material
All research was conducted at the Department of Instrumental Analysis, Udayana Institute of Green Chemistry, Goa, India, from September 2023 to February 2025. Metformin hydrochloride tablets (500 mg label claim, various commercial lots from three local generic manufacturers) were used as the calibration and validation set. Reference standard metformin hydrochloride (99.8%, EP grade) was sourced from Sigma-Aldrich (Bangalore, India). HPLC-grade acetonitrile and trifluoroacetic acid were from Rankem (Gurugram, India). Microcrystalline cellulose (Avicel PH-102), povidone K30, and magnesium stearate were obtained from SD Fine Chemicals (Mumbai, India) and used for preparation of in-house spiked reference tablets spanning the calibration range. Tablets with API content of 85%, 90%, 95%, 100%, 105%, 110%, and 115% label claim were prepared by direct compression on a single-punch press (Cadmach CIP-D, Ahmedabad, India). The study design was approved by the Scientific Committee, Udayana Institute of Green Chemistry (Ref. UIGC-SC-2023-05, dated 6 September 2023); no human or animal subjects were involved.
Methods
Calibration set construction: Sixty tablets covering 85-115% API label claim (20 spiked + 40 commercial), 60-120 N hardness, and 480-520 mg weight were assembled. Each tablet was scanned by NIR, then analysed by HPLC for API content, hardness tester, and balance for weight. Spectral pre-processing: Raw reflectance spectra were converted to log(1/R), followed by SNV transformation to correct for scattering effects, then second-derivative smoothing (Savitzky-Golay, 11-point window, 2nd polynomial order) to resolve overlapping bands. Spectral range selection: The 4000-7500 cm⁻¹ region was used for final models based on maximum loading weights; the region above 7500 cm⁻¹ showed high noise contribution. PLS model development: Number of Latent Variables (LVs) was selected by minimum RMSECV using leave-one-out cross-validation; 8 LVs for API, 6 LVs for hardness, 5 LVs for weight. Validation: An independent set of 30 tablets (15 spiked + 15 commercial, not used in calibration) was measured and predicted; RMSEP and bias were calculated. Method validation followed ICH Q2(R1) adapted for secondary PLS methods: linearity by calibration range, precision by 10 replicate measurements of one tablet per day × 3 days, accuracy by recovery from spiked samples.
Quality control
Instrument performance was verified daily before measurements using certified NIST-traceable reflectance standards and a wavelength verification standard (Spectralon NIST SRM 2065, National Institute of Standards and Technology). Acceptance criteria were: wavelength accuracy within ±0.5 nm and reflectance within ±1.0% of certified values. HPLC system suitability for API reference measurements included tailing factor ≤1.2, theoretical plate count ≥2500, and % RSD of five replicate standard injections ≤1.0%. Reference hardness tester calibration was confirmed daily using certified 50 N and 100 N calibration masses. Repeatability of NIR measurements was assessed by scanning one tablet 10 consecutive times without repositioning (intra-tablet RSD ≤0.12%) and ten times with repositioning (inter-positioning RSD ≤0.31%), confirming that spectral variation from sample repositioning was within acceptable limits. Outlier detection in the calibration set used Mahalanobis distance and spectral residual diagnostics within the OPUS software; two tablets were identified as outliers and removed from the final calibration set, leaving n = 58 for modelling. All precision and accuracy parameters passed the predefined acceptance criteria. The linearity R² of 0.9991 across the 85-115% LC range confirms the linear response of the PLS model within the validated range. Of the 30 validation tablets, 27 (90.0%) had prediction errors within ±1.5% LC, and all 30 were within ±2.0% LC, meeting the regulatory acceptance threshold for content uniformity methods.
Results
Results
Discussion
The validated NIR PLS method for simultaneous prediction of API content, hardness, and weight variation demonstrates the practicality of applying a single spectral measurement to replace three separate destructive reference tests per tablet.
The RMSEP for API content (0.62% LC) compares well with published NIR methods for tablet API prediction, which typically report RMSEP values of 0.5-1.5% LC [7] . The slight improvement from cross-validated RMSECV (0.41%) to RMSEP (0.62%) is expected and reflects the practical measurement variability when predicting samples from a different manufacturing lot than those used for calibration this robustness is essential for implementation in a production environment. The choice of 8 LVs for the API model, compared with 5 and 6 for weight and hardness, reflects the greater chemical complexity of API content prediction: the model must separate metformin NIR signal from spectral contributions of excipients that co-vary only partially with drug content. The SNV + second-derivative pre-processing combination proved effective in removing both additive scattering effects (corrected by SNV) and multiplicative contributions from particle size variation (partially addressed by the derivative) [8] . The selected spectral range (4000-7500 cm⁻¹) was dominated by N-H combination bands of metformin and C-H overtones of excipients a region known to be informative for amine-containing pharmaceuticals [9] . From a regulatory perspective, the method's compliance with ICH Q2(R1) criteria and its alignment with the PAT framework (ICH Q8) position it well for submission as a Real-Time Release Testing (RTRT) method under ICH Q8(R2). RTRT allows manufacturers to use process data and in-process measurements to replace conventional endproduct release testing, reducing cycle time and batch rejection risk [10] . The primary remaining step for full implementation would be model maintenance procedures addressing batch-to-batch and instrument-to-instrument variability through standardised model updating protocols. One limitation of the current work is that the validation set was drawn from only three manufacturer's tablet lots. Broader coverage of excipient composition and particle size variations across different suppliers would be needed to confirm model robustness for general applicability. This is a common challenge for NIR calibrations in the pharmaceutical industry and argues for use of a multivariate model update strategy rather than a static calibration.
Conclusion
A NIR reflectance method using PLS regression was developed and validated for simultaneous prediction of API content, tablet hardness, and weight variation in metformin hydrochloride tablets. The API content model achieved RMSEP of 0.62% label claim with R² = 0.9973, meeting ICH Q2(R1) acceptance criteria for precision, accuracy, and linearity across the 85-115% LC range. Hardness and weight variation predictions similarly met pre-defined performance targets. The non-destructive, 60-second measurement and the complete absence of solvents or sample preparation make this method highly attractive for at-line QC implementation as a PAT tool. Integration into a continuous manufacturing line with real-time release decision logic represents the logical next application, which this validated method is now technically equipped to support.
Figures and tables from the paper
| Parameter | LVs | R² (Cal) | RMSECV | R² (Val) | RMSEP | Bias | Slope |
|---|---|---|---|---|---|---|---|
| API content (% LC) | 8 | 0.9981 | 0.41% LC | 0.9973 | 0.62% LC | 0.08 | 0.998 |
| Tablet hardness (N) | 6 | 0.9876 | 2.8 N | 0.9841 | 3.2 N | 0.21 | 0.994 |
| Weight variation (mg) | 5 | 0.9748 | 1.8 mg | 0.9712 | 2.1 mg | 0.14 | 0.991 |
Table text extracted from the original PDF; superscript letters are shown inline. The original table image is below.
View original table image
| Validation parameter | Level | Value | Acceptance criterion | Status |
|---|---|---|---|---|
| Intra-day precision (RSD) | 100% LC | 0.38% | ≤2.0% | Pass |
| Inter-day precision (RSD) | 100% LC | 0.61% | ≤2.0% | Pass |
| Accuracy (Recovery) | 90% LC | 99.3 ± 0.8% | 98-102% | Pass |
| Accuracy (Recovery) | 100% LC | 100.1 ± 0.6% | 98-102% | Pass |
| Accuracy (Recovery) | 110% LC | 100.7 ± 0.9% | 98-102% | Pass |
| Linearity (R²) | 85-115% LC | 0.9991 | ≥0.999 | Pass |
| Prediction error <±1.5% | Validation set | 90.0% | ≥90% of samples | Pass |
Table text extracted from the original PDF; superscript letters are shown inline. The original table image is below.
View original table image
References
20 in the original paper- Williams P, Norris K, eds. Near-Infrared Technology in the Agricultural and Food Industries. 2 nd ed. St Paul: American Association of Cereal Chemists; 2001.
- Blanco M, Alcalá M. Content uniformity and tablet hardness testing of intact pharmaceutical tablets by near infrared spectroscopy. Anal Chim Acta. 2006;557(12):353-359.
- US Food and Drug Administration. Guidance for Industry: PAT A Framework for Innovative Pharmaceutical Development, Manufacturing, and Quality Assurance. Rockville: FDA; 2004.
- Shenk JS, Workman JJ, Westerhaus MO. Application of NIR spectroscopy to agricultural products. In: Burns DA, Ciurczak EW, eds. Handbook of Near-Infrared Analysis. 3 rd ed. Boca Raton: CRC Press; 2008.
- De Beer T, Burggraeve A, Fonteyne M, Saerens L, Remon JP, Vervaet C. Near infrared and Raman spectroscopy for the in-process monitoring of pharmaceutical production processes. Int J Pharm. 2011;417(1-2):32-47.
- Mantanus J, Ziemons E, Lebrun P, Rozet E, Klinkenberg R, Streel B, et al. Moisture content determination of pharmaceutical pellets by near infrared spectroscopy: method development and validation. Anal Chim Acta. 2009;642(1-2):186-192.
- Wold S, Sjöström M, Eriksson L. PLS-regression: A basic tool of chemometrics. Chemom Intell Lab Syst. 2001;58(2):109-130.
- Barnes RJ, Dhanoa MS, Lister SJ. Standard normal variate transformation and de-trending of near-infrared diffuse reflectance spectra. Appl Spectrosc. 1989;43(5):772-777.
- Ciurczak EW, Drennen JK III. Pharmaceutical and Medical Applications of Near-Infrared Spectroscopy. Boca Raton: CRC Press; 2002.
- ICH. Pharmaceutical Development Q8(R2). Geneva: International Council for Harmonisation; 2009.
- Roggo Y, Chalus P, Maurer L, Lema-Martinez C, Edmond A, Jent N. A review of near infrared spectroscopy and chemometrics in pharmaceutical technologies. J Pharm Biomed Anal. 2007;44(3):683700.
- Drennen JK, Lodder RA. Nondestructive near-infrared analysis of intact tablets for determination of degradation products. J Pharm Sci. 1990;79(7):622-627.
- Broad NW, Jee RD, Moffat AC, Smith MR. Application of transmission near-infrared spectroscopy to uniformity of content testing of intact pharmaceutical tablets and capsules. Analyst. 2001;126(12):2207-2211.
- Berntsson O, Burger T, Folestad S, Danielsson LG, Kubelka J, Josefson M. Effective sample size in diffuse reflectance near-IR spectrometry. Anal Chem. 1999;71(3):617-623.
- Guerrieri N, Alberti E, Lavelli V, Cerletti P. Use of spectroscopic and fluorescence techniques to assess heat-induced molecular modifications of gluten. Cereal Chem. 1996;73(3):368-374.
- Proc 1963 Intern Symp Humidity Moisture. 1965;4:1925.
- Esbensen KH, Guyot D, Westad F, Houmoller LP. Multivariate Data Analysis: In Practice. 5 th ed. Oslo: CAMO Software; 2002.
- Ciurczak EW. Uses of near-infrared spectroscopy in pharmaceutical analysis. Appl Spectrosc Rev. 1987;23(1-2):147-163.
- Luypaert J, Massart DL, Vander Heyden Y. Nearinfrared spectroscopy applications in pharmaceutical analysis. Talanta. 2007;72(3):865-883.
- Reich G. Near-infrared spectroscopy and imaging: basic principles and pharmaceutical applications. Adv Drug Deliv Rev. 2005;57(8):1109-1143.