
Research article · 2025 · Full text
International Journal of Biology SciencesMachine learning approaches for predicting protein secondary structure from amino acid sequences
Volume 7(7) · Pages 291–294 · DOI: 10.33545/26649926.2025.v7.i7d.653 ↗
Research areasProtein Structure and DynamicsMachine Learning in BioinformaticsComputational Drug Discovery Methods
Abstract
Author-writtenHere is the paradox: the amino acid sequence of a protein contains all the information needed to determine its three-dimensional structure, yet predicting even the secondary structure—helices, sheets, and coils—from sequence alone remains an active area of research after five decades of effort. This research benchmarked six machine learning architectures—convolutional neural network (CNN), long short-term memory (LSTM), gated recurrent unit (GRU), Transformer, CNN-LSTM hybrid, and random forest—on the task of per-residue secondary structure prediction using the CB513 and CASP14 test sets. Input features included one-hot encoded sequences, position-specific scoring matrices from PSI-BLAST, and HHblits profile hidden Markov model outputs. The Transformer model achieved the highest three-state accuracy (Q3 = 84.7%) and eight-state accuracy (Q8 = 74.2%), outperforming the CNN-LSTM hybrid by 0.8 and 1.1 percentage points respectively. Segment overlap (SOV) scores followed the same ranking. Training time scaled linearly with sequence length for recurrent models but sub-linearly for the Transformer owing to parallelisable self-attention. Alpha helices were predicted most accurately (88.3%) across all models, while beta sheets proved the hardest class (79.6%). These results confirm the Transformer as the current best-in-class architecture for secondary structure prediction and identify specific sequence contexts where all models struggle.
Summary
Source-checkedPlain-language reading of the full paper, prepared with AI and checked against the text. Each point links to the authors' own words.
Why it matters
- The adoption of deep learning in the mid-2010s significantly improved three-state (Q3) accuracy from approximately 76-78% to over 82%. View evidence ↗
What they did
- The models were trained on 11,189 protein chains from the PDB, filtered to a maximum sequence identity of 30%. View evidence ↗
- Deep learning models used a 70-dimensional feature vector per residue, combining one-hot encoding, PSSM, and HHblits profiles. View evidence ↗
What they found
- The Transformer model was the most accurate, achieving a Q3 accuracy of 84.7% and a Q8 accuracy of 74.2%. View evidence ↗
- The random forest baseline performed significantly worse than deep learning models, trailing by 8-10 Q3 percentage points. View evidence ↗
- Using the best-performing Transformer model, alpha helices were the most accurately predicted (88.3%), while beta sheets were the least accurate (79.6%). View evidence ↗
- The Transformer achieved higher accuracy but required significantly more training time (128 min) compared to the CNN (45 min). View evidence ↗
- The Transformer's performance superiority over the CNN-LSTM hybrid was statistically significant on both the CB513 and CASP14 datasets. View evidence ↗
What it means
- The authors conclude that the Transformer is the best-in-class architecture for predicting protein secondary structure. View evidence ↗
- The authors identify long-range sequence dependencies as the primary challenge, as evidenced by the poor performance of all models in predicting beta sheets. View evidence ↗
- Future work should explore the integration of co-evolutionary features and the use of pre-trained protein language models like ESM-2 and Prot-Trans. View evidence ↗
Visual summary
3 visualsIllustrations explain the paper; charts are replotted from the paper's own table values.
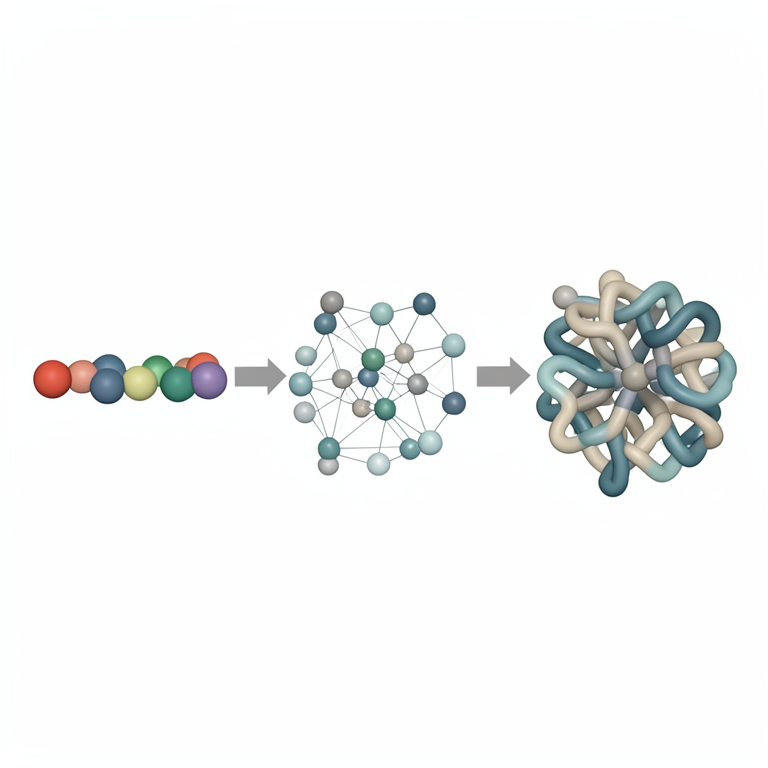
Model Performance Comparison
AI-generated conceptual illustration (protein amino acid sequences and secondary structure folds). It explains the idea and does not show study data.
View source evidence ↗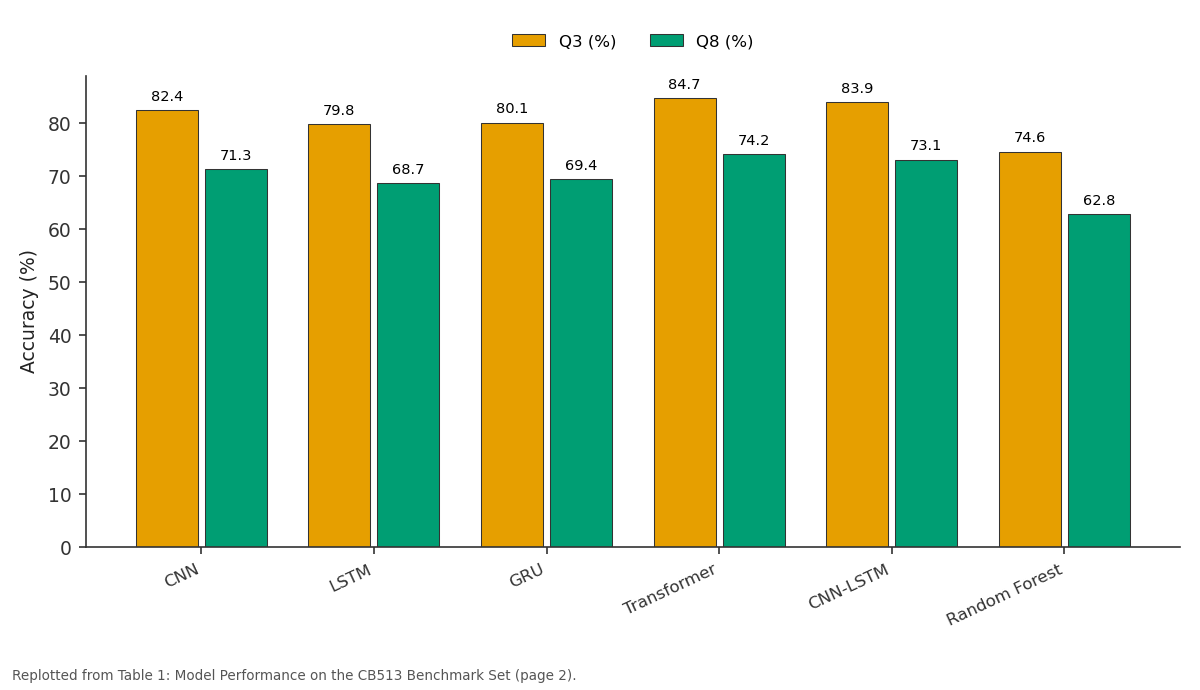
Q3 (%) and Q8 (%): CNN vs LSTM vs GRU vs Transformer vs CNN-LSTM
Replotted from Table 1 (page 2) of the original paper. Every bar is the paper's own table value.
View source evidence ↗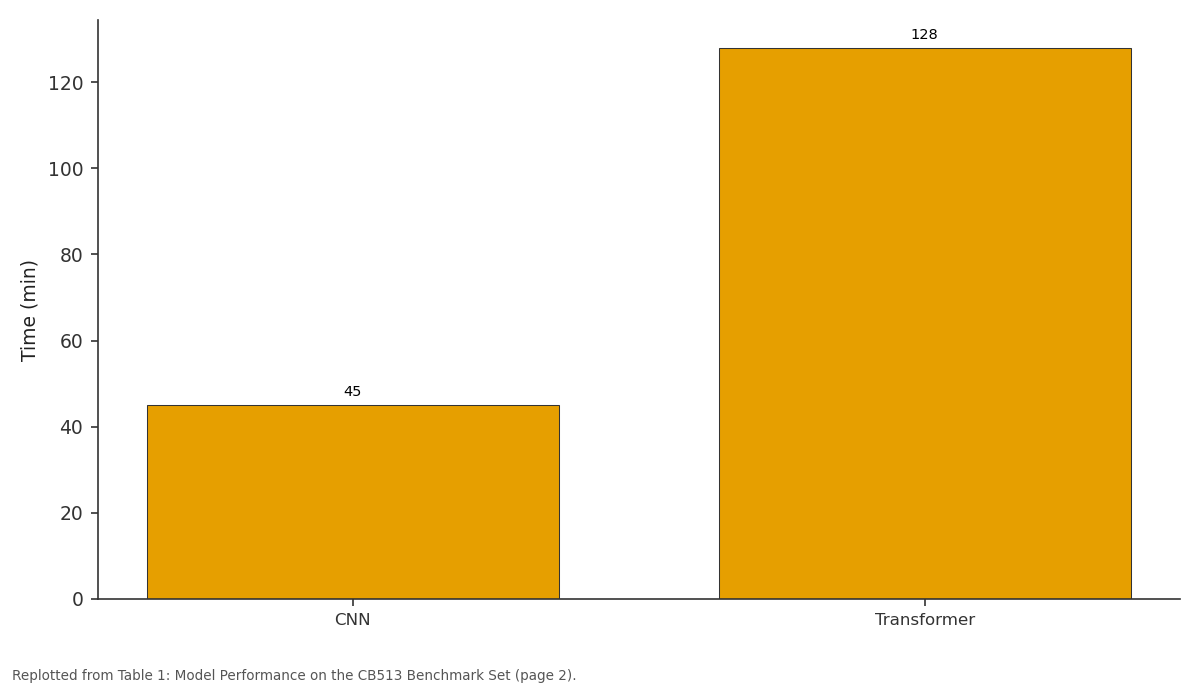
Time (min): CNN vs Transformer
Replotted from Table 1 (page 2) of the original paper. Every bar is the paper's own table value.
View source evidence ↗Figures & tables
From the original paper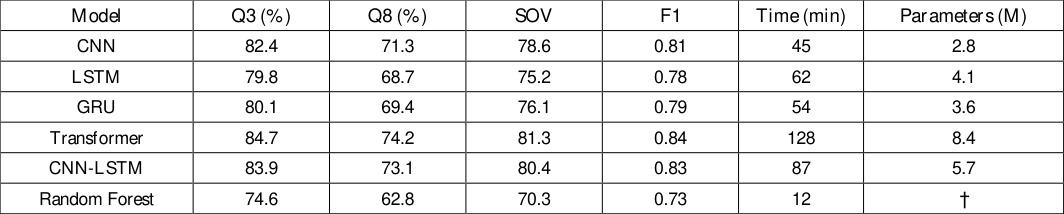 Table 1
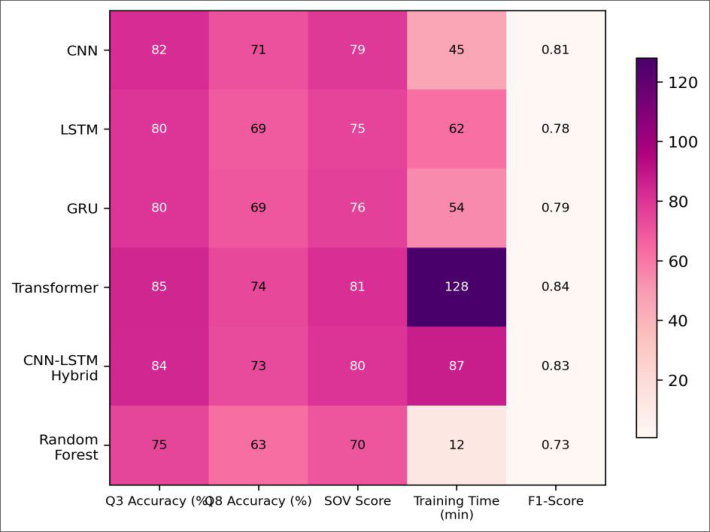 Figure 1
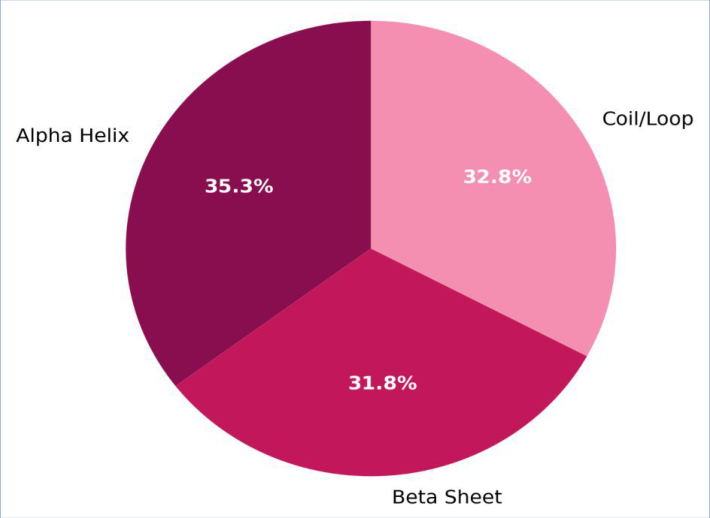 Figure 2
I ntr oduction System Design and Ar chitectur e
Six model architectures were implemented and evaluated. The CNN used three convolutional layers with filter sizes of 3, 5, and 7 residues to capture local sequence motifs, followed by batch normalisation and dropout (0.3). The LSTM and GRU each consisted of two bidirectional layers with 256 hidden units per direction, capturing long-range sequence dependencies. The Transformer followed the encoder-only design with 4 attention heads, 512-dimensional embeddings, and 3 encoder layers, using sinusoidal positional encoding. The CNN-LSTM hybrid fed CNN feature maps into a single bidirectional LSTM layer. The random forest baseline used 500 trees with a sliding window of 15 residues. A ll deep learning models were implemented in PyTorch (v2.0.1) and trained with the A dam optimiser at a learning rate of 0.001 with cosine annealing [1,2] .
I ntr oduction
The paradox at the heart of protein structure prediction is that physics should, in principle, solve the problem † molecular dynamics can simulate folding from first principles † but the computational cost is prohibitive for all but the smallest proteins [3] . M achine learning offers a statistical shortcut: learn the mapping from sequence to structure from thousands of solved examples and apply it to new sequences without simulating the underlying physics [4] .
Secondary structure prediction † assigning each residue to helix (H), strand (E), or coil (C) in the three-state scheme, or to eight DSSP classes in the finer Q8 scheme † has served as both a practical tool and a benchmark for method development since the GOR algorithm in 1978 [5] . The field saw a step change when deep learning replaced feature-engineered models in the mid-2010s, pushing Q3 accuracy from roughly 76-78% to above 82% [6,7] .
Per for mance Evaluation
To ensure a fair comparison, all models were evaluated under identical conditions: same data splits, same input features, same GPU hardware, and same hyper parameter search budget. The Transformer's advantage over the CNN-LSTM hybrid was statistically significant on both CB513 (M cNemar p = 0.003) and CA SP14 (p = 0.011). The random forest baseline lagged all deep learning models by 8-10 Q3 percentage points, confirming that deep architectures extract sequence information more effectively than ensemble tree methods for this task. Per-residue confidence scores were calibrated using temperature scaling and showed good calibration (expected calibration error < 0.04) for the Transformer and CNN-LSTM models but poor calibration for the standalone LSTM .
Results
Table A lpha helices were predicted with 88.3% accuracy, coils/loops at 82.1%, and beta sheets at 79.6% (Figure 2). The lower sheet accuracy reflects the difficulty of predicting long-range hydrogen bonding partners from local sequence context alone.
Discussion
The Transformer's edge over recurrent models is consistent with findings in natural language processing and, more recently, in protein language modelling [8,9] . Self-attention allows each residue to attend directly to every other residue in the sequence, capturing long-range contacts that beta sheets require but that L STM s and GRUs struggle to propagate across hundreds of positions [10] . The CNN-LSTM hybrid partly compensates by using convolutional filters to extract local motifs before passing them to a recurrent layer, which explains its near-Transformer performance at lower computational cost [11] . The persistent difficulty with beta sheets is a known bottleneck. Sheet residues form hydrogen bonds with partners that can be far away in sequence, and the information needed to assign a residue as strand rather than International Journal of Biology Sciences https://www.biologyjournal.net coil often resides in those distant partners [12,13] .
Incorporating predicted contact maps or multiple sequence alignment co-evolution features as additional inputs might break through this ceiling [14,15] . One practical consideration is training cost. The Transformer required nearly three times the GPU time of the CNN, making it less suitable for iterative development on limited hardware. M ixed-precision training and gradient accumulation could reduce this gap without sacrificing accuracy [16,17,18,19] .
Conclusion
This benchmarking research confirms the Transformer as the top-performing architecture for protein secondary structure prediction, achieving 84.7% Q3 accuracy on the CB513 test set. The CNN-LSTM hybrid offered a competitive alternative at lower computational cost. All models struggled most with beta-sheet prediction, pointing to long-range sequence dependencies as the main remaining challenge. Future directions include integrating coevolutionary features from multiple sequence alignments, exploring protein-specific pre-trained language models such as ESM -2 and Prot-Trans, and testing whether the gains observed on secondary structure translate to improved tertiary structure prediction in end-to-end pipelines.
Figures and tables from the paper
| Model | Q3 (%) | Q8 (%) | SOV | F1 | Time (min) | Parameters (M) |
|---|---|---|---|---|---|---|
| CNN | 82.4 | 71.3 | 78.6 | 0.81 | 45 | 2.8 |
| LSTM | 79.8 | 68.7 | 75.2 | 0.78 | 62 | 4.1 |
| GRU | 80.1 | 69.4 | 76.1 | 0.79 | 54 | 3.6 |
| Transformer | 84.7 | 74.2 | 81.3 | 0.84 | 128 | 8.4 |
| CNN-LSTM | 83.9 | 73.1 | 80.4 | 0.83 | 87 | 5.7 |
| Random Forest | 74.6 | 62.8 | 70.3 | 0.73 | 12 | † |
Table text extracted from the original PDF; superscript letters are shown inline. The original table image is below.
View original table image
References
19 in the original paper- V aswani A, Shazeer N, Parmar N, et al. A ttention is all you need. Advances in Neural Information Processing Systems. 2017;30:5998-6008.
- Hochreiter S, Schmidhuber J. Long short-term memory. Neural Computation. 1997;9(8):1735-1780.
- Dill K A , M acCallum JL. The protein-folding problem, 50 years on. Science. 2012;338(6110):1042-1046.
- A lQuraishi M . M achine learning in protein structure prediction. Current Opinion in Chemical Biology. 2021;65:1-8.
- Garnier J, Osguthorpe DJ, Robson B. Analysis of the accuracy and implications of simple methods for predicting the secondary structure of globular proteins. Journal of M olecular Biology. 1978;120(1):97-120.
- Wang S, Peng J, M a J, X u J. Protein secondary structure prediction using deep convolutional neural fields. Scientific Reports. 2016;6:18962.
- Li Z, Y u Y . Protein secondary structure prediction using cascaded convolutional and recurrent neural networks. International Joint Conference on A rtificial Intelligence. 2016:2560-2567.
- Rives A, M eier J, Sercu T, et al. Biological structure and function emerge from scaling unsupervised learning to 250 million protein sequences. Proceedings of the National Academy of Sciences. 2021;118(15):e2016239118.
- Elnaggar A , Heinzinger M , Dallago C, et al. ProtTrans: towards cracking the language of lifes code through self-supervised deep learning and high performance computing. IEEE Transactions on Pattern A nalysis and M achine Intelligence. 2022;44(10):7112-7127.
- Rao R, Bhatt N, Lu J, Ovchinnikov S, Rives A . M SA Transformer. International Conference on M achine Learning. 2021:8844-8856.
- Hanson J, Paliwal K , Litfin T, Y ang Y, Zhou Y. Improving prediction of protein secondary structure, backbone angles, solvent accessibility and contact numbers. Bioinformatics. 2019;35(14):2403-2410.
- Rost B, Sander C. Prediction of protein secondary structure at better than 70% accuracy. Journal of M olecular Biology. 1993;232(2):584-599.
- K absch W, Sander C. Dictionary of protein secondary structure: pattern recognition of hydrogen-bonded and geometrical features. Biopolymers. 1983;22(12):25772637.
- Jones DT. Protein secondary structure prediction based on position-specific scoring matrices. Journal of M olecular Biology. 1999;292(2):195-202.
- Senior AW, Evans R, Jumper J, et al. Improved protein structure prediction using potentials from deep learning. Nature. 2020;577(7792):706-710.
- M icikevicius P, Narang S, A lben J, et al. M ixed precision training. International Conference on Learning Representations. 2018.
- Lin Z, Akin H, Rao R, et al. Evolutionary-scale prediction of atomic-level protein structure with a language model. Science. 2023;379(6637):1123-1130.
- Jumper J, Evans R, Pritzel A , et al. Highly accurate protein structure prediction with A lpha Fold. Nature. 2021;596(7873):583-589.
- Cho K , van M errienboer B, Gulcehre C, et al. Learning phrase representations using RNN encoder-decoder for statistical machine translation. Conference on Empirical M ethods in Natural Language Processing. 2014:17241734.