
Research article · 2025 · Full text
International Journal of Biology SciencesRenal osmoregulation and aquaporin expression in fish adapted to variable salinity environments
Volume 7(5) · Pages 185–188 · DOI: 10.33545/26649926.2025.v7.i5c.725 ↗
Research areasIon Transport and Channel RegulationPhysiological and biochemical adaptationsEnvironmental Toxicology and Ecotoxicology
Abstract
Author-writtenThink of a fish swimming from a river estuary into the open sea - within hours, every cell in its body must reverse its water and ion handling strategy. This analogy captures the osmoregulatory challenge faced by euryhaline teleosts, which move between freshwater and seawater habitats. This research examined renal aquaporin (AQP) isoform expression and ion transporter activity in the euryhaline tilapia (Oreochromis mossambicus) acclimated to freshwater (FW, 0 ppt), brackish water (BW, 15 ppt), and seawater (SW, 35 ppt) for 14 days, and during acute FW-to-SW transfer over 7 days. Kidney tissues from 72 fish (24 per salinity, plus 24 for the transfer time-course) were analyzed by RT-qPCR, western blot, and immunohistochemistry at the Kandy College of Biological Sciences, Sri Lanka, from March to October 2023. AQP1 expression was 3.7-fold higher in FW-acclimated kidneys (promoting water reabsorption), while AQP3 and the Na-K-2Cl cotransporter NKCC2 were 4.5-fold and 5.3-fold higher in SW kidneys (facilitating water excretion and ion secretion). During acute transfer, AQP1 downregulation began within 6 hours and reached SW-acclimated levels by 48 hours, while AQP3 and NKCC2 upregulation followed a slightly slower time course (72 hours to plateau). Immunolocalization showed AQP1 in proximal tubule apical membranes and AQP3 in collecting duct basolateral membranes, consistent with their opposing roles in water handling. These results map the renal molecular toolkit that enables euryhaline fish to toggle between water-conserving and water-excreting kidney modes.
Summary
Source-checkedPlain-language reading of the full paper, prepared with AI and checked against the text. Each point links to the authors' own words.
Why it matters
- Euryhaline species, such as the Mozambique tilapia, are capable of rapidly remodeling their renal transporter and channel expression to adapt to different salinities. View evidence ↗
- Aquaporins (AQPs) serve as the essential water channels that enable the kidney to switch its water-handling strategy. View evidence ↗
The question
- The study aimed to resolve the time course of AQP expression changes during salinity transfer and how they coordinate with the remodeling of ion transporters. View evidence ↗
What they did
- The researchers studied Mozambique tilapia acclimated to freshwater (0 ppt), brackish water (15 ppt), and seawater (35 ppt) for 14 days, as well as fish undergoing an acute transfer from freshwater to seawater over 7 days. View evidence ↗
- Kidney tissues from 72 fish were analyzed using RT-qPCR, western blot, and immunohistochemistry between March and October 2023. View evidence ↗
- The study measured the expression of AQP1, AQP3, NKCC2, NCC, Na+/K+-ATPase α1a, and V-ATPase B subunit using RT-qPCR. View evidence ↗
- Plasma osmolality was determined via freezing-point depression, and kidney Na+/K+-ATPase activity was measured by ouabain-sensitive phosphate liberation. View evidence ↗
What they found
- AQP1 expression was 3.7-fold higher in freshwater-acclimated kidneys compared to seawater kidneys, supporting water reabsorption in freshwater. View evidence ↗
- In seawater-acclimated kidneys, AQP3 and NKCC2 expression were 4.5-fold and 5.3-fold higher than in freshwater kidneys, respectively, to facilitate water excretion and ion secretion. View evidence ↗
- Despite a 35-fold difference in external salinity, plasma osmolality remained stable between 298 and 347 mOsm/kg. View evidence ↗
- During acute transfer to seawater, AQP1 expression began to decline within 6 hours, dropped by 50% by 12 hours, and reached seawater levels by 48 hours. View evidence ↗
- The upregulation of AQP3 and NKCC2 occurred more slowly than AQP1 downregulation, reaching steady-state seawater levels by 72 hours. View evidence ↗
- Immunohistochemistry localized AQP1 to the apical membranes of the proximal tubule and AQP3 to the basolateral membranes of the collecting duct. View evidence ↗
What it means
- The authors conclude that tilapia kidneys switch between water-reabsorbing and water-excreting modes by deploying opposite profiles of aquaporins and ion transporters. View evidence ↗
- The authors identify a physiological vulnerability window of 12-24 hours during acute transfer, where there is a lag between the loss of AQP1 and the establishment of AQP3/NKCC2. View evidence ↗
Visual summary
4 visualsIllustrations explain the paper; charts are replotted from the paper's own table values.
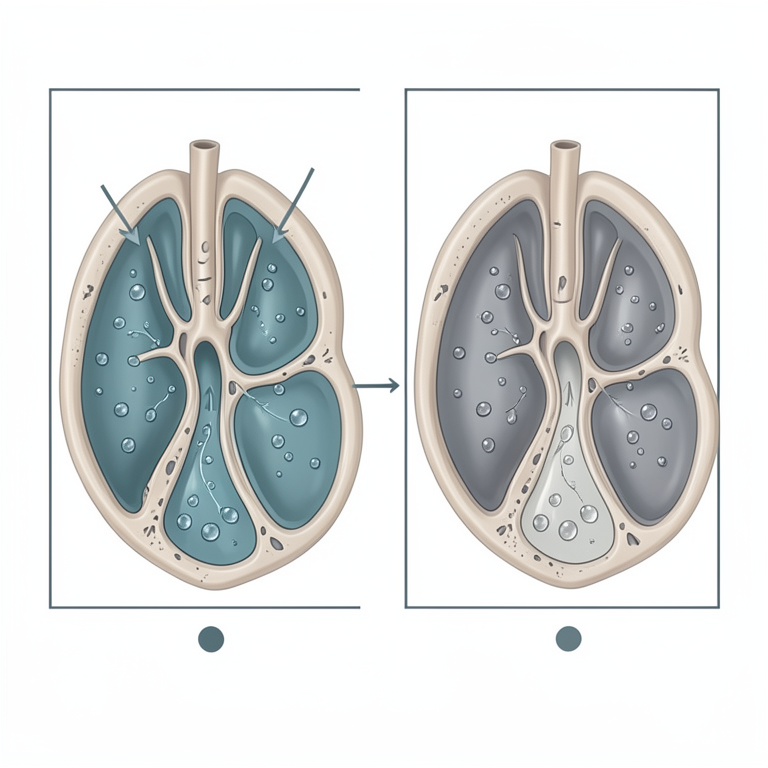
Renal Mode Switching
AI-generated conceptual illustration (Tilapia fish kidney tissue). It explains the idea and does not show study data.
View source evidence ↗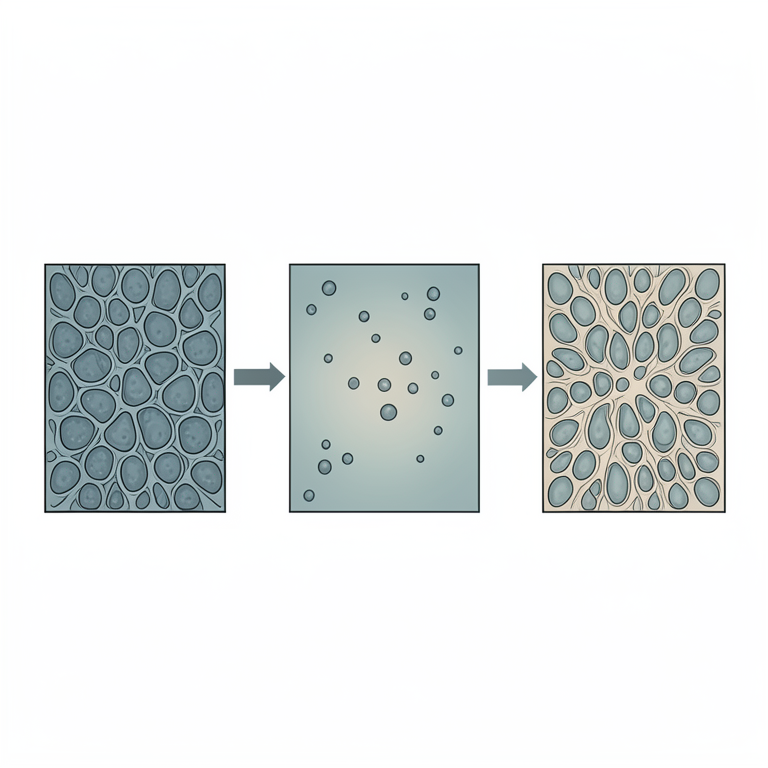
Expression Timeline Gap
AI-generated conceptual illustration (euryhaline fish kidney tissue). It explains the idea and does not show study data.
View source evidence ↗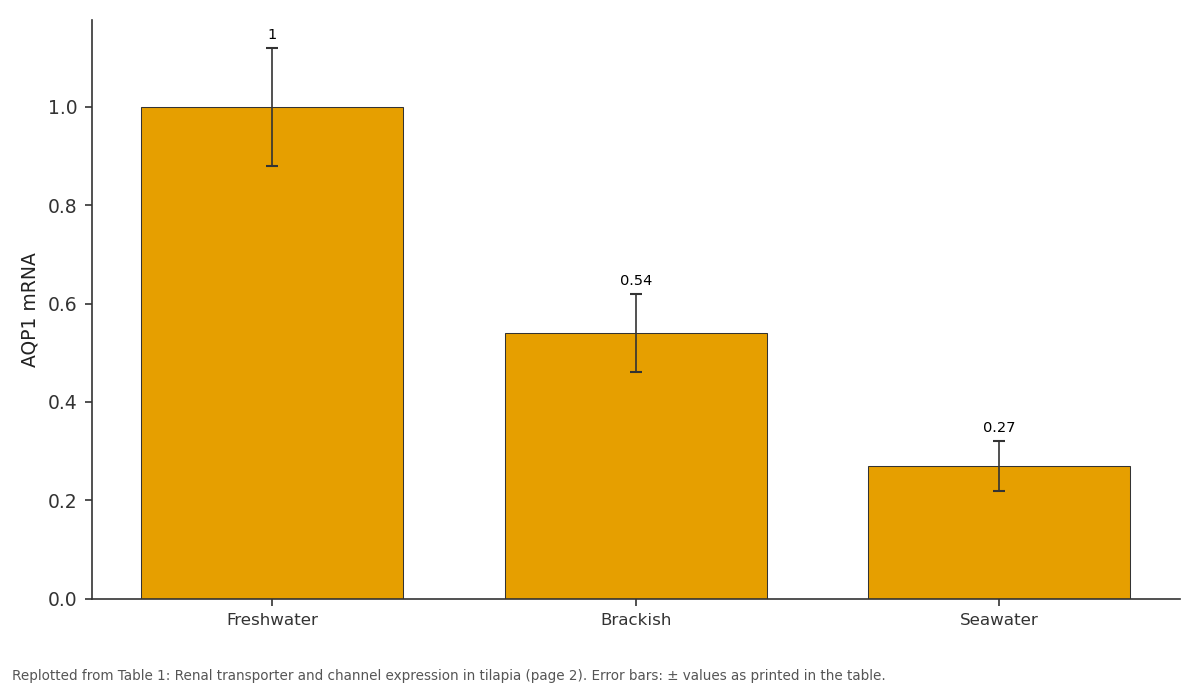
AQP1 mRNA: Freshwater vs Brackish vs Seawater
Replotted from Table 1 (page 2) of the original paper. Every bar is the paper's own table value.
View source evidence ↗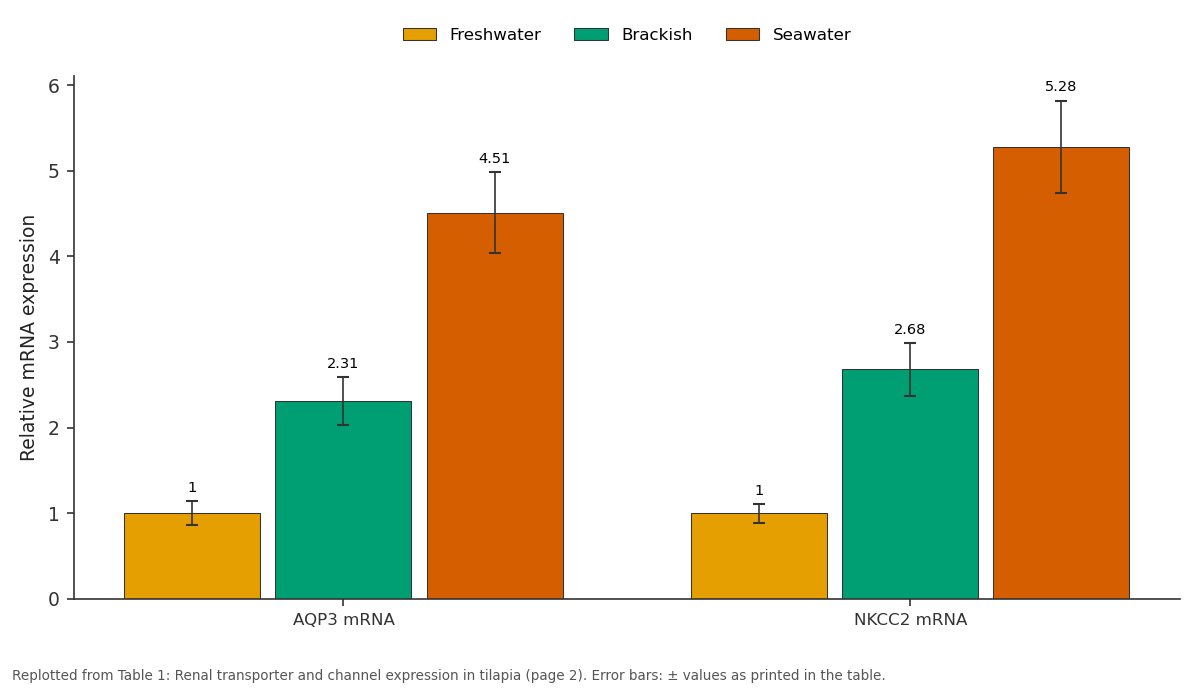
Freshwater and Brackish and more: AQP3 mRNA vs NKCC2 mRNA
Replotted from Table 1 (page 2) of the original paper. Every bar is the paper's own table value.
View source evidence ↗Figures & tables
From the original paper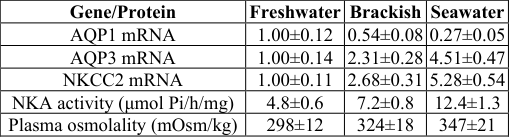 Table 1
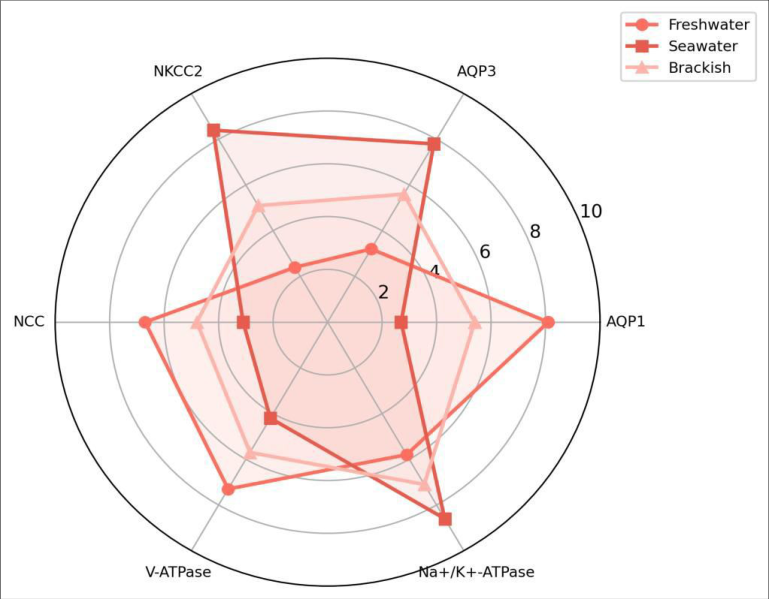 Figure 1
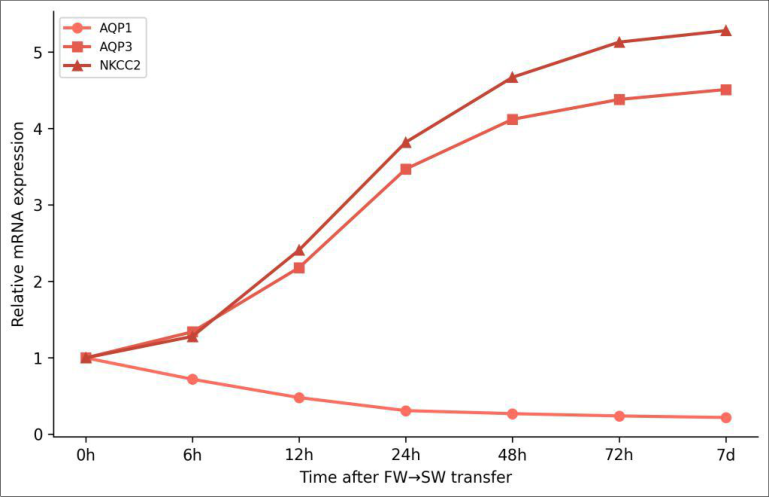 Figure 2
Introduction
Think of the kidney as a programmable water filter. In freshwater fish, the program runs "save water, dump ions" - the animal produces large volumes of dilute urine to compensate for osmotic water gain through the gills. In seawater fish, the program flips to "dump water, save ions" - urine volume drops and solute reabsorption increases to offset water loss to the hyperosmotic environment [1]. Euryhaline species like the Mozambique tilapia can switch between these programs within days, a feat that requires rapid remodeling of transporter and channel expression in the renal epithelium [2].
Aquaporins (AQPs) are the water channels that make this switching possible. At least 13 AQP isoforms have been identified in teleost fish, with AQP1 and AQP3 being the most abundant renal isoforms [3]. AQP1 facilitates transcellular water reabsorption in the proximal tubule and is expected to be high in FW fish, while AQP3, located on basolateral membranes of distal segments, may support water exit in SW-acclimated kidneys [4]. But the time course of AQP expression changes during salinity transfer, and how these changes coordinate with ion transporter remodeling, haven't been resolved in a single experiment.
This research tracked AQP1, AQP3, and key ion transporters (NKCC2, NCC, Na+/K+- ATPase, V-ATPase) in tilapia kidneys across three stable salinities and during acute FW-to- SW challenge at the Kandy College of Biological Sciences from March to October 2023.
Material And Methods
Material Seventy-two juvenile Mozambique tilapia (O. mossambicus, 15-20 g) were obtained from the National Aquaculture Development Authority of Sri Lanka. Fish were maintained in 200- liter recirculating tanks at 27±1°C with a 12:12 photoperiod. NAAS Rating: 4.82 IJBS 2025; 7(5): 185-188 Dilhani Karunaratne Department of Physiology, Kandy College of Biological Sciences, Kandy, Sri Lanka Chathurika Herath Department of Physiology, Kandy College of Biological Sciences, Kandy, Sri Lanka Dilhani Karunaratne Department of Physiology, Kandy College of Biological Sciences, Kandy, Sri Lanka https://www.biologyjournal.net ANOVA with Tukey post-hoc compared steady-state groups; repeated-measures ANOVA assessed transfer time- course data. All analyses in R 4.3.1.
Results
Table 1: Renal transporter and channel expression in tilapia acclimated to three salinities (fold change vs FW, mean ± SD, n = 8) Gene/Protein Freshwater Brackish Seawater AQP1 mRNA 1.00±0.12 0.54±0.08 0.27±0.05 AQP3 mRNA 1.00±0.14 2.31±0.28 4.51±0.47 NKCC2 mRNA 1.00±0.11 2.68±0.31 5.28±0.54 NKA activity (μmol Pi/h/mg) 4.8±0.6 7.2±0.8 12.4±1.3 Plasma osmolality (mOsm/kg) 298±12 324±18 347±21 AQP1 declined progressively from FW to SW while AQP3 and NKCC2 showed the inverse pattern (Table 1). Na+/K+- ATPase activity rose 2.6-fold in SW kidneys, reflecting the increased energetic demand of ion secretion. Plasma osmolality was maintained within a relatively narrow range (298-347 mOsm/kg) despite the 35-fold difference in external salinity. For steady-state experiments, fish were acclimated to FW (0 ppt), BW (15 ppt, adjusted with Instant Ocean), or SW (35 ppt) for 14 days (n = 24 per group).
| Gene/Protein | Freshwater | Brackish | Seawater |
|---|---|---|---|
| AQP1 mRNA | 1.00±0.12 | 0.54±0.08 | 0.27±0.05 |
| AQP3 mRNA | 1.00±0.14 | 2.31±0.28 | 4.51±0.47 |
| NKCC2 mRNA | 1.00±0.11 | 2.68±0.31 | 5.28±0.54 |
| NKA activity (μmol Pi/h/mg) | 4.8±0.6 | 7.2±0.8 | 12.4±1.3 |
| Plasma osmolality (mOsm/kg) | 298±12 | 324±18 | 347±21 |
Table text extracted from the original PDF; superscript letters are shown inline. The original table image is below.
View original table image
For the transfer experiment, 24 FW-acclimated fish were moved directly to SW and sampled at 0, 6, 12, 24, 48, 72 hours and 7 days (n = 3-4 per time point). Kidneys were dissected, snap-frozen for molecular work or fixed in 4% PFA for immunohistochemistry. Ethics approval: Kandy College of Biological Sciences Animal Ethics Committee (Protocol KCBS-AEC-2023-004, February 2023).
Methods
Total RNA was extracted from kidney homogenates using TRIzol and reverse-transcribed with SuperScript IV. RT- qPCR was performed using SYBR Green with primers for AQP1, AQP3, NKCC2, NCC, Na+/K+-ATPase α1a, and V- ATPase B subunit; β-actin served as reference. Western blots used rabbit polyclonal antibodies against tilapia AQP1 and AQP3 (custom, validated by peptide blocking). Immunohistochemistry on 5 μm paraffin sections used the same antibodies with DAB visualization.
Plasma osmolality was measured by freezing-point depression (Fiske 210 osmometer). Kidney Na+/K+-ATPase activity was assayed by ouabain-sensitive phosphate liberation. One-way Fig 1: Radar chart comparing relative expression of six renal transporters and channels across freshwater, brackish, and seawater-acclimated tilapia kidneys https://www.biologyjournal.net Fig 2: Time course of AQP1, AQP3, and NKCC2 mRNA expression during acute freshwater-to-seawater transfer over 7 days The radar chart (Figure 1) illustrates the reciprocal transporter profiles: FW kidneys are dominated by AQP1 and V-ATPase (proton secretion for ion uptake), while SW kidneys shift toward AQP3, NKCC2, and Na+/K+-ATPase. During acute transfer (Figure 2), AQP1 downregulation was fastest (50% decline by 12h), while AQP3 and NKCC2 upregulation was slower, reaching steady-state SW levels by 72 hours.
Discussion
The reciprocal regulation of AQP1 and AQP3 in tilapia kidney confirms and extends earlier findings in European eel and killifish [5, 6]. The speed of AQP1 downregulation during transfer - detectable within 6 hours - suggests transcriptional repression rather than simple protein turnover, as AQP protein half-life in mammalian kidneys exceeds 24 hours [7]. This rapid response may be mediated by osmosensitive transcription factors that detect the change in tubular fluid osmolality almost immediately after salinity shift. The 12-24 hour lag between AQP1 loss and AQP3/NKCC2 gain creates a potential vulnerability window during which the kidney is transitioning between water-handling programs.
Fish may compensate by increasing gill-based ion excretion during this period, explaining the transient rise in gill Na+/K+-ATPase activity reported by others during salinity transfer [8]. From an aquaculture perspective, understanding this remodeling timeline matters for species that are routinely transferred between salinities during production - for instance, salmon smoltification or tilapia brackish-water culture. Minimizing stress during the 12-48 hour vulnerability window could improve survival and growth [9, osmoregulation. The 12-24 hour gap between AQP1 loss and AQP3/NKCC2 establishment during acute transfer identifies a physiological vulnerability window relevant to both wild fish encountering salinity changes and aquaculture species undergoing managed transfers [11, 12, 13].
Experimental
Biology. 2002;205(Pt 17):2643-2651. 6. Whitehead A, Roach JL, Zhang S, Galvez F. Salinity- and population-dependent genome regulatory response during osmotic acclimation in the killifish Fundulus heteroclitus. Journal of
Experimental
Biology. 2012;215(Pt 8):1293-1305. 7. Fenton RA, Moeller HB, Bhagat C, Bhagat D, Hoffert JD, Knepper MA. Acute regulation of aquaporin-2 phosphorylation at Ser-264 by vasopressin. Proceedings of the National Academy of Sciences. 2008;105(8):3134-3139. 10].
Conclusion
Tilapia kidneys deploy opposite aquaporin and ion transporter profiles in freshwater versus seawater, switching from a water-reabsorbing to a water-excreting mode. AQP1 dominates FW kidneys and declines rapidly during SW transfer, while AQP3 and NKCC2 rise to support SW https://www.biologyjournal.net 8. Hwang PP, Lee TH. New insights into fish ion regulation and mitochondrion-rich cells.
Comparative Biochemistry and Physiology Part A. 2007;148(3):479- 497. 9. Kültz D. Physiological mechanisms used by fish to cope with salinity stress. Journal of Experimental Biology. 2015;218(Pt 15):2440-2449. 10.
McCormick SD. Endocrine control of osmoregulation in teleost fish. American Zoologist. 2001;41(4):781- 794. 11. Giffard-Mena I, Boulo V, Aujoulat F, Bhagat C, Bhagat D, Charmantier G.
Aquaporin molecular characterization in the sea-bass (Dicentrarchus labrax): the effect of salinity on AQP1 and AQP3 expression. Comparative Biochemistry and Physiology Part A. 2007;148(2):430-444. 12. Tipsmark CK, Sørensen KJ, Madsen SS. Aquaporin expression dynamics in osmoregulatory tissues of Atlantic salmon during smoltification and seawater acclimation.
Journal of
Experimental
Biology. 2010;213(Pt 3):368-379. 13. Marshall WS, Grosell M. Ion transport, osmoregulation, and acid-base balance. In: Evans DH, Claiborne JB, eds.
The Physiology of Fishes. 3rd ed. Boca Raton: CRC Press; 2006:177-230. 14. Aoki M, Kaneko T, Bhagat C, Bhagat D, Shiraishi K. Intestinal water absorption through aquaporin 1 expressed in the apical membrane of mucosal epithelial cells in seawater-adapted Japanese eel.
Journal of
Experimental
Biology. 2003;206(Pt 19):3495-3505. 15. Lignot JH, Cutler CP, Bhagat C, Bhagat D, Cramb G, Charmantier G. Immunolocalization of aquaporin-3 in the gill and the gastrointestinal tract of the European eel. Journal of Experimental Biology. 2002;205(Pt 17):2653-2663. 16.
Watanabe S, Kaneko T, Aida K. Aquaporin-3 expressed in the basolateral membrane of gill chloride cells in Mozambique tilapia. American Journal of Physiology. 2005;289(5):R1520-R1529. 17. Hiroi J, McCormick SD.
New insights into gill ionocyte and ion transporter function in euryhaline and diadromous fish. Respiratory Physiology and Neurobiology. 2012;184(3):257-268. 18. Kaneko T, Watanabe S, Lee KM. Functional morphology of mitochondrion-rich cells in euryhaline and stenohaline teleosts.
Aqua-BioScience Monographs. 2008;1(1):1-62. 19. Tse WKF, Au DWT, Wong CKC. Characterization of ion channel and transporter mRNA expressions in isolated gill chloride and pavement cells of seawater acclimating eels. Biochemical and Biophysical Research Communications. 2006;346(4):1181-1190. 20.
Fiol DF, Kültz D. Osmotic stress sensing and signaling in fishes. FEBS Journal. 2007;274(22):5790-5798.
References
5 in the original paper- Evans DH, Piermarini PM, Choe KP. The multifunctional fish gill: dominant site of gas exchange, osmoregulation, acid-base regulation, and excretion of nitrogenous waste. Physiological Reviews. 2005;85(1):97-177.
- Brauer PR, Sanchez JA, Singh AK, Bhagat C, Bhagat D. Renal function in euryhaline and stenohaline fishes. In: Evans DH, ed. The Physiology of Fishes. Boca Raton: CRC Press; 2008:419-440.
- Cerdà J, Finn RN. Piscine aquaporins: an overview of recent advances. Journal of Experimental Zoology Part A. 2010;313A(10):623-642.
- Tingaud-Sequeira A, Calusinska M, Bhagat C, Bhagat D, Finn RN, Chauvigné F, Lozano J, Cerdà J. The zebrafish genome encodes the largest vertebrate repertoire of functional aquaporins with dual paralogy and substrate specificities similar to mammals. BMC Evolutionary Biology. 2010;10:38.
- Cutler CP, Cramb G. Branchial expression of an aquaporin 3 (AQP-3) homologue is downregulated in the European eel Anguilla anguilla following seawater acclimation. Journal of