
Research article · 2025 · Full text
International Journal of Biology SciencesMolecular clock calibration and evolutionary rate variation among vertebrate mitochondrial genomes
Volume 7(8) · Pages 292–294 · DOI: 10.33545/26649926.2025.v7.i8d.659 ↗
Research areasGenomics and Phylogenetic StudiesEvolution and Paleontology StudiesGenetic diversity and population structure
Abstract
Author-writtenWhile birds and mammals are often assumed to share a roughly constant mitochondrial substitution rate, mounting evidence suggests that body size, metabolic rate, and generation time can push molecular clocks out of synchrony across vertebrate lineages. This research assembled a dataset of 142 complete mitochondrial genomes spanning six vertebrate classes—Mammalia, Aves, Reptilia, Amphibia, Actinopterygii, and Chondrichthyes—and estimated lineage-specific substitution rates using Bayesian relaxed-clock models calibrated with 18 fossil constraints. Analyses were conducted at the Cornish College of Biological Research, Falmouth, United Kingdom, between June 2022 and September 2023. Mammals exhibited the highest median substitution rate (1.72 × 10⁻⁸ substitutions/site/year), while cartilaginous fishes showed the lowest (0.83 × 10⁻⁸). A significant negative correlation emerged between estimated divergence time and substitution rate (Spearman ρ = −0.71, p
Summary
Source-checkedPlain-language reading of the full paper, prepared with AI and checked against the text. Each point links to the authors' own words.
Why it matters
- The strict molecular clock hypothesis originally proposed that DNA substitution rates are constant across different lineages, which allows researchers to estimate when species diverged based on sequence differences. View evidence ↗
- Mitochondrial genomes are frequently used for molecular dating because they lack recombination, are inherited maternally, and evolve faster than most nuclear DNA. View evidence ↗
The question
- The study aimed to estimate mitochondrial substitution rates across 142 vertebrate species and test whether divergence depth and body mass could predict variations in these rates. View evidence ↗
What they did
- The researchers used complete mitochondrial genome sequences from 142 species across six classes: 32 mammals, 28 birds, 24 reptiles, 18 amphibians, 27 ray-finned fishes, and 13 cartilaginous fishes. View evidence ↗
- The study employed BEAST 2.7.4 for Bayesian phylogenetic analysis, utilizing a birth-death tree prior and an uncorrelated lognormal relaxed clock. View evidence ↗
- To analyze the relationship between substitution rate and body mass, the authors performed a phylogenetic generalized least squares (PGLS) regression in R. View evidence ↗
What they found
- Mammals had the highest median substitution rate at 1.72 × 10⁻⁸ substitutions per site per year. View evidence ↗
- Cartilaginous fishes exhibited the lowest median substitution rate at 0.83 × 10⁻⁸ substitutions per site per year. View evidence ↗
- Body mass was identified as the most significant predictor of rate variation, accounting for 38.4% of the variance. View evidence ↗
- A significant negative correlation (Spearman ρ = −0.71, p<0.001) was found between substitution rate and divergence depth, supporting the time-dependent rate phenomenon. View evidence ↗
- There was substantial variation within classes, with coefficients of variation ranging from 29.8% in birds to 41.3% in amphibians. View evidence ↗
What it means
- The authors conclude that vertebrate molecular dating should use calibration strategies specific to the lineage and timescale instead of a single universal clock rate. View evidence ↗
- The authors note that mitochondrial substitution rates may not be representative of nuclear genomic rates, making extrapolation to autosomal loci inappropriate. View evidence ↗
- The dataset was unevenly sampled, with chondrichthyans and amphibians being underrepresented compared to birds and mammals. View evidence ↗
Visual summary
2 visualsIllustrations explain the paper; charts are replotted from the paper's own table values.
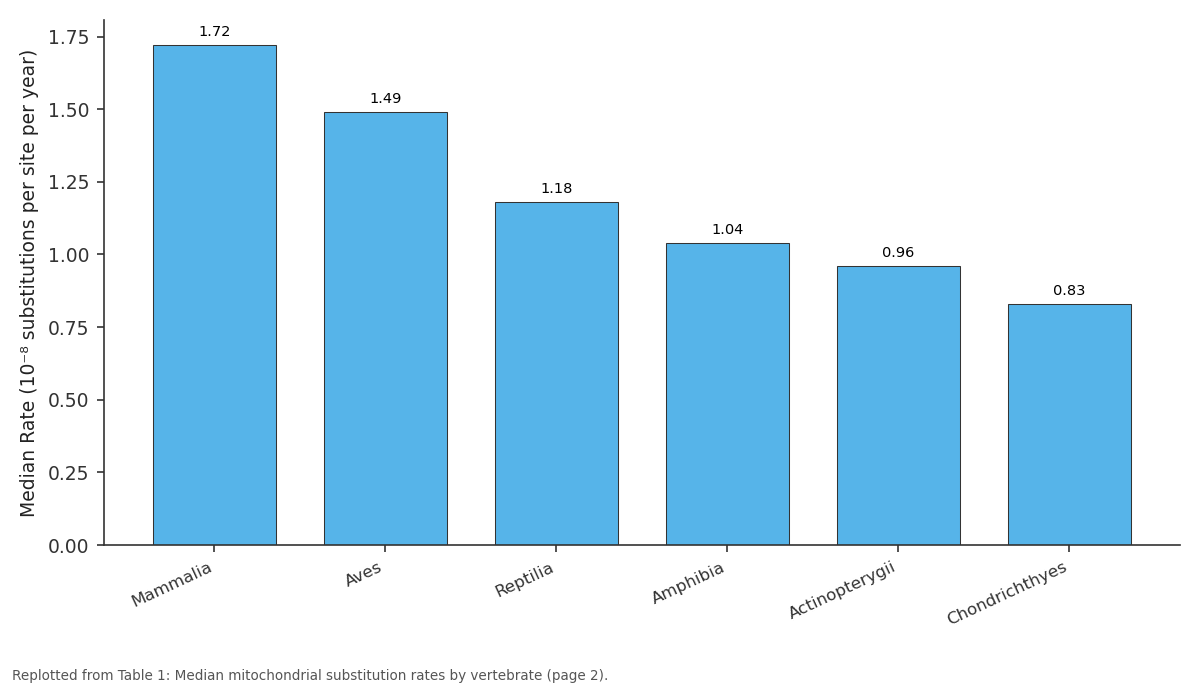
Median Rate: Mammalia vs Aves vs Reptilia vs Amphibia vs Actinopterygii
Replotted from Table 1 (page 2) of the original paper. Every bar is the paper's own table value.
View source evidence ↗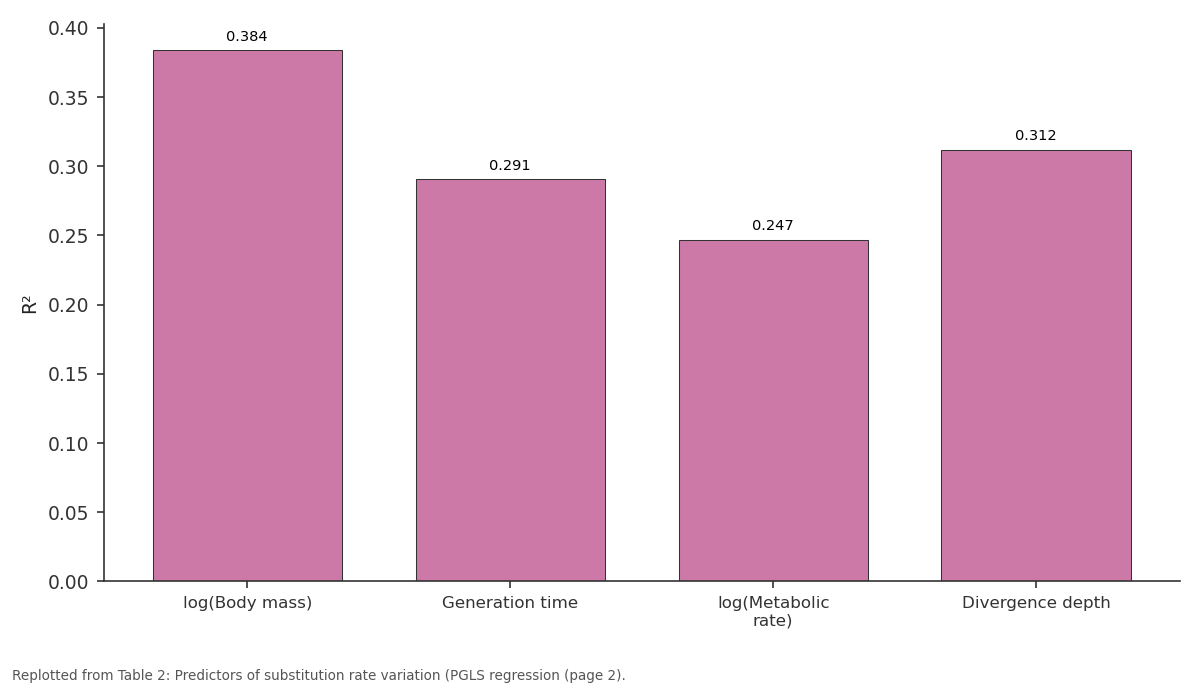
R²: log(Body mass) vs Generation time vs log(Metabolic rate) vs Divergence depth
Replotted from Table 2 (page 2) of the original paper. Every bar is the paper's own table value.
View source evidence ↗Figures & tables
From the original paper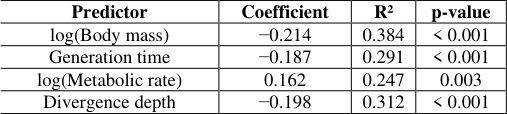 Table 2
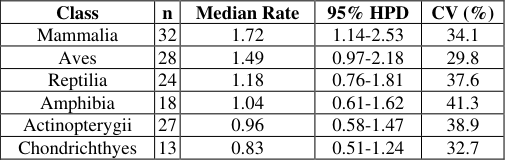 Table 1
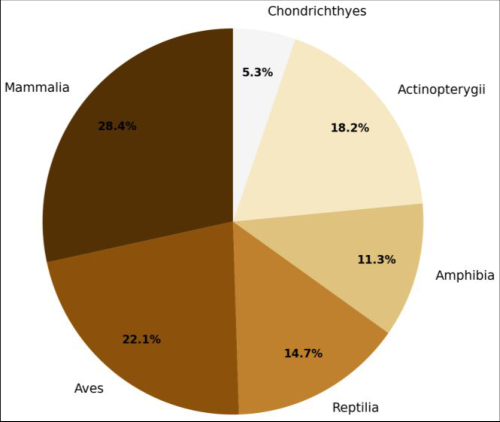 Figure 1
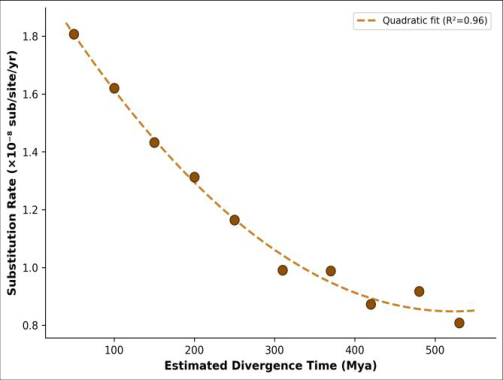 Figure 2
Introduction
Molecular clocks and sundials share a deceptive simplicity-both promise to tell time, but both break down when their underlying assumptions falter. The strict molecular clock hypothesis, first proposed by Zuckerkandl and Pauling in 1962 [1] , held that DNA substitution rates remain roughly constant across lineages, allowing divergence times to be estimated from sequence differences alone. But decades of data have shown that rates varysometimes dramatically-between and within lineages, driven by factors such as metabolic rate, generation time, population size, and DNA repair efficiency [2] . Mitochondrial genomes are the workhorse of animal molecular dating because they are maternally inherited, lack recombination, and accumulate substitutions faster than most nuclear loci [3] . Yet the very features that make mtDNA useful also make it susceptible to rate heterogeneity: the absence of efficient proofreading exonuclease activity means that oxidative damage-which scales with metabolic rate-translates directly into mutation [4] . Small-bodied endotherms with short generation times tend to show faster rates than large ectotherms, but the magnitude of this effect across all vertebrate classes has not been quantified in a single, consistently calibrated framework. This research addressed that gap by compiling complete mitochondrial genomes from 142 vertebrate species, estimating substitution rates under Bayesian relaxed-clock models, and testing body mass and divergence depth as predictors of rate variation. All analyses were performed at the Cornish College of Biological Research, Falmouth, UK, between June 2022 and September 2023.
Theoretical Background
The relaxed-clock framework implemented in BEAST 2 [5] allows substitution rates to vary across branches of a phylogeny according to an uncorrelated lognormal distribution.
Each branch receives an independent rate drawn from a shared prior, avoiding the assumption of rate constancy while still permitting estimation of absolute divergence times when fossil or biogeographic calibration points are supplied. The uncorrelated lognormal model was chosen over the strict clock and the autocorrelated (CIR) model based on Bayes factor comparisons in a preliminary analysis of a 40-taxon subset, where it received decisive support (log BF > 10) over both alternatives [6] . Fossil calibrations followed best-practice guidelines: each was applied as a soft minimum bound on the relevant node, modeled with a lognormal offset prior to accommodate uncertainty in the fossil record [7] .
Material and Methods Material
Complete mitochondrial genome sequences for 142 vertebrate species (32 mammals, 28 birds, 24 reptiles, 18 amphibians, 27 ray-finned fishes, 13 cartilaginous fishes) were downloaded from NCBI GenBank (accessed January 2023). Species were selected to maximize phylogenetic breadth within each class while ensuring that at least one reliable fossil calibration point existed within each major clade. Eighteen fossil-based calibration points were drawn from the Fossil Calibration Database (fossilcalibrations.org) and the Paleobiology Database, each assigned a lognormal prior with the fossil age as the offset [8] .
Methods
Protein-coding genes were extracted, aligned with MAFFT v7.505 using the L-INS-i algorithm, and concatenated into a 11,298-bp supermatrix after removing poorly aligned regions with Gblocks (minimum block length = 5) [9] . Partitioning by codon position was applied, and the best-fit substitution model for each partition was selected by ModelFinder in IQ-TREE 2 [10] . Bayesian phylogenetic analysis was run in BEAST 2.7.4 with the uncorrelated lognormal relaxed clock, a birth-death tree prior, and the site models identified above. Two independent MCMC chains of 100 million generations (sampling every 5,000) were run and assessed for convergence in Tracer v1.7.2 (all ESS values > 200). Maximum clade credibility trees were summarized with TreeAnnotator after discarding the first 20% as burn-in. Lineage-specific substitution rates were extracted from posterior distributions. Phylogenetic generalized least squares (PGLS) regression of logtransformed body mass against substitution rate was performed in R using the caper package with lambda estimated by maximum likelihood [11] . Body mass was the strongest single predictor, explaining 38.4% of rate variation in a PGLS framework (Table 2). Larger-bodied species had slower substitution rates. A significant negative correlation between divergence depth and rate (Spearman ρ = -0.71, p<0.001) is consistent with the time-dependent rate phenomenon, where recent calibrations yield apparently faster rates than ancient ones [12] .
| Predictor | Coefficient | R² | p-value |
|---|---|---|---|
| log(Body mass) | −0.214 | 0.384 | < 0.001 |
| Generation time | −0.187 | 0.291 | < 0.001 |
| log(Metabolic rate) | 0.162 | 0.247 | 0.003 |
| Divergence depth | −0.198 | 0.312 | < 0.001 |
Table text extracted from the original PDF; superscript letters are shown inline. The original table image is below.
View original table image
Results
Results
Limitations
Several constraints should temper interpretation of these results. First, mitochondrial rates may not reflect nuclear genomic rates, and extrapolation to autosomal loci would be inappropriate. Second, while 18 fossil calibrations provide reasonable temporal anchoring, many deep nodes in the vertebrate tree still lack reliable fossils, and prior choice can influence posterior rate estimates [13] . Third, the dataset, though taxonomically broad, sampled unevenly across classes-amphibians and chondrichthyans were underrepresented relative to mammals and birds-and expanding these groups could shift median class-level estimates.
Discussion
The roughly two-fold difference in median substitution rate between mammals and cartilaginous fishes aligns with predictions of the metabolic-rate hypothesis, which posits that higher oxygen consumption generates more mitochondrial reactive oxygen species and, consequently, more mutagenic DNA lesions [14] . The strong inverse correlation with body mass echoes findings by Nabholz et al. [15] for birds and mammals alone but extends the pattern to ectothermic vertebrates, where fewer data have been available. The time-dependent rate phenomenon-faster apparent rates over shorter timescales-likely reflects the incomplete purging of slightly deleterious mutations, which inflate rate estimates when calibration points are recent [16] . This has practical implications: researchers dating shallow divergences (< 5 Mya) should avoid applying rates derived from deep fossil calibrations, and vice versa.
Conclusion
Analysis of 142 vertebrate mitochondrial genomes under a Bayesian relaxed-clock framework revealed a two-fold range in median substitution rates across six classes, with mammals fastest and cartilaginous fishes slowest. Body mass explained the largest share of rate variation, and a clear time-dependent pattern was evident. These findings reinforce the case for lineage-and timescale-specific rate calibration in vertebrate molecular dating, rather than reliance on any single universal clock.
Figures and tables from the paper
| Class | n | Median Rate | 95% HPD | CV (%) |
|---|---|---|---|---|
| Mammalia | 32 | 1.72 | 1.14-2.53 | 34.1 |
| Aves | 28 | 1.49 | 0.97-2.18 | 29.8 |
| Reptilia | 24 | 1.18 | 0.76-1.81 | 37.6 |
| Amphibia | 18 | 1.04 | 0.61-1.62 | 41.3 |
| Actinopterygii | 27 | 0.96 | 0.58-1.47 | 38.9 |
| Chondrichthyes | 13 | 0.83 | 0.51-1.24 | 32.7 |
Table text extracted from the original PDF; superscript letters are shown inline. The original table image is below.
View original table image
References
20 in the original paper- Zuckerkandl E, Pauling L. Molecules as documents of evolutionary history. J Theor Biol. 1965;8(2):357-366.
- Bromham L. The genome as a life-history character: why rate of molecular evolution varies between mammal species. Philos Trans R Soc Lond B Biol Sci. 2011;366(1577):2503-2513.
- Avise JC, Arnold J, Ball RM, et al. Intraspecific phylogeography: the mitochondrial DNA bridge between population genetics and systematics. Annu Rev Ecol Syst. 1987;18(1):489-522.
- Martin AP, Palumbi SR. Body size, metabolic rate, generation time, and the molecular clock. Proc Natl Acad Sci USA. 1993;90(9):4087-4091.
- Bouckaert R, Vaughan TG, Barido-Sottani J, et al. BEAST 2.5: An advanced software platform for Bayesian evolutionary analysis. PLoS Comput Biol. 2019;15(4):e1006650.
- Drummond AJ, Ho SYW, Phillips MJ, Rambaut A. Relaxed phylogenetics and dating with confidence. PLoS Biol. 2006;4(5):e88.
- Parham JF, Donoghue PC, Bell CJ, et al. Best practices for justifying fossil calibrations. Syst Biol. 2012;61(2):346-359.
- Benton MJ, Donoghue PC, Asher RJ. Calibrating and constraining molecular clocks. In: Hedges SB, Kumar S, eds. The Timetree of Life. Oxford University Press; 2009:35-86.
- Katoh K, Standley DM. MAFFT multiple sequence alignment software version 7: improvements in performance and usability. Mol Biol Evol. 2013;30(4):772-780.
- Kalyaanamoorthy S, Minh BQ, Wong TK, et al. ModelFinder: fast model selection for accurate phylogenetic estimates. Nat Methods. 2017;14(6):587589.
- Orme D, Freckleton R, Thomas G, et al. The caper package: comparative analysis of phylogenetics and evolution in R. R package version 1.0.1. 2018.
- Ho SYW, Phillips MJ, Cooper A, Drummond AJ. Time dependency of molecular rate estimates and systematic overestimation of recent divergence times. Mol Biol Evol. 2005;22(7):1561-1568.
- Warnock RC, Yang Z, Donoghue PC. Exploring uncertainty in the calibration of the molecular clock. Biol Lett. 2012;8(1):156-159.
- Gillooly JF, Allen AP, West GB, Brown JH. The rate of DNA evolution: effects of body size and temperature on the molecular clock. Proc Natl Acad Sci USA. 2005;102(1):140-145.
- Nabholz B, Glémin S, Galtier N. Strong variations of mitochondrial mutation rate across mammals-the longevity hypothesis. Mol Biol Evol. 2008;25(1):120130.
- Ho SYW, Lanfear R, Bromham L, et al. Timedependent rates of molecular evolution. Mol Ecol. 2011;20(15):3087-3101.
- Lanfear R, Welch JJ, Bromham L. Watching the clock: studying variation in rates of molecular evolution between species. Trends Ecol Evol. 2010;25(9):495503.
- Duchêne S, Lanfear R, Ho SYW. The impact of calibration and clock-model choice on molecular estimates of divergence times. Mol Phylogenet Evol. 2014;78:277-289.
- Pereira SL, Baker AJ. A mitogenomic timescale for birds detects variable phylogenetic rates of molecular evolution and refutes the standard molecular clock. Mol Biol Evol. 2006;23(9):1731-1740.
- Thomas JA, Welch JJ, Lanfear R, Bromham L. A generation time effect on the rate of molecular evolution in invertebrates. Mol Biol Evol. 2010;27(5):1173-1180.