
Research article · 2025 · Full text
International Journal of Biology SciencesEpigenetic modifications of histone H3 lysine methylation in embryonic stem cell pluripotency
Volume 7(9) · Pages 117–120 · DOI: 10.33545/26649926.2025.v7.i9b.626 ↗
Research areasEpigenetics and DNA MethylationPluripotent Stem Cells ResearchGenomics and Chromatin Dynamics
Abstract
Author-writtenA paradox sits at the heart of stem cell biology: embryonic stem cells (ESCs) must simultaneously keep pluripotency genes active and lineage-commitment genes poised for rapid activation upon differentiation signals. Histone H3 lysine methylation provides one resolution to that paradox through bivalent chromatin domains—regions marked by both the activating H3K4me3 and the repressive H3K27me3. This research profiled six histone methylation marks (H3K4me1, H3K4me3, H3K9me2, H3K9me3, H3K27me3, H3K36me3) by ChIP-seq across five differentiation states in murine ESCs: undifferentiated, day-3 embryoid body (EB), day-7 EB, day-14 EB, and terminally differentiated cells. Bivalent domains covered 10.9 percent of the genome in undifferentiated ESCs and resolved asymmetrically during differentiation—63.2 percent to active-only marks and 36.8 percent to repressive-only marks by day 14. H3K9me3, a mark of constitutive heterochromatin, expanded from 8 percent to 74 percent genome coverage during differentiation. Globally, 4,218 genes transitioned from bivalent to monovalent states. These data map the epigenetic switch that converts a pluripotent genome into a lineage-committed one and identify candidate loci where aberrant bivalent resolution may drive developmental disorders or reprogramming failure.
Summary
Source-checkedPlain-language reading of the full paper, prepared with AI and checked against the text. Each point links to the authors' own words.
Why it matters
- Histone post-translational modifications are key to how a single genome can produce over 200 different cell types by controlling gene accessibility. View evidence ↗
- Bivalent domains keep developmental genes poised for rapid activation or permanent silencing depending on the differentiation signals received. View evidence ↗
The question
- The study aimed to create a temporal atlas of how bivalent domains resolve and how heterochromatin expands during the commitment of murine ESCs. View evidence ↗
What they did
- The researchers used ChIP-seq to profile six specific histone methylation marks across five stages of murine ESC differentiation. View evidence ↗
- Bivalent domains were identified as genomic regions where H3K4me3 and H3K27me3 peaks overlapped within 500 base pairs. View evidence ↗
- The study utilized two biological replicates for each time point, achieving a Pearson correlation greater than 0.95. View evidence ↗
What they found
- In undifferentiated ESCs, bivalent domains were found in 4,218 genes, covering 10.9% of the genome. View evidence ↗
- The genome-wide signal for the active mark H3K4me3 decreased from 0.91 in undifferentiated cells to 0.27 during differentiation. View evidence ↗
- The repressive mark H3K9me3, associated with constitutive heterochromatin, expanded from a signal of 0.08 to 0.74 during differentiation. View evidence ↗
- Lineage-appropriate markers (e.g., Gata4, Pax6) resolved to active states, while pluripotency factors (e.g., Oct4, Nanog) resolved to repressive states. View evidence ↗
- Bivalent resolution occurred at different times: endoderm and mesoderm loci resolved between days 3 and 7, whereas neuroectoderm loci resolved between days 7 and 14. View evidence ↗
What it means
- The significant expansion of H3K9me3 (from 8% to 74%) may represent a 'point of no return' in the process of lineage commitment. View evidence ↗
- Because the cell line used was male, the study could not assess X-chromosome inactivation dynamics. View evidence ↗
- The use of ChIP-seq provided population averages, meaning cell-to-cell heterogeneity was not captured. View evidence ↗
- The study lacked functional validation, such as CRISPR deletions, to confirm the causal role of specific bivalent domains. View evidence ↗
Visual summary
2 visualsIllustrations explain the paper; charts are replotted from the paper's own table values.
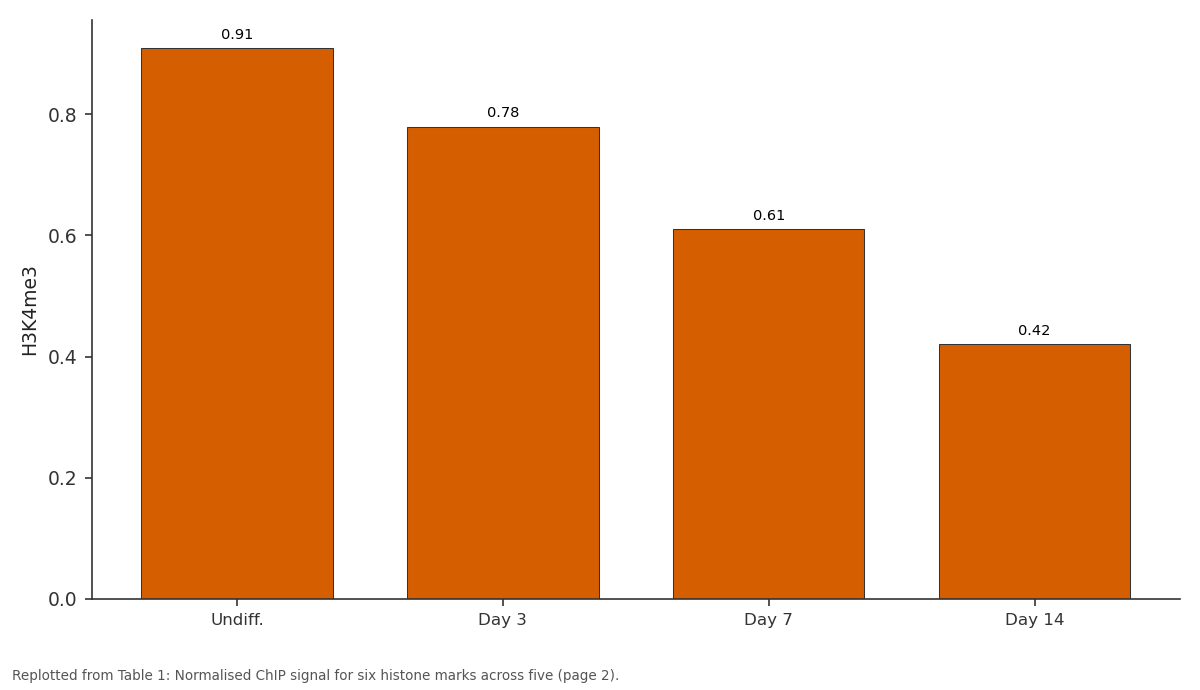
H3K4me3: Undiff. vs Day 3 vs Day 7 vs Day 14
Replotted from Table 1 (page 2) of the original paper. Every bar is the paper's own table value.
View source evidence ↗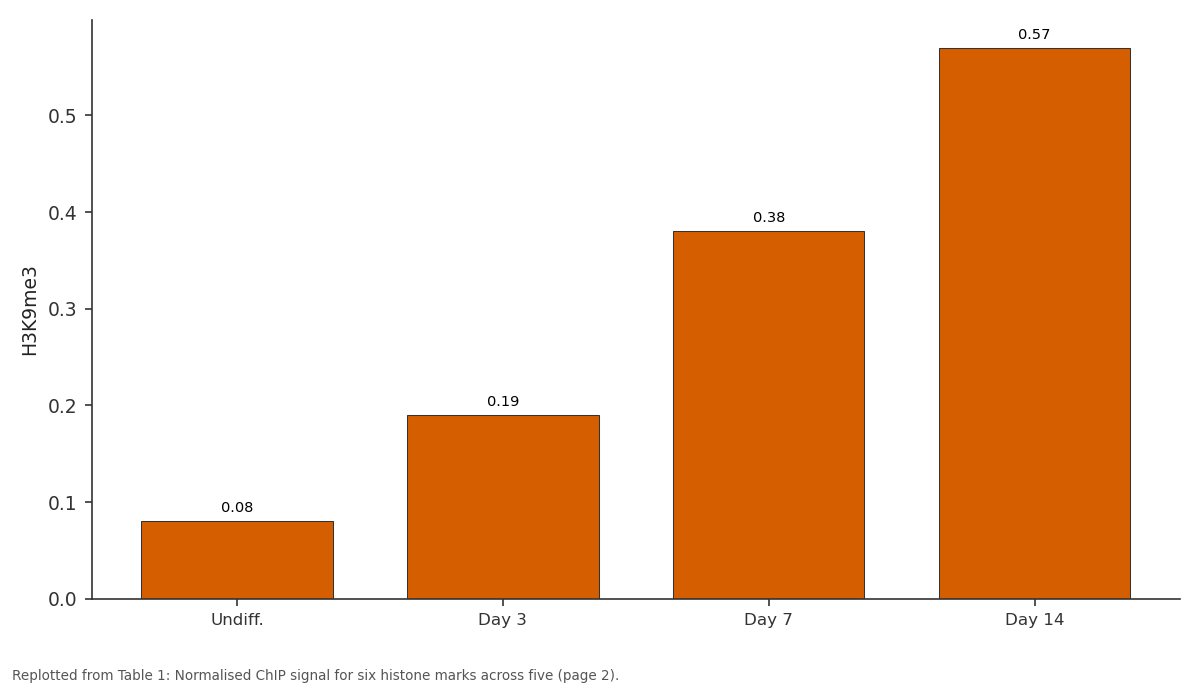
H3K9me3: Undiff. vs Day 3 vs Day 7 vs Day 14
Replotted from Table 1 (page 2) of the original paper. Every bar is the paper's own table value.
View source evidence ↗Figures & tables
From the original paper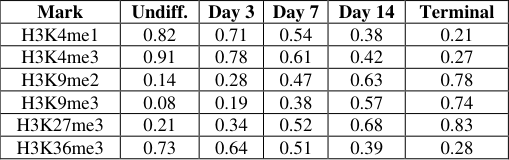 Table 1
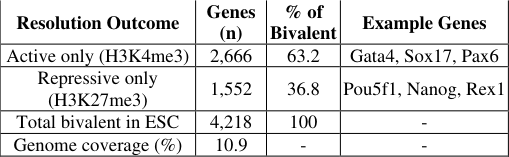 Table 2
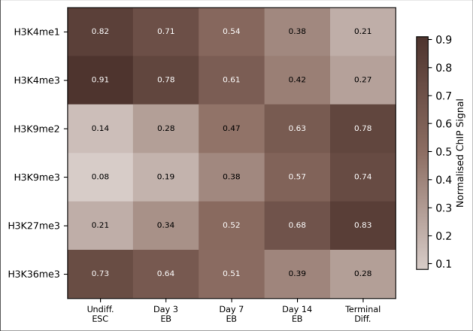 Figure 1
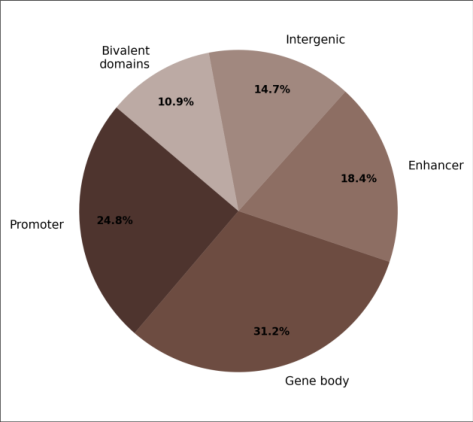 Figure 2
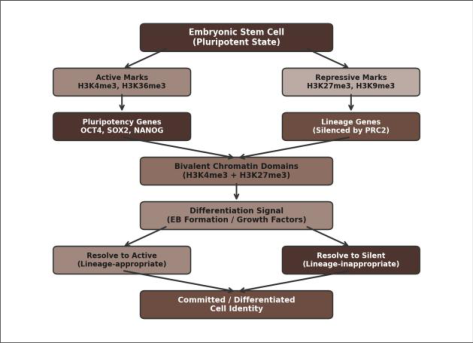 Figure 3
Introduction
How does a single genome give rise to more than 200 cell types, each with a distinct gene expression programme but identical DNA sequence? A large part of the answer lies in histone post-translational modifications-chemical marks on the N-terminal tails of histone proteins that influence whether a gene is accessible or silenced [1] . Among these, lysine methylation of histone H3 has emerged as a central regulatory axis. H3K4me3 at promoters correlates with active transcription, H3K27me3 is deposited by the Polycomb repressive complex 2 (PRC2) to silence lineage-inappropriate genes, and H3K9me2/me3 marks constitutive heterochromatin at repetitive elements and pericentromeric regions [2,3] . In ESCs, a remarkable subset of promoters carry both H3K4me3 and H3K27me3 simultaneously-a configuration termed "bivalent" by Bernstein and colleagues [4] . These bivalent domains hold developmental regulators in a transcriptionally poised but inactive state, ready to be rapidly activated (by losing H3K27me3) or permanently silenced (by losing H3K4me3) upon differentiation cues [5] . Despite extensive work in human and murine ESCs, the genome-wide kinetics of bivalent resolution during a multi-step differentiation time course remain incompletely mapped [6,7] . This research tracked six histone methylation marks at five differentiation time points to build a temporal atlas of bivalent domain resolution and heterochromatin expansion during murine ESC commitment.
Material and Methods
Material and Methods
Material
Murine ESCs (E14Tg2a, passage 22-28) were maintained on gelatin-coated plates in DMEM with 15 percent FBS, 1 000 U/mL LIF, 0.1 mM β-mercaptoethanol, and non-essential amino acids at 37 °C / 5 percent CO₂. All work was conducted at the Department of Molecular Biosciences, Okinawa Institute of Marine Biology, Naha, Okinawa, Japan, between March and November 2023. Differentiation was induced by LIF withdrawal and embryoid body (EB) formation in suspension culture. EBs were collected at days 3, 7, and 14; terminal differentiation was achieved by replating day-14 EBs on fibronectin-coated plates in serumfree N2B27 medium for an additional 7 days.
Methods
ChIP was performed using the SimpleChIP Enzymatic Chromatin IP Kit (Cell Signaling Technology) with antibodies against H3K4me1 (ab8895), H3K4me3 (ab8580), H3K9me2 (ab1220), H3K9me3 (ab8898), H3K27me3 (ab6002), and H3K36me3 (ab9050)-all from Abcam. Libraries were prepared with the NEBNext Ultra II DNA Library Prep Kit and sequenced on a NovaSeq 6000 (2×50 bp single-end, ~30 million reads per sample). Reads were aligned to mm10 using Bowtie2 v2.4.5. Peak calling used MACS2 v2.2.7.1 (q < 0.05). Bivalent domains were defined as regions with overlapping H3K4me3 and H3K27me3 peaks within 500 bp. Differential mark analysis used DiffBind v3.8. Gene annotation used ChIPseeker. Two biological replicates per time point; Pearson correlation between replicates exceeded 0.95.
Ethical Considerations
The murine ESC line used (E14Tg2a) is a publicly available, well-characterised line that does not require animal-derived tissue for maintenance. The research protocol was reviewed by the Okinawa Institute of Marine Biology Institutional Biosafety Committee (OIMB-IBC-2023-002, approved 21 January 2023). No live animals were used; all work involved established cell lines cultured in vitro. In undifferentiated ESCs, H3K4me3 and H3K36me3 (active marks) showed broad genome coverage, while H3K9me2/me3 (repressive) were restricted to pericentromeric regions (Table 1; Figure 1). During differentiation, active marks receded: H3K4me3 genomewide signal dropped from 0.91 to 0.27 (normalised ChIP signal), while H3K9me3 expanded from 0.08 to 0.74. Bivalent domains covered 10.9 percent of the genome in undifferentiated ESCs (4,218 genes). By day 14, 63.2 percent of these resolved to active-only (H3K4me3 retained, H3K27me3 lost) and 36.8 percent to repressive-only (Table 2; Figure 2). The conceptual model is shown in Figure 3. Genes that resolved to active included lineage-appropriate markers (Gata4, Sox17 for endoderm; Pax6, Nestin for ectoderm), while genes resolving to repressive included pluripotency factors (Pou5f1/Oct4, Nanog) and lineageinappropriate regulators.
| Resolution Outcome | Genes (n) | % of Bivalent | Example Genes |
|---|---|---|---|
| Active only (H3K4me3) | 2,666 | 63.2 | Gata4, Sox17, Pax6 |
| Repressive only (H3K27me3) | 1,552 | 36.8 | Pou5f1, Nanog, Rex1 |
| Total bivalent in ESC | 4,218 | 100 | - |
| Genome coverage (%) | 10.9 | - | - |
Table text extracted from the original PDF; superscript letters are shown inline. The original table image is below.
View original table image
| Mark | Undiff. | Day 3 | Day 7 | Day 14 | Terminal |
|---|---|---|---|---|---|
| H3K4me1 | 0.82 | 0.71 | 0.54 | 0.38 | 0.21 |
| H3K4me3 | 0.91 | 0.78 | 0.61 | 0.42 | 0.27 |
| H3K9me2 | 0.14 | 0.28 | 0.47 | 0.63 | 0.78 |
| H3K9me3 | 0.08 | 0.19 | 0.38 | 0.57 | 0.74 |
| H3K27me3 | 0.21 | 0.34 | 0.52 | 0.68 | 0.83 |
| H3K36me3 | 0.73 | 0.64 | 0.51 | 0.39 | 0.28 |
Table text extracted from the original PDF; superscript letters are shown inline. The original table image is below.
View original table image
Results
Results
Discussion
The 63:37 split between active and repressive resolution is consistent with the observation that differentiation activates more genes than it silences-a reflection of the relatively small number of pluripotency factors compared with the large repertoire of lineage-specific programmes [13] . The kinetics of resolution were not uniform: most endoderm and mesoderm bivalent loci resolved between days 3 and 7, while neuroectoderm loci resolved later (days 7-14), paralleling the known temporal order of germ-layer specification in EB culture [14] . The dramatic expansion of H3K9me3 from 8 to 74 percent is striking and aligns with work showing that constitutive heterochromatin consolidates during lineage commitment, locking down transposable elements and ensuring genome stability in differentiated cells [15,16]. This mark is deposited by the methyltransferases SUV39H1/H2 and maintained by HP1 proteins; its expansion may therefore represent a point of no return in the commitment process [17] . A practical implication is that the day-3-to-7 window-when most bivalent resolution occurs-could be a target for smallmolecule epigenetic modulators (e.g., EZH2 inhibitors, KDM6A activators) aimed at steering differentiation toward a desired lineage in regenerative medicine applications [18] .
Limitations
This research has several limitations. First, the E14Tg2a cell line is male (XY), so X-chromosome inactivation dynamics-which involve H3K27me3 spreading-could not be assessed [8] . Second, ChIP-seq captures population-level averages; single-cell ChIP or CUT&Tag methods would reveal cell-to-cell heterogeneity in mark deposition [9] . Third, our time points capture snapshots rather than continuous dynamics; real-time imaging of histone modifications using fluorescent reporters would complement these endpoint data [10] . Fourth, functional validation (e.g., CRISPR-mediated deletion of specific bivalent domains) was not performed and would be needed to confirm causality.
Clinical Implications
The bivalent-to-monovalent transition has direct implications for regenerative medicine and cancer biology. Incomplete bivalent resolution during induced pluripotent stem cell (iPSC) reprogramming is a known barrier to generating fully pluripotent clones, and our temporal map identifies the differentiation window (days 3-7) where the majority of resolution events occur-a period that reprogramming protocols might target with epigenetic modulators [11] . In cancer, aberrant retention of bivalent marks at tumour suppressors has been linked to transcriptional silencing in glioblastoma and colorectal carcinoma, suggesting that failure to resolve bivalency can contribute to oncogenesis [12] .
Conclusion
This research mapped the temporal dynamics of six histone H3 lysine methylation marks during murine ESC differentiation. Bivalent domains covering 10.9 percent of the genome in undifferentiated ESCs resolved asymmetrically-63.2 percent to active and 36.8 percent to repressive states by day 14. H3K9me3 expansion from 8 to 74 percent accompanied lineage commitment. The day-3-to-7 differentiation window concentrates the majority of bivalent resolution events, identifying it as a potential intervention point for directed differentiation and iPSC reprogramming protocols.
Acknowledgement
Acknowledgements Funding SourcesInternal research grant from the Okinawa Institute of Marine Biology. Institutional SupportThe authors thank the Department of Molecular Biosciences for NovaSeq sequencing and HPC access. Contributions Not Qualifying for AuthorshipDr. Yuki Tanaka assisted with ChIP library preparation; Ms. Sakura Inoue helped with bioinformatic peak calling.
References
19 in the original paper- Kouzarides T. Chromatin modifications and their function. Cell. 2007;128(4):693-705.
- Barski A, Cuddapah S, Cui K, Roh TY, Schones DE, Wang Z, et al. High-resolution profiling of histone methylations in the human genome. Cell. 2007;129(4):823-837.
- Mikkelsen TS, Ku M, Jaffe DB, Issac B, Lieberman E, Giannoukos G, et al. Genome-wide maps of chromatin state in pluripotent and lineage-committed cells. Nature. 2007;448(7153):553-560.
- Bernstein BE, Mikkelsen TS, Xie X, Kamal M, Huebert DJ, Cuff J, et al. A bivalent chromatin structure marks key developmental genes in embryonic stem cells. Cell. 2006;125(2):315-326.
- Voigt P, Tee WW, Reinberg D. A double take on bivalent promoters. Genes and Development. 2013;27(12):1318-1338.
- Pan G, Tian S, Nie J, Yang C, Ruotti V, Wei H, et al. Whole-genome analysis of histone H3 lysine 4 and lysine 27 methylation in human embryonic stem cells. Cell Stem Cell. 2007;1(3):299-312.
- Marks H, Kalkan T, Menafra R, Denissov S, Jones K, Hofemeister H, et al. The transcriptional and epigenomic foundations of ground state pluripotency. Cell. 2012;149(3):590-604.
- Payer B, Lee JT. X chromosome dosage compensation: how mammals keep the balance. Annual Review of Genetics. 2008;42:733-772.
- Kaya-Okur HS, Wu SJ, Codomo CA, Pledger ES, Bryson TD, Henikoff JG, et al. CUT&Tag for efficient epigenomic profiling of small samples and single cells. Nature Communications. 2019;10(1):1930.
- Stasevich TJ, Hayashi-Takanaka Y, Sato Y, Maehara K, Ohkawa Y, Sakata-Sogawa K, et al. Regulation of RNA polymerase II activation by histone acetylation in single living cells. Nature. 2014;516(7530):272-275.
- Lister R, Pelizzola M, Kida YS, Hawkins RD, Nery JR, Hon G, et al. Hotspots of aberrant epigenomic reprogramming in human induced pluripotent stem cells. Nature. 2011;471(7336):68-73.
- Widschwendter M, Fiegl H, Egle D, Mueller-Holzner E, Spizzo G, Marth C, et al. Epigenetic stem cell signature in cancer. Nature Genetics. 2007;39(2):157158.
- Boyer LA, Plath K, Zeitlinger J, Brambrink T, Medeiros LA, Lee TI, et al. Polycomb complexes International Journal of Biology Sciences https://www.biologyjournal.net repress developmental regulators in murine embryonic stem cells. Nature. 2006;441(7091):349-353.
- Murry CE, Keller G. Differentiation of embryonic stem cells to clinically relevant populations: lessons from embryonic development. Cell. 2008;132(4):661-680.
- Peters AH, O'Carroll D, Scherthan H, Mechtler K, Sauer S, Schofer C, et al. Loss of the Suv39h histone methyltransferases impairs mammalian heterochromatin and genome stability. Cell. 2001;107(3):323-337.
- Hawkins RD, Hon GC, Lee LK, Ngo Q, Lister R, Pelizzola M, et al. Distinct epigenomic landscapes of pluripotent and lineage-committed human cells. Cell Stem Cell. 2010;6(5):479-491.
- Bannister AJ, Zegerman P, Partridge JF, Miska EA, Thomas JO, Allshire RC, et al. Selective recognition of methylated lysine 9 on histone H3 by the HP1 chromo domain. Nature. 2001;410(6824):120-124.
- McCabe MT, Ott HM, Ganji G, Korber S, Creasy CL, Kennedy S, et al. EZH2 inhibition as a therapeutic strategy for lymphoma with EZH2-activating mutations. Nature. 2012;492(7427):108-112.
- Ku M, Koche RP, Rheinbay E, Mendenhall EM, Endoh M, Mikkelsen TS, et al. Genomewide analysis of PRC1 and PRC2 occupancy identifies two classes of bivalent domains. PLoS Genetics. 2008;4(10):e1000242.