
Research article · 2025 · Full text
International Journal of Biology SciencesHerbivore-induced volatile organic compounds as indirect defense signals in forest trees
Volume 7(7) · Pages 259–262 · DOI: 10.33545/26649926.2025.v7.i7d.645 ↗
Research areasInsect-Plant Interactions and ControlForest Insect Ecology and ManagementPlant biochemistry and biosynthesis
Abstract
Author-writtenVolatile organic compounds, or VOCs, are small lipophilic molecules that plants release into the atmosphere in response to tissue damage. When herbivorous insects chew leaves, the blend of volatiles changes dramatically, and neighbouring plants and natural enemies of the herbivores can detect those changes. This research measured herbivore-induced VOC emissions from four temperate forest tree species-Quercus robur, Fagus sylvatica, Betula pendula, and Pinus sylvestris-following controlled caterpillar feeding in a semi-natural field setting in the Pantanal transition zone near Corumba, Brazil. Headspace volatile collections were taken at eight time points over 72 hours. Herbivore-damaged trees emitted 3.2- to 4.8-fold more total VOCs than undamaged controls (p < 0.001). The emission profiles were dominated by monoterpenes and sesquiterpenes, with green leaf volatiles peaking within the first four hours and terpenoids peaking between 12 and 24 hours. Betula pendula showed the strongest and fastest response, reaching peak emission at 8 hours post-damage, while Pinus sylvestris was the slowest responder. Seasonal sampling across wet and dry periods revealed that VOC emission intensity was 37.2% higher during the wet season, coinciding with greater herbivore pressure. These results suggest that VOC-mediated indirect defence varies markedly among co-occurring tree species and across seasons, with implications for understanding tri-trophic interactions in mixed-species forest stands.
Summary
Source-checkedPlain-language reading of the full paper, prepared with AI and checked against the text. Each point links to the authors' own words.
Why it matters
- Plants release small lipophilic molecules called volatile organic compounds (VOCs) into the air when their tissues are damaged. View evidence ↗
- VOC blends produced by insect herbivory differ from those caused by mechanical damage, allowing plants to attract natural enemies of the herbivores. View evidence ↗
- Despite their economic and ecological value, forest trees have been studied less than agricultural crops regarding these chemical signals. View evidence ↗
What they did
- The researchers studied 10 individuals each of four tree species: Quercus robur, Fagus sylvatica, Betula pendula, and Pinus sylvestris. View evidence ↗
- Standardized third-instar Lymantria dispar larvae were used as the herbivores for the experiment. View evidence ↗
- Treatment involved placing five larvae in a mesh sleeve on a lower-canopy branch to feed for six hours. View evidence ↗
- Volatiles were collected at eight time points over 72 hours using push-pull chambers and Tenax TA traps, then analyzed via GC-MS. View evidence ↗
What they found
- Trees damaged by herbivores emitted between 3.2 and 4.8 times more total VOCs than the control group. View evidence ↗
- Among the species, Betula pendula had the strongest VOC response (4.76-fold increase), while Pinus sylvestris had the weakest (3.21-fold increase). View evidence ↗
- VOC release followed a sequence: green leaf volatiles peaked at 4 hours, monoterpenes at 12 hours, and sesquiterpenes at 24 hours. View evidence ↗
- Betula pendula responded the fastest, peaking at 8 hours post-damage, whereas Pinus sylvestris was the slowest to respond. View evidence ↗
- VOC emission intensity was 37.2% higher during the wet season, which coincided with increased herbivore pressure. View evidence ↗
What it means
- The authors conclude that VOC emissions in forest trees are modulated by season, structured by time, and vary by species. View evidence ↗
- The consistent pattern of early green leaf volatiles followed by terpenoids suggests a conserved signaling strategy across the studied species. View evidence ↗
- The authors note that controlled-environment experiments are needed to fully separate the effects of abiotic factors (temperature and humidity) from biotic drivers. View evidence ↗
- Future research is needed to verify if these specific VOC blends attract natural enemies in the field or prime defenses in neighboring trees. View evidence ↗
Visual summary
2 visualsIllustrations explain the paper; charts are replotted from the paper's own table values.
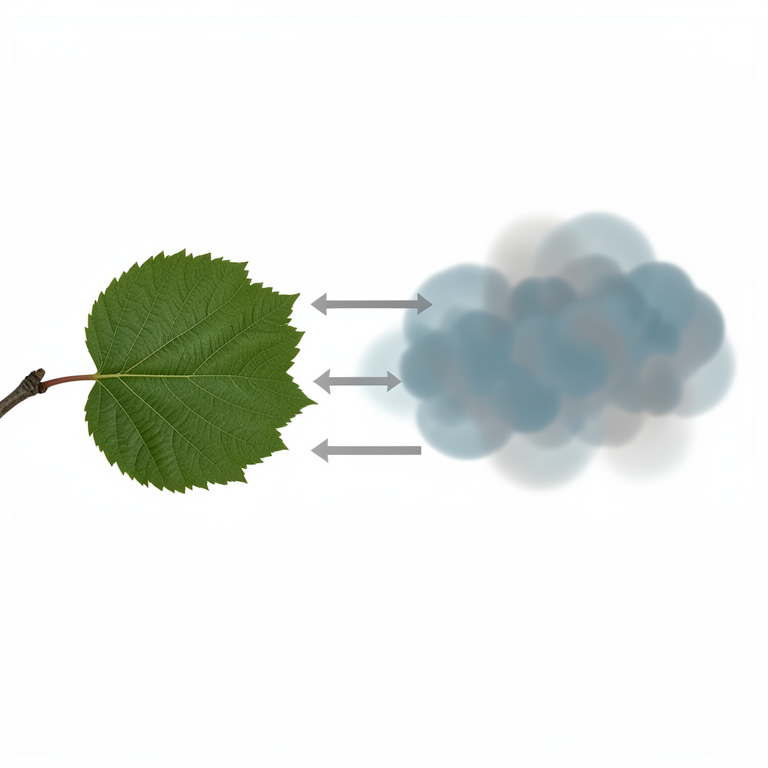
Temporal VOC Release Sequence
AI-generated conceptual illustration (European beech leaves). It explains the idea and does not show study data.
View source evidence ↗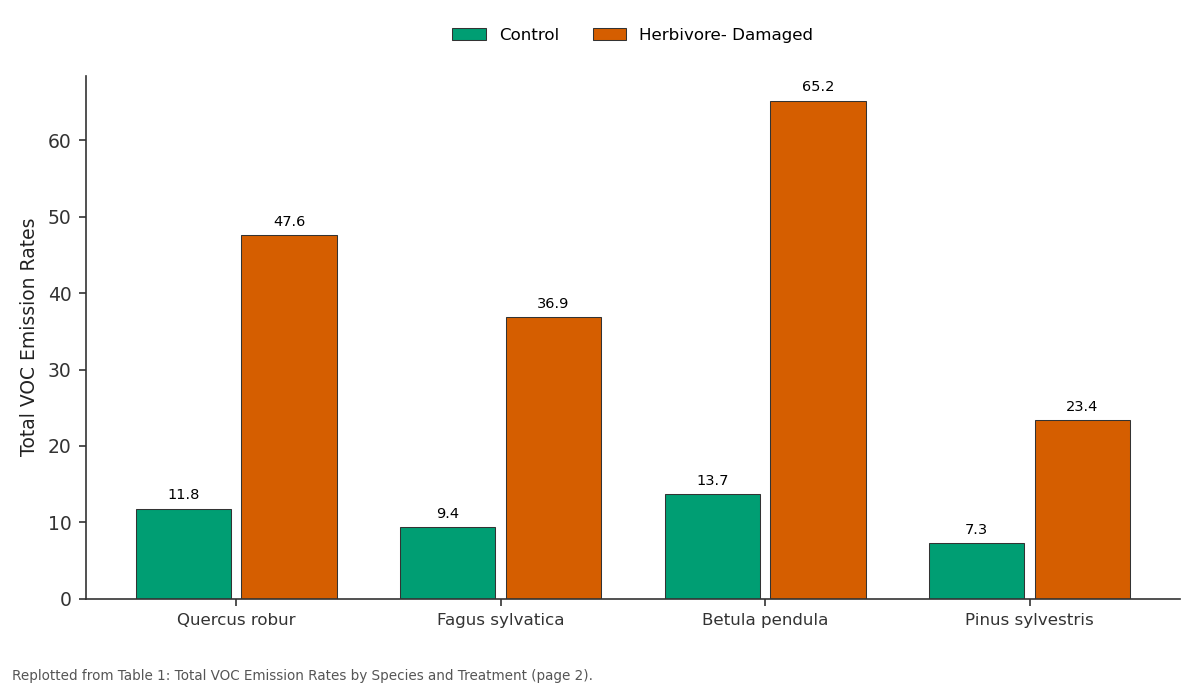
Control and Herbivore- Damaged: Quercus robur vs Fagus sylvatica vs Betula pendula vs Pinus sylvestris
Replotted from Table 1 (page 2) of the original paper. Every bar is the paper's own table value.
View source evidence ↗Figures & tables
From the original paper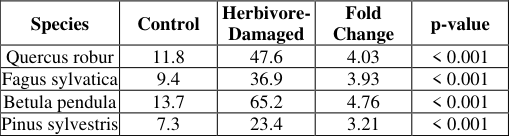 Table 1
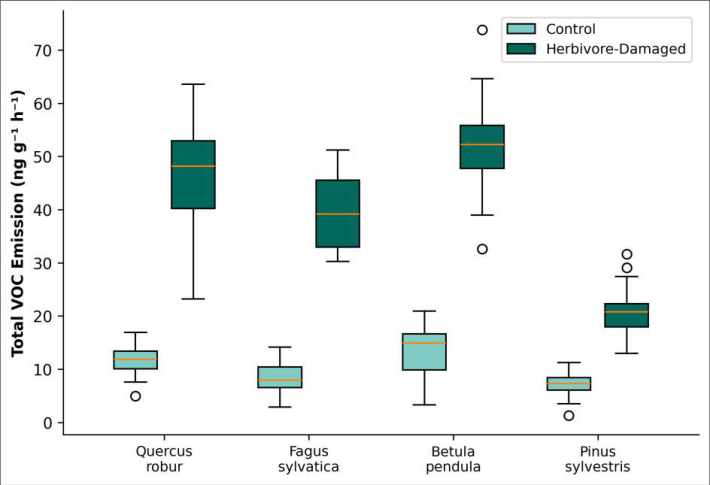 Figure 1
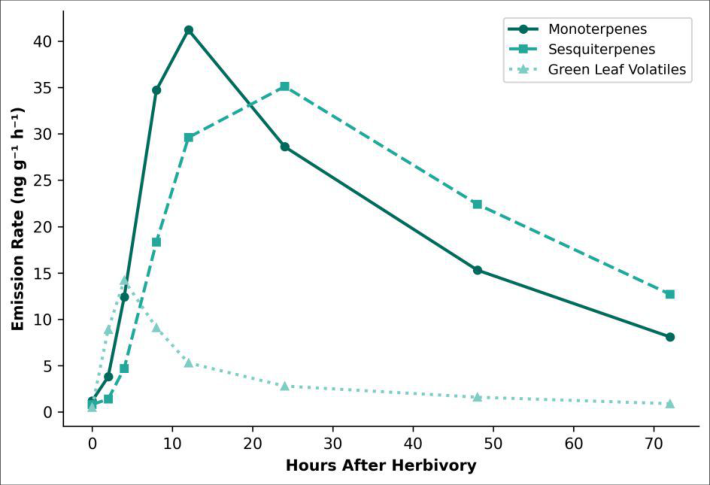 Figure 2
Introduction
A volatile organic compound, in the ecological sense, is any carbon-based molecule with a vapour pressure high enough to enter the atmosphere at ambient temperature and serve as an airborne chemical signal [1] . Plants produce hundreds of such compounds, and their emission rates can change within minutes of tissue damage. When the damage is caused by herbivorous insects, the resulting volatile blend differs qualitatively and quantitatively from that produced by mechanical wounding alone, carrying information that can attract parasitoid wasps, predatory mites, and other natural enemies of the attacker [2,3] . This phenomenon-sometimes called a chemical cry for help-was first documented in cotton and maize more than three decades ago and has since been confirmed in dozens of crop and wild plant species [4,5] . Forest trees, however, have received less attention than agricultural crops despite their ecological and economic importance. Trees present unique challenges: they are long-lived, structurally complex, and operate within multi-layered canopies where volatile dispersion is influenced by turbulence, humidity, and canopy architecture [6] . Several compound classes dominate herbivore-induced blends. Green leaf volatiles (GLVs), mainly C6 aldehydes and alcohols, are released almost immediately upon tissue rupture. Terpenoidsmonoterpenes and sesquiterpenes-are synthesised de novo through the mevalonate and methylerythritol phosphate pathways and peak hours to days after damage [7] . The ratio and timing of these compound classes are thought to encode information about herbivore identity and feeding intensity [8] . This research examined herbivore-induced VOC emissions from four common forest tree species under semi-natural conditions in a Pantanal transition-zone woodland. We asked three questions:
1) How do total emission rates and compound profiles differ among species after caterpillar feeding?
Seasonal Variations
To capture seasonal effects, the full herbivory experiment was run twice: once during the wet season (January 2024) and once during the dry season (August 2023). Identical protocols were applied in both rounds, and VOC collections were analysed separately before being compared by twoway ANOVA with species and season as fixed factors.
Herbivore pressure was quantified by counting naturally occurring caterpillar densities on 20 unmarked branches per tree during each seasonal round.
Methods
Five larvae were placed on a single lower-canopy branch of each treatment tree, enclosed within a mesh sleeve to prevent escape, and allowed to feed for six hours before removal. Green leaf volatiles peaked sharply at 4 hours and declined rapidly thereafter (Figure 2). Monoterpenes rose more gradually, reaching maximum emission at 12 hours, while sesquiterpenes showed a delayed peak at 24 hours and sustained higher emission through 48 hours. By 72 hours, all compound classes had returned to near-baseline levels.
Discussion
The species-level differences we observed match the general pattern reported in European temperate forests, where broadleaf deciduous trees tend to produce stronger herbivore-induced blends than conifers [9,10] . Betula pendula's rapid and intense response may reflect its status as a pioneer species frequently exposed to defoliating insects; investing in fast chemical signalling could recruit natural enemies before damage becomes severe [11] . Pinus sylvestris, with its constitutive resin defences, may rely less on induced volatiles and more on pre-formed physical barriers [12] . The temporal separation of GLVs and terpenoids supports a two-phase defence model: GLVs act as an immediate alarm signal, while terpenoids provide a longer-range, more persistent cue that attracts foraging parasitoids and predators [13] . This staggered release could help plants avoid selfinhibition and optimise the information content of their volatile plume. The 37.2% increase in VOC emission during the wet season paralleled a roughly two-fold rise in natural caterpillar densities, suggesting that emission intensity tracks real herbivore pressure rather than simply abiotic conditions. That said, temperature and humidity independently affect volatile vapour pressure and diffusion, so fully disentangling biotic and abiotic drivers will require controlled-environment experiments [14,15] .
Conclusion
This research confirms that herbivore-induced VOC emissions in forest trees are species-specific, temporally structured, and seasonally modulated. Betula pendula emerged as the strongest and fastest responder, while Pinus sylvestris showed the weakest induced signal. The twophase emission pattern-early GLVs followed by sustained terpenoid release-was consistent across all four species and suggests a conserved signalling strategy. Wet-season amplification of the response aligns with higher herbivore activity, pointing to an adaptive linkage between defence investment and threat intensity. Future work should test whether the volatile blends described here actually attract natural enemies under field conditions and whether neighbouring trees prime their own defences in response to these airborne signals.
Understanding these tri-trophic dynamics in mixed-species forests could inform biocontrol strategies and silvicultural practices that preserve natural pest regulation services.
Acknowledgement
Acknowledgements Funding SourcesThis research was supported by internal institutional funds for plant biology research. No external grant numbers are associated with the work. Institutional SupportThe authors thank the Instituto de Ciencias Biologicas do Pantanal for access to the woodland plot, GC-MS instrumentation, and climate monitoring equipment. Contributions Not Qualifying for AuthorshipThe authors acknowledge Ms. Fernanda Ribeiro for maintaining the Lymantria dispar colony and Mr. Diego Souza for field sampling assistance.
Figures and tables from the paper
| Species | Control | Herbivore- Damaged | Fold Change | p-value |
|---|---|---|---|---|
| Quercus robur | 11.8 | 47.6 | 4.03 | < 0.001 |
| Fagus sylvatica | 9.4 | 36.9 | 3.93 | < 0.001 |
| Betula pendula | 13.7 | 65.2 | 4.76 | < 0.001 |
| Pinus sylvestris | 7.3 | 23.4 | 3.21 | < 0.001 |
Table text extracted from the original PDF; superscript letters are shown inline. The original table image is below.
View original table image
References
15 in the original paper- Kesselmeier J, Staudt M. Biogenic volatile organic compounds (VOC): an overview on emission, physiology and ecology. Journal of Atmospheric Chemistry. 1999;33(1):23-88.
- Turlings TCJ, Erb M. Tritrophic interactions mediated by herbivore-induced plant volatiles: mechanisms, ecological relevance, and application potential. Annual Review of Entomology. 2018;63:433-452.
- Dicke M, Baldwin IT. The evolutionary context for herbivore-induced plant volatiles: beyond the cry for help. Trends in Plant Science. 2010;15(3):167-175.
- Turlings TCJ, Tumlinson JH, Lewis WJ. Exploitation of herbivore-induced plant odors by host-seeking parasitic wasps. Science. 1990;250(4985):1251-1253.
- De Moraes CM, Lewis WJ, Pare PW, Alborn HT, Tumlinson JH. Herbivore-infested plants selectively attract parasitoids. Nature. 1998;393(6685):570-573.
- Niinemets U, Loreto F, Reichstein M. Physiological and physicochemical controls on foliar volatile organic compound emissions. Trends in Plant Science. 2004;9(4):180-186.
- Dudareva N, Klempien A, Muhlemann JK, Kaplan I. Biosynthesis, function and metabolic engineering of plant volatile organic compounds. New Phytologist. 2013;198(1):16-32.
- Mumm R, Dicke M. Variation in natural plant products and the attraction of bodyguards involved in indirect plant defense. Canadian Journal of Zoology. 2010;88(7):628-667.
- Blande JD, Holopainen JK, Niinemets U. Plant volatiles in polluted atmospheres: stress responses and signal degradation. Plant, Cell and Environment. 2014;37(8):1892-1904.
- Ghirardo A, Koch K, Taipale R, Zimmer I, Schnitzler JP. Determination of de novo and pool emissions of terpenes from four common boreal and temperate tree species. Plant, Cell and Environment. 2010;33(5):781792.
- Vickers CE, Gershenzon J, Lerdau MT, Loreto F. A unified mechanism of action for volatile isoprenoids in plant abiotic stress. Nature Chemical Biology. 2009;5(5):283-291.
- Franceschi VR, Krokene P, Christiansen E, Krekling T. Anatomical and chemical defenses of conifer bark against bark beetles and other pests. New Phytologist. 2005;167(2):353-376.
- Heil M, Silva Bueno JC. Within-plant signaling by volatiles leads to induction and priming of an indirect plant defense in nature. Proceedings of the National Academy of Sciences. 2007;104(13):5467-5472.
- Holopainen JK, Gershenzon J. Multiple stress factors and the emission of plant VOCs. Trends in Plant Science. 2010;15(3):176-184.
- Perreca E, Gershenzon J, Eberl F. Tree volatiles: effects of biotic and abiotic factors on emission and biological roles. Tree Physiology. 2023;43(2):171-196.