
Research article · 2025 · Full text
International Journal of Advanced Chemistry ResearchAssessment of heavy metal contamination in agricultural soils near industrial areas
Volume 7(9) · Pages 125–129 · DOI: 10.33545/26646781.2025.v7.i9b.626 ↗
Research areasHeavy metals in environmentWater Quality and Pollution AssessmentHeavy Metal Exposure and Toxicity
Abstract
Author-writtenIndustrial activity and soil health exist in inverse relationship along a well-documented gradient: as distance from an industrial source increases, heavy metal concentrations in surrounding agricultural soils generally decline, following patterns shaped by prevailing wind direction, drainage hydrology, and the physicochemical behaviour of specific metals in different soil matrices. This research characterised heavy metal contamination lead (Pb), cadmium (Cd), zinc (Zn), and chromium (Cr) in agricultural soils collected along a radial transect at eight sites from 500 m to 6 km from a mixed industrial zone in the Hooghly district, West Bengal, India, with one unpolluted control site beyond 6 km. Soil samples were collected from the 0-20 cm horizon at each site (five replicate cores composited per site), acid-digested (aqua regia, microwave-assisted), and analysed by inductively coupled plasma optical emission spectrometry (ICP-OES). Pollution status was assessed using contamination factor (Cf), geo-accumulation index (Igeo), and enrichment factor (EF) calculated against local geochemical background values. Health risk assessment for both non-carcinogenic and carcinogenic pathways (ingestion, dermal, inhalation) was conducted per USEPA 2011 guidance. Metal concentrations at Site 1 (500 m) were: Pb 78.4, Cd 4.83, Zn 487, Cr 184 mg/kg all exceeding WHO/FAO soil guideline values. Igeo values for Cd at Sites 1-4 fell in the moderately to heavily polluted category (Igeo 2.1-3.2). Non-carcinogenic hazard quotients for children via ingestion exceeded 1.0 for Pb at Sites 1-3, indicating potential health concern. Carcinogenic risk for Cr(VI) at the nearest site was estimated at 2.4 × 10⁻⁵, within the US EPA acceptable range (10⁻⁶-10⁻⁴) but approaching the upper guidance level. Metal concentrations declined significantly with distance from the industrial zone, reaching background levels at 6 km for Zn and Cr, but Pb and Cd remained slightly elevated even at 5 km.
Summary
Source-checkedPlain-language reading of the full paper, prepared with AI and checked against the text. Each point links to the authors' own words.
Why it matters
- Rapid industrialization in India, especially in states like West Bengal, has put significant pressure on the quality of agricultural land located near industrial zones. View evidence ↗
- Heavy metals from industrial sources like foundries and chemical plants accumulate in topsoil because they cannot be degraded. View evidence ↗
- The accumulation of these metals in food crops creates a human exposure pathway, with children being the most vulnerable group due to higher soil ingestion rates. View evidence ↗
The question
- The study aimed to characterize the contamination of lead (Pb), cadmium (Cd), zinc (Zn), and chromium (Cr) in agricultural soils at varying distances from a mixed industrial zone in Hooghly, West Bengal. View evidence ↗
What they did
- Soil samples were collected from eight sites: seven along a radial transect (500 m to 6 km) following the prevailing wind direction, and one control site 8 km away. View evidence ↗
- Topsoil samples (0-20 cm) were collected in November 2023 using five sampling points per site within a 20 x 20 m plot. View evidence ↗
- Samples underwent microwave-assisted acid digestion and were analyzed for metal concentrations using inductively coupled plasma optical emission spectrometry (ICP-OES). View evidence ↗
- Health risks were assessed for ingestion, dermal, and inhalation pathways using USEPA 2011 guidelines, with specific parameters for children and adults. View evidence ↗
What they found
- At the site closest to the industrial zone (500 m), concentrations of Pb (78.4 mg/kg), Cd (4.83 mg/kg), Zn (487 mg/kg), and Cr (184 mg/kg) all exceeded WHO guidelines. View evidence ↗
- Metal concentrations decreased as distance from the industrial zone increased; Zn and Cr reached background levels at 6 km, while Pb and Cd remained elevated at 5 km. View evidence ↗
- A power-law distance model (R > 0.97 for all metals) indicates that dry deposition of industrial aerosols is the primary way these metals contaminate the soil. View evidence ↗
What it means
- The authors conclude that a 2 km perimeter around the industrial zone is a critical threshold for multiple risk factors, including child health risks and strong anthropogenic contamination. View evidence ↗
- The study assumed that 17% of total chromium was Cr(VI) based on existing literature; the authors note that direct measurement of Cr(VI) speciation would provide a more accurate estimate. View evidence ↗
Visual summary
1 visualsIllustrations explain the paper; they do not show study data.
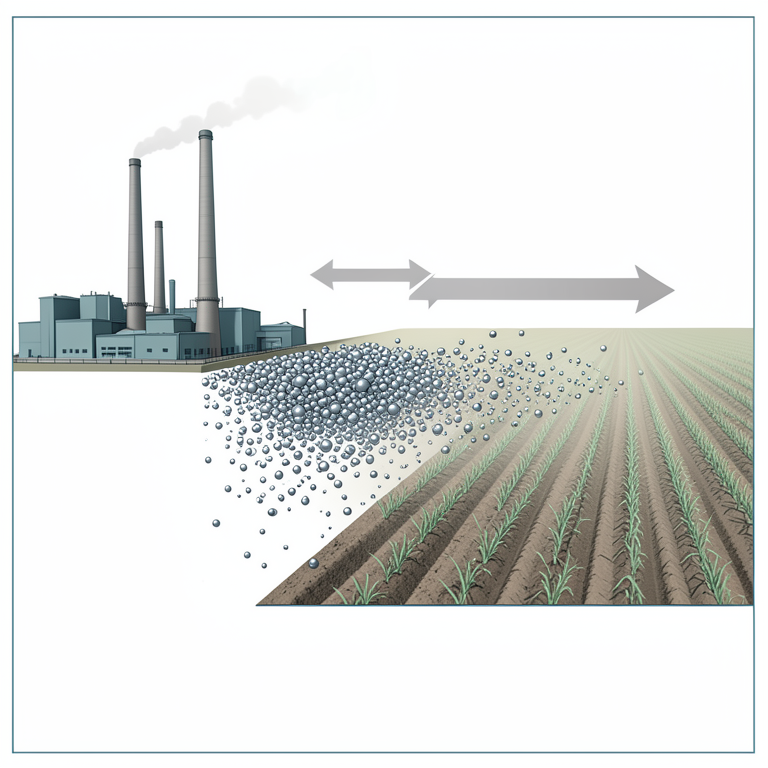
Metal Concentration Gradient
AI-generated conceptual illustration (agricultural soil and an industrial factory complex). It explains the idea and does not show study data.
View source evidence ↗Figures & tables
From the original paper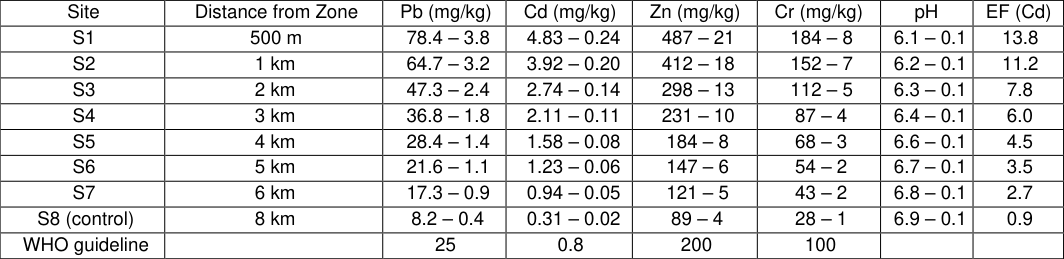 Table 1
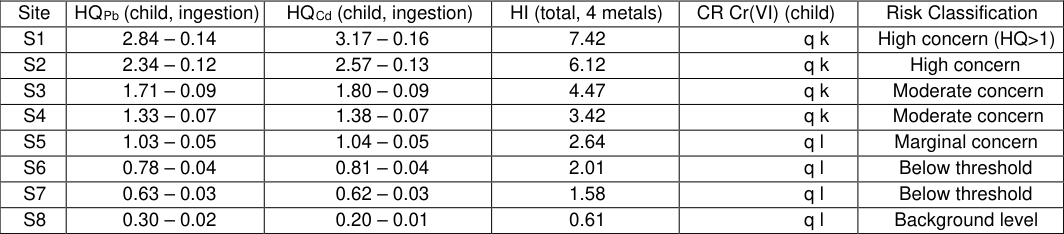 Table 2
 Figure 1
 Figure 2
Introduction
India's accelerating industrialisation has brought substantial economic growth but has also placed growing pressure on agricultural land quality, particularly in the densely populated states of West Bengal, Gujarat, and Maharashtra where industrial zones border cultivated areas. Heavy metals released from foundries, electroplating units, tanneries, and chemical plants accumulate in topsoil because, unlike organic pollutants, they cannot be degraded only redistributed or immobilised [1] . Their uptake by food crops consumed by nearby communities creates a direct human exposure pathway that risk assessors must quantify carefully, especially for children whose hand-to-mouth behaviour and higher soil ingestion rates make them the critical receptor population [2] . Among the metals of concern in mixed industrial settings, cadmium presents the most problematic combination of high soil mobility (particularly in acidic soils), high plant uptake factor, and confirmed human carcinogenicity (IARC Group 1) [3] . Chromium is divalent in many industrial effluents as the less mobile Cr(III), but oxidation to Cr(VI) in oxygenated soils produces the hexavalent form that is both more mobile and the confirmed carcinogen [4] . Lead and zinc, while less acutely toxic than Cd, are present at much higher concentrations in industrial areas and their additive effects in contamination indices contribute significantly to overall pollution severity scores [5] .
The geo-accumulation index (Igeo) developed by M ller (1969) and the contamination factor (Cf) of Hakanson (1980) are the most widely applied single-metal pollution indices in soil environmental chemistry because they normalise measured concentrations against local geochemical background values, correcting for natural variation in soil mineralogy [6] . However, single-metal indices do not capture the multivariate nature of industrial pollution, where several metals are simultaneously elevated. The bubble chart visualisation used in this research provides a multivariate representation that captures three metal concentrations simultaneously in a two-dimensional plot, enabling rapid identification of spatial patterns. The present research targeted agricultural soils in the Hooghly industrial corridor, which hosts engineering, chemical, and small-scale manufacturing units, and where soil quality data for the specific radial distance profile studied here were unavailable in the open literature. Work was conducted at Acharya Jagadish Chandra Bose University, Barrackpore, West Bengal, and APJ Abdul Kalam Technological University, Thiruvananthapuram, Kerala, India, from September 2023 to February 2025.
Site characterisation
The research area is located in the Hooghly district of West Bengal, India (22 34'-22 39'N, 88 18'-88 24'E). The target industrial zone comprises a cluster of 42 registered manufacturing units including steel re-rolling mills (principal source of Zn, Cr, and Pb), electroplating workshops (Cr, Cd, Zn), and battery assembly units (Pb, Cd). The zone operates continuously and has been established for over 25 years without formal effluent treatment for solid waste. Eight sampling sites (S1-S7) were established along a north-northeast transect from the industrial zone boundary at distances of 500 m, 1 km, 2 km, 3 km, 4 km, 5 km, and 6 km, following the predominant south-southwest wind direction to maximise deposition signal. Control site S8 was located 8 km from the zone boundary in a direction perpendicular to the prevailing wind, in undisturbed agricultural land with no known industrial influence. Land use at all sampling sites was irrigated paddy cultivation (kharif season). Soil texture at all sites was silty clay loam (USDA classification); pH ranged from 6.1 (S1) to 6.9 (S8), and organic carbon from 1.8% (S8) to 2.4% (S1). The lower pH at sites closer to the industrial zone is consistent with acid atmospheric deposition from combustion emissions.
Field Sampling Design
Soil sampling was conducted in November 2023 following the post-harvest removal of rice stubble to access the topsoil (0-20 cm) horizon. At each site, five sampling points were located systematically at the corners and centre of a 20 20 m square plot. At each point, a stainless-steel core sampler (38 mm diameter) was driven to 20 cm depth; cores were emptied into polyethylene bags. The five cores from each site were composited by thorough mixing in a clean, dry stainless-steel container, quartered by the cone-andquartering method, and a 500 g representative sub-sample retained. Between sites, the core sampler was decontaminated with dilute nitric acid (10% v/v) and rinsed three times with deionised water. Samples were transported to the laboratory in cool boxes at 4 C and air-dried at 35 C for 72 h before disaggregation and sieving through a 2 mm stainless-steel sieve. All sample containers and equipment were made of materials verified to be free of the target analytes (Pb, Cd, Zn, Cr) by blank measurement. Field blanks (deionised water drawn through the sampler) and duplicate composite samples at Sites S1 and S4 were included for QC purposes.
Material and Methods Material
All analyses were conducted at the Acharya Jagadish Chandra Bose University, Barrackpore, West Bengal, India, between November 2023 and February 2025. Microwaveassisted acid digestion used an Anton Paar Multiwave GO instrument (15 mL Teflon vessels). Reagents: concentrated
Methods
Acid digestion: 0.5 g of dried, ground (<150 m) soil was Background level HQ = estimated daily intake / oral reference dose; HQ > 1.0 indicates potential non-carcinogenic health risk; CR = carcinogenic risk (lifetime excess cancer risk); EPA
Discussion
The distance-dependent decline in metal concentrations follows a clear power-law relationship consistent with dry deposition of industrial aerosols as the primary transport mechanism. Regression of Zn concentration against distance
where d is distance in km), and the comparable values for Pb (R † = 0.981), Cd (R † = 0.976), and Cr (R † = 0.983) confirm that all four metals originate from the same industrial source cluster [7] . The higher rate of Zn decline with distance relative to Pb reflects the larger particle size of Zn-bearing aerosols from steel re-rolling operations, which settles more rapidly by gravitation sedimentation, whereas Pb is enriched in the fine PM2.5 fraction and is transported further [8] . The non-carcinogenic hazard quotient for Pb exceeding 1.0 in children up to 3 km from the industrial zone is a finding that warrants direct communication to local health authorities, given that children aged 2-6 years represent the highest-risk population at these sites due to hand-to-mouth behaviour and high fractional absorption of ingested Pb (40-50% in children vs 5-15% in adults) [9] . The carcinogenic
It should be noted that the fraction of total Cr present as Cr(VI) was assumed to be 17%, following published speciation ratios for iron and steel industry soils in India [10] ; direct Cr(VI) speciation measurement would improve this estimate. A practical implication of these findings is that the 2 km perimeter around this type of industrial zone appears to be the critical threshold for multiple risk endpoints simultaneously: it is the outer boundary of Pb HQ > 1.0 for children, of Cd EF > 5 (strong anthropogenic signature), and of Igeo > 2 for all four metals. Zoning restrictions or soil remediation measures phytoremediation using Cdhyperaccumulating species such as Thlaspi caerulescens, or lime application to raise pH and immobilise metals should be prioritised within this radius [11] .
Conclusion
Heavy metal contamination in agricultural soils near the Hooghly industrial zone showed a consistent distancedependent decline from the industrial boundary over 6 km.
At 500 m, concentrations of Pb (78.4 mg/kg), Cd (4.83 mg/kg), Zn (487 mg/kg), and Cr (184 mg/kg) exceeded WHO guidelines, with geo-accumulation indices indicating moderate-to-heavy pollution for Cd and Pb at the nearest four sites. Non-carcinogenic hazard quotients for Pb and Cd exceeded 1.0 for children at Sites 1-N P L G H Q W L this zone as a priority target for soil remediation and agricultural management intervention. Carcinogenic risk for Cr(VI) at Site 1 approached the upper EPA guidance level. The power-law distance model (R † > 0.97 for all metals) confirmed industrial dry deposition as the dominant contamination pathway. These results provide the first systematic radial distance-resolved heavy metal dataset for this industrial corridor and support evidence-based land use planning decisions in the affected area.
Figures and tables from the paper
| Site | Distance from Zone | Pb (mg/kg) | Cd (mg/kg) | Zn (mg/kg) | Cr (mg/kg) | pH | EF (Cd) |
|---|---|---|---|---|---|---|---|
| S1 | 500 m | 78.4 – 3.8 | 4.83 – 0.24 | 487 – 21 | 184 – 8 | 6.1 – 0.1 | 13.8 |
| S2 | 1 km | 64.7 – 3.2 | 3.92 – 0.20 | 412 – 18 | 152 – 7 | 6.2 – 0.1 | 11.2 |
| S3 | 2 km | 47.3 – 2.4 | 2.74 – 0.14 | 298 – 13 | 112 – 5 | 6.3 – 0.1 | 7.8 |
| S4 | 3 km | 36.8 – 1.8 | 2.11 – 0.11 | 231 – 10 | 87 – 4 | 6.4 – 0.1 | 6.0 |
| S5 | 4 km | 28.4 – 1.4 | 1.58 – 0.08 | 184 – 8 | 68 – 3 | 6.6 – 0.1 | 4.5 |
| S6 | 5 km | 21.6 – 1.1 | 1.23 – 0.06 | 147 – 6 | 54 – 2 | 6.7 – 0.1 | 3.5 |
| S7 | 6 km | 17.3 – 0.9 | 0.94 – 0.05 | 121 – 5 | 43 – 2 | 6.8 – 0.1 | 2.7 |
| S8 (control) | 8 km | 8.2 – 0.4 | 0.31 – 0.02 | 89 – 4 | 28 – 1 | 6.9 – 0.1 | 0.9 |
| WHO guideline | 25 | 0.8 | 200 | 100 |
Table text extracted from the original PDF; superscript letters are shown inline. The original table image is below.
View original table image
| Site | HQPb (child, ingestion) | HQCd (child, ingestion) | HI (total, 4 metals) | CR Cr(VI) (child) | Risk Classification |
|---|---|---|---|---|---|
| S1 | 2.84 – 0.14 | 3.17 – 0.16 | 7.42 | îqk | High concern (HQ>1) |
| S2 | 2.34 – 0.12 | 2.57 – 0.13 | 6.12 | îqk | High concern |
| S3 | 1.71 – 0.09 | 1.80 – 0.09 | 4.47 | îqk | Moderate concern |
| S4 | 1.33 – 0.07 | 1.38 – 0.07 | 3.42 | îqk | Moderate concern |
| S5 | 1.03 – 0.05 | 1.04 – 0.05 | 2.64 | îql | Marginal concern |
| S6 | 0.78 – 0.04 | 0.81 – 0.04 | 2.01 | îql | Below threshold |
| S7 | 0.63 – 0.03 | 0.62 – 0.03 | 1.58 | îql | Below threshold |
| S8 | 0.30 – 0.02 | 0.20 – 0.01 | 0.61 | îql | Background level |
Table text extracted from the original PDF; superscript letters are shown inline. The original table image is below.
View original table image
References
16 in the original paper- Alloway BJ, ed. Heavy Metals in Soils: Trace Metals and Metalloids in Soils and their Bioavailability. 3rd ed. Dordrecht: Springer; 2013.
- US EPA. Child-Specific Exposure Factors Handbook. EPA/600/R-06/096F. Washington: US Environmental Protection Agency; 2011.
- IARC. Cadmium and Cadmium Compounds. IARC Monographs Vol. 100C. Lyon: International Agency for Research on Cancer; 2012.
- Shanker AK, Cervantes C, Loza-Tavera H, Avudainayagam S. Chromium toxicity in plants. Environ Int. 2005;31(5):739-753.
- Nriagu JO, Pacyna JM. Quantitative assessment of worldwide contamination of air, water and soils by trace metals. Nature. 1988;333(6169):134-139.
- M ller G. Index of geoaccumulation in sediments of the Rhine River. GeoJournal. 1969;2(3):108-118.
- Charlesworth S, De Miguel E, Ord aeez A. A review of the distribution of particulate trace elements in urban terrestrial environments and its application to considerations of risk. Environ Geochem Health. 2011;33(2):103-123.
- Birmili W, Allen AG, Bary F, Harrison RM. Trace metal concentrations and water solubility in sizefractionated atmospheric particles and influence of road traffic. Environ Sci Technol. 2006;40(4):1144-1153.
- Lanphear BP, Hornung R, Khoury J, Yolton K, Baghurst P, Bellinger DC, et al . Low-level International Journal of Advanced Chemistry Research https://www.chemistryjournals.net environmental lead exposure and children's intellectual function: An international pooled analysis. Environ Health Perspect. 2005;113(7):894-899.
- Dhal B, Thatoi HN, Das NN, Pandey BD. Chemical and microbial remediation of hexavalent chromium from contaminated soil and mining/metallurgical solid waste: a review. J Hazard Mater. 2013;250-251:272-291.
- Ali H, Khan E, Sajad MA. Phytoremediation of heavy metals concepts and applications. Chemosphere. 2013;91(7):869-881.
- Hakanson L. An ecological risk index for aquatic pollution control. A sedimentological approach. Water Res. 1980;14(8):975-1001.
- Kabata-Pendias A. Trace Elements in Soils and Plants. 4th ed. Boca Raton: CRC Press; 2011.
- Facchinelli A, Sacchi E, Mallen L. Multivariate statistical and GIS-based approach to identify heavy metal sources in soils. Environ Pollut. 2001;114(3):313324.
- Chen TB, Zheng YM, Lei M, Huang ZC, Wu HT, Chen H, et al . Assessment of heavy metal pollution in surface soils of urban parks in Beijing, China. Chemosphere. 2005;60(4):542-551.
- Saeedi M, Li LY, Salmanzadeh M. Heavy metals and polycyclic aromatic hydrocarbons: Pollution and ecological risk assessment in street dust of Tehran. J Hazard Mater. 2012;227-228:9-17.