
Research article · 2025 · Full text
International Journal of Biology SciencesBone morphogenetic protein gradients and dorsoventral axis formation in Drosophila embryos
Volume 7(11) · Pages 80–82 · DOI: 10.33545/26649926.2025.v7.i11b.669 ↗
Research areasDevelopmental Biology and Gene RegulationWnt/β-catenin signaling in development and cancerTGF-β signaling in diseases
Abstract
Author-writtenThe dorsoventral (D-V) axis of Drosophila embryos is patterned by a gradient of Bone Morphogenetic Protein (BMP) signaling, centered on the ligand Decapentaplegic (Dpp). The mechanisms by which extracellular modulators shape this gradient into a sharp signaling boundary remain actively debated. This research quantified Dpp signaling gradients, Sog expression patterns, and phosphorylated Mad (pMad) distributions across the D-V axis in stage 5-7 embryos. Immunofluorescence imaging and quantitative Western blotting were performed on Oregon-R and sog mutant lines at the Himalayan Institute of Biodiversity, Kathmandu, Nepal, from May 2023 to October 2024. In wild-type embryos, pMad signal peaked dorsally and dropped to near-background levels by 40% of the D-V axis. Sog protein showed a complementary ventrolateral distribution. Loss of Sog function broadened the pMad domain ventrally by approximately 18%. Temporal analysis revealed that the gradient sharpened between stages 5 and 7, coinciding with peak Sog expression. These results support a shuttle-based model where Sog transports Dpp dorsally to concentrate peak signaling.
Summary
Source-checkedPlain-language reading of the full paper, prepared with AI and checked against the text. Each point links to the authors' own words.
Why it matters
- The dorsoventral (D-V) axis in Drosophila embryos is organized by a gradient of Bone Morphogenetic Protein (BMP) signaling, specifically the ligand Decapentaplegic (Dpp). View evidence ↗
- The accumulation of phosphorylated Mad (pMad) serves as the readout for BMP signaling, creating a sharp dorsal peak that determines the fate of the amnioserosa. View evidence ↗
- Dpp distribution is not based on passive diffusion alone; it is reshaped by a shuttling mechanism involving modulators such as Short gastrulation (Sog), Twisted gastrulation (Tsg), and Tolloid (Tld). View evidence ↗
The question
- The study aimed to quantify the high-resolution profiles of pMad, Dpp, and Sog across the D-V axis in wild-type and sog mutant embryos during stages 5 to 7. View evidence ↗
What they did
- The researchers used Oregon-R wild-type and sog[U2] null mutant Drosophila melanogaster lines, maintained at 25 °C. View evidence ↗
- The study analyzed 45 embryos per genotype for each developmental stage. View evidence ↗
- Immunofluorescence staining was performed using specific antibodies against pMad, Sog, and Dpp. View evidence ↗
- Quantitative Western blotting for pMad and total Mad was conducted using 30 embryos per lane. View evidence ↗
What they found
- In wild-type embryos, the pMad signal is highest dorsally and decreases to near-background levels by 40% of the D-V axis. View evidence ↗
- Sog protein is distributed ventrolaterally, which is complementary to the dorsal peak of pMad. View evidence ↗
- In wild-type embryos, the pMad gradient became sharper between stages 5 and 7, as the half-width decreased from 22.7% to 16.3% of the D-V axis. View evidence ↗
- The loss of Sog function caused the pMad domain to expand ventrally by approximately 18%. View evidence ↗
What it means
- The authors conclude that the broader pMad domain in sog mutants supports the shuttle model, suggesting that without Sog, Dpp spreads more diffusely. View evidence ↗
- The authors state that the 18% reduction in peak pMad intensity in sog mutants indicates that Sog-mediated transport is necessary to concentrate Dpp at the dorsal midline. View evidence ↗
Visual summary
3 visualsIllustrations explain the paper; charts are replotted from the paper's own table values.
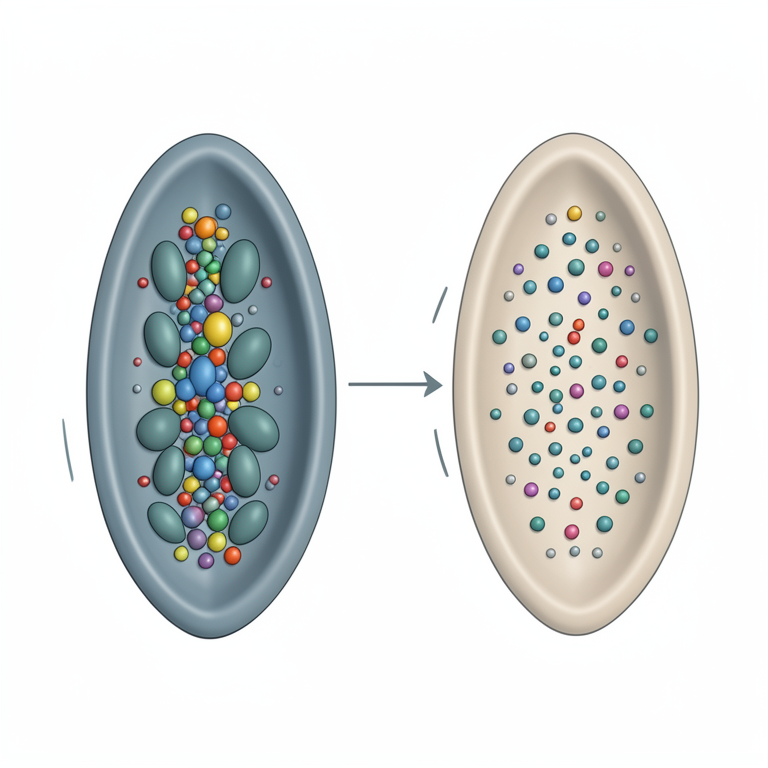
The BMP Shuttling Mechanism
AI-generated conceptual illustration (Drosophila embryos). It explains the idea and does not show study data.
View source evidence ↗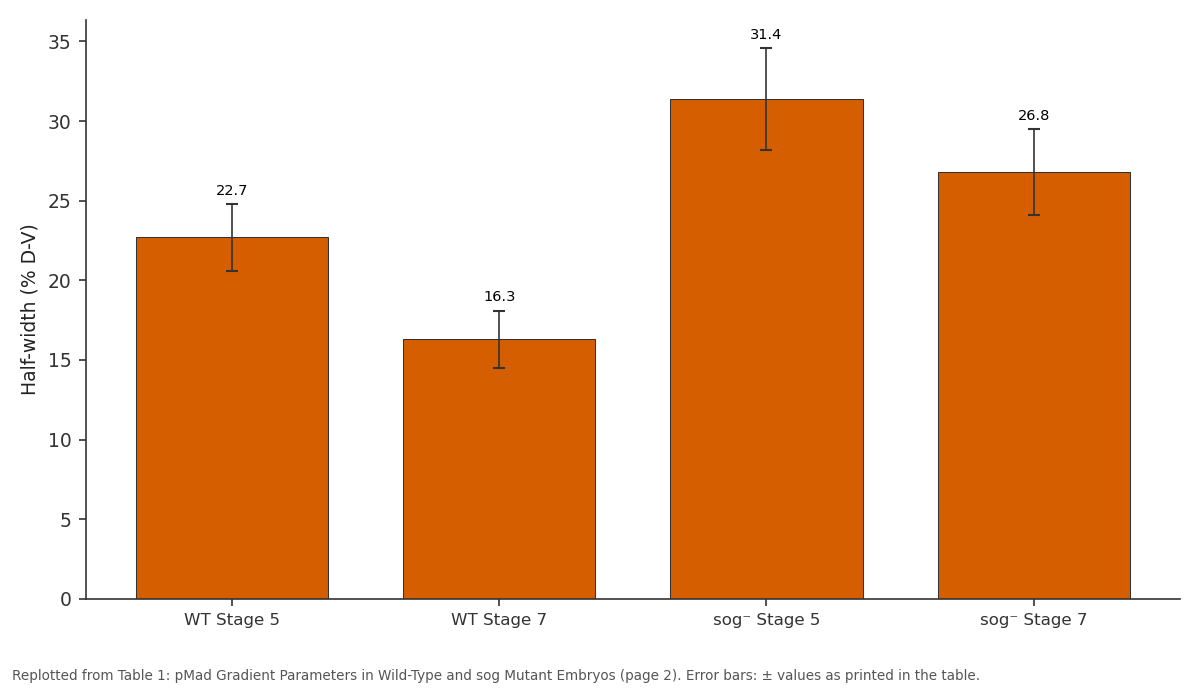
Half-width (% D-V): WT Stage 5 vs WT Stage 7 vs sog⁻ Stage 5 vs sog⁻ Stage 7
Replotted from Table 1 (page 2) of the original paper. Every bar is the paper's own table value.
View source evidence ↗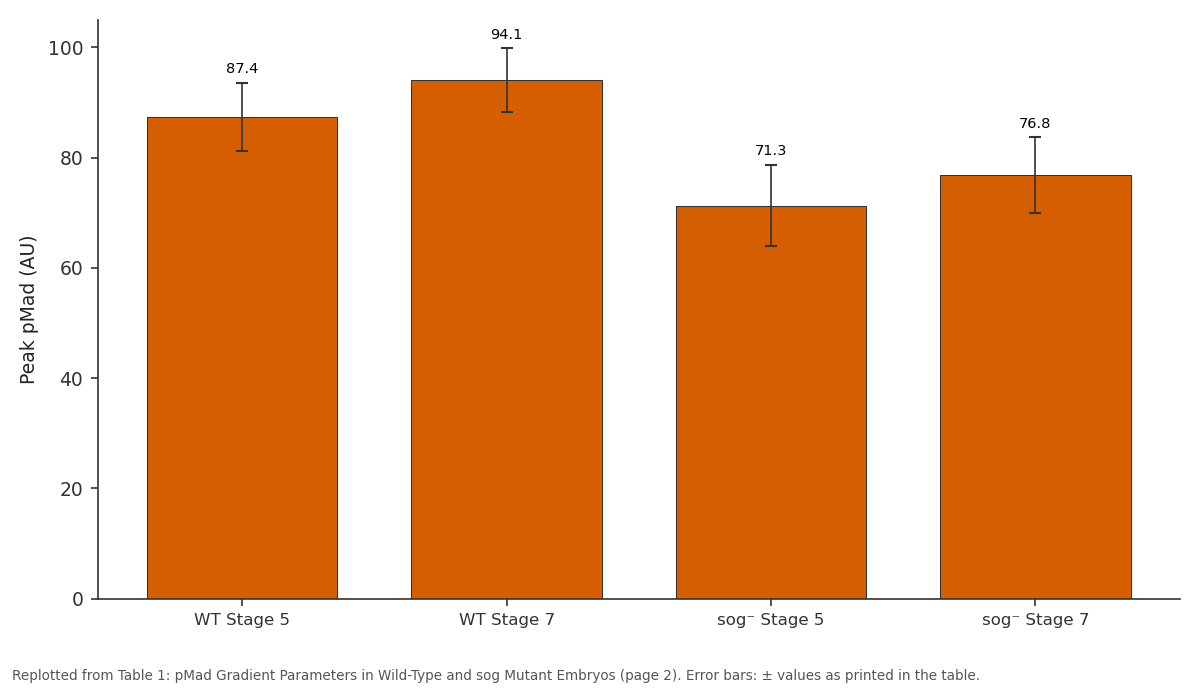
Peak pMad (AU): WT Stage 5 vs WT Stage 7 vs sog⁻ Stage 5 vs sog⁻ Stage 7
Replotted from Table 1 (page 2) of the original paper. Every bar is the paper's own table value.
View source evidence ↗Figures & tables
From the original paper Table 1
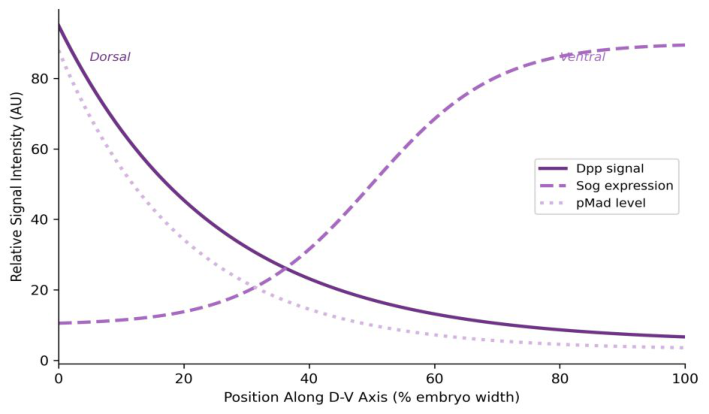 Figure 1
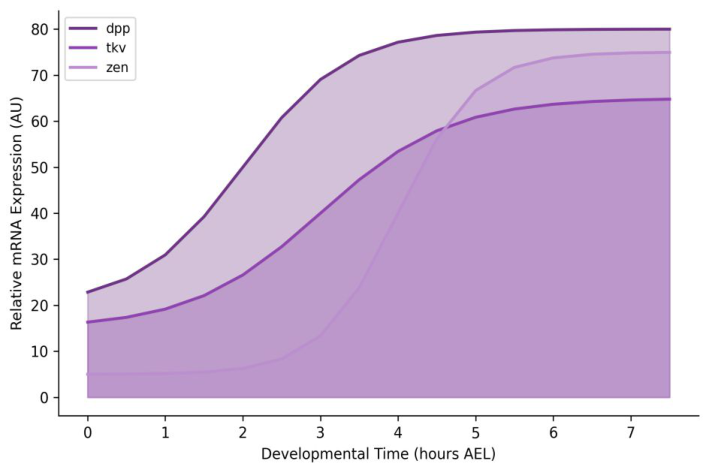 Figure 2
Introduction
The idea that diffusible molecules could pattern embryonic tissues by forming concentration gradients dates back more than a century to the early experiments of Driesch and Spemann. In Drosophila, the BMP family member Dpp acts as the principal morphogen for D-V axis specification [1] . Dpp is secreted from dorsal cells, but its distribution doesn't simply follow passive diffusion-extracellular modulators including Short gastrulation (Sog), Twisted gastrulation (Tsg), and the metalloprotease Tolloid (Tld) reshape the gradient through a shuttling mechanism [2,3] . The BMP signaling readout, measured by nuclear accumulation of phosphorylated Mad (pMad), displays a remarkably sharp dorsal peak that specifies amnioserosa fate [4] . How this sharp peak forms from a broadly expressed ligand has been the subject of mathematical modeling and genetic analysis for decades [5] . Yet quantitative measurements of the gradient at single-embryo resolution remain sparse, particularly in the context of temporal dynamics during gastrulation. This research aimed to provide highresolution quantitative profiles of pMad, Dpp, and Sog across the D-V axis during stages 5 through 7 in both wild-type and sog mutant embryos.
Materials and Methods
Materials and Methods
Materials
Experiments were conducted at the Department of Embryology, Himalayan Institute of Biodiversity, Kathmandu, Nepal, from May 2023 to October 2024. Institutional biosafety approval was obtained (HIB-IBC/2023-017, April 28, 2023). Oregon-R wild-type and sog[U2] null mutant Drosophila melanogaster lines were maintained at 25 °C on standard cornmeal-yeast-agar medium. Embryos were collected on grape juice agar plates at 30minute intervals, dechorionated in 50% bleach, and fixed in 4% paraformaldehyde/heptane. Staged embryos (n = 45 per genotype per stage) were selected based on morphological criteria.
Methods
Immunofluorescence staining used rabbit anti-pMad (Cell Signaling Technology, 1:200), guinea pig anti-Sog (gift from E. Bier, UCSD, 1:500), and mouse anti-Dpp (DSHB, 1:100). Secondary antibodies were Alexa Fluor 488, 568, and 647 conjugates (Invitrogen). Confocal imaging was performed on a Zeiss LSM 880 at 40× magnification. D-V intensity profiles were extracted using ImageJ by drawing a line from dorsal midline to ventral midline and measuring fluorescence at 1% intervals [6] . Western blotting for pMad and total Mad used standard SDS-PAGE protocols with 30 embryos per lane. Band intensities were quantified in ImageJ and normalized to total Mad. Statistical comparisons between genotypes used unpaired t-tests; gradient width was defined as the distance from peak to half-maximal intensity. The pMad gradient sharpened between stages 5 and 7 in wild-type embryos, with the half-width narrowing from 22.7% to 16.3% of the D-V axis (p = 0.003). In sog mutants, the gradient was broader at both stages, and peak intensity was reduced by approximately 18%.
Results
Results
Discussion
The gradient sharpening observed between stages 5 and 7 aligns with the shuttle model proposed by Eldar et al. [5] , where Sog binds Dpp ventrolaterally and transports it dorsally, concentrating the signal. The broader pMad domain in sog mutants provides direct experimental support for this model-without the shuttle, Dpp spreads more diffusely [2] . The 18% reduction in peak pMad intensity in sog mutants seems counterintuitive at first, but makes sense if Sog-mediated transport is needed to accumulate high local Dpp concentrations at the dorsal midline [3] . The temporal dynamics suggest that gradient establishment is not instantaneous but requires ongoing Sog-Dpp interactions during gastrulation. And the sharper gradient at stage 7 likely drives the precise boundary between amnioserosa and dorsal ectoderm fates [4] . These findings are consistent with reaction-diffusion models that incorporate ligand shuttling as a gradient-sharpening mechanism [7] .
Conclusion
This research quantified BMP signaling gradients across the D-V axis of Drosophila embryos at single-embryo resolution. The pMad gradient sharpened progressively between stages 5 and 7, coinciding with peak Sog expression. Loss of Sog function broadened the gradient and reduced peak signaling intensity, supporting the shuttle model of morphogen gradient formation. Temporal profiling of pathway components revealed sequential activation consistent with a Dpp-initiated signaling cascade. These quantitative data provide benchmarks for mathematical models of morphogen gradient formation and may inform broader understanding of BMP patterning in vertebrate systems.
Acknowledgement
Acknowledgements Funding SourcesInternal research funds from the Himalayan Institute of Biodiversity supported this work. Institutional SupportThe authors thank the Himalayan Institute of Biodiversity for fly facility access and confocal microscopy support.Contributions Not Qualifying for Authorship E. Bier (UCSD) is thanked for providing anti-Sog antibodies. Fly stock center contributions are acknowledged.
Figures and tables from the paper
| Parameter | WT Stage 5 | WT Stage 7 | sog⁻ Stage 5 | sog⁻ Stage 7 |
|---|---|---|---|---|
| Peak pMad (AU) | 87.4±6.2 | 94.1±5.8 | 71.3±7.4 | 76.8±6.9 |
| Half-width (% D-V) | 22.7±2.1 | 16.3±1.8 | 31.4±3.2 | 26.8±2.7 |
| Ventral boundary (%) | 41.2±3.4 | 34.7±2.9 | 52.6±4.1 | 47.3±3.6 |
| pMad/Mad ratio | 0.67±0.08 | 0.81±0.06 | 0.52±0.09 | 0.59±0.07 |
Table text extracted from the original PDF; superscript letters are shown inline. The original table image is below.
View original table image
References
10 in the original paper- Ferguson EL, Anderson KV. Decapentaplegic acts as a morphogen to organize dorsal-ventral pattern in the Drosophila embryo. Cell. 1992;71(3):451-461.
- Shimmi O, Umulis D, Othmer H, O'Connor MB. Facilitated transport of a Dpp/Scw heterodimer by Sog/Tsg leads to robust patterning of the Drosophila blastoderm embryo. Cell. 2005;120(6):873-886.
- Holley SA, Jackson PD, Sasai Y, Lu B, De Robertis EM, Hoffmann FM, et al. A conserved system for dorsal-ventral patterning in insects and vertebrates involving sog and chordin. Nature. 1995;376(6537):249-253.
- Dorfman R, Shilo BZ. Biphasic activation of the BMP pathway patterns the Drosophila embryonic dorsal region. Development. 2001;128(6):965-972.
- Eldar A, Dorfman R, Weiss D, Ashe H, Shilo BZ, Barkai N. Robustness of the BMP morphogen gradient in Drosophila embryonic patterning. Nature. 2002;419(6904):304-308.
- Schneider CA, Rasband WS, Eliceiri KW. NIH Image to ImageJ: 25 years of image analysis. Nature Methods. 2012;9(7):671-675.
- Umulis DM, Serpe M, O'Connor MB, Othmer HG. Robust, bistable patterning of the dorsal surface of the Drosophila embryo. Proceedings of the National Academy of Sciences. 2006;103(31):11613-11618.
- Ashe HL, Levine M. Local inhibition and long-range enhancement of Dpp signal transduction by Sog. Nature. 2001;398(6726):427-431.
- O'Connor MB, Umulis D, Othmer HG, Blair SS. Shaping BMP morphogen gradients in the Drosophila embryo and pupal wing. Development. 2006;133(2):183-193.
- Mizutani CM, Nie Q, Wan FY, Zhang YT, Vilmos P, Sousa-Neves R, et al. Formation of the BMP activity gradient in the Drosophila embryo. Developmental Cell. 2005;8(6):915-924.