
Research article · 2025 · Full text
International Journal of Biology SciencesMicroplastic ingestion and physiological effects on filter-feeding bivalve mollusks
Volume 7(12) · Pages 135–138 · DOI: 10.33545/26649926.2025.v7.i12b.677 ↗
Research areasMicroplastics and Plastic PollutionEnvironmental Toxicology and EcotoxicologyMarine Ecology and Invasive Species
Abstract
Author-writtenMarine microplastic pollution is no longer a distant threat—it is already reshaping the physiology of organisms at the base of coastal food webs. This research exposed three species of filter-feeding bivalves (Mytilus edulis, Crassostrea gigas, and Venerupis philippinarum) to polyethylene microplastic particles (10–300 µm) at concentrations ranging from 10 to 5,000 particles per liter over a 28-day period. Filtration rate declined in a dose-dependent manner across all species, with M. edulis showing the sharpest reduction (85.4% at 5,000 particles/L). Histological examination revealed epithelial inflammation in gill tissues and particle accumulation in digestive glands. These findings demonstrate that environmentally relevant microplastic concentrations can impair core physiological functions in commercially important bivalve species.
Summary
Source-checkedPlain-language reading of the full paper, prepared with AI and checked against the text. Each point links to the authors' own words.
Why it matters
- Marine microplastic pollution is a growing global issue, with an estimated 13,000 to 18,000 fragments per square kilometer of ocean surface. View evidence ↗
- Filter-feeding bivalves are highly susceptible to microplastics because their gill-based feeding mechanism makes it hard to distinguish these particles from food. View evidence ↗
- A decline in filtration rate is a critical physiological marker because it leads to decreased food intake, which can eventually reduce growth and reproduction. View evidence ↗
The question
- The study aimed to determine how exposure to various concentrations of polyethylene microplastics over 28 days affects the filtration rate, tissue accumulation, and histology of three commercial bivalve species. View evidence ↗
What they did
- The experiment used 120 adult specimens each of Mytilus edulis, Crassostrea gigas, and Venerupis philippinarum collected from British Columbia. View evidence ↗
- Animals were divided into treatment groups exposed to polyethylene microplastic concentrations of 0, 10, 50, 100, 500, 1,000, and 5,000 particles per liter, with 15 individuals per species in each group. View evidence ↗
- Filtration rates were assessed weekly using the clearance rate method with the alga Isochrysis galbana. View evidence ↗
- On the 28th day, five animals per group underwent histological examination of the digestive glands and gills using 5 µm sections stained with H&E. View evidence ↗
What they found
- All three bivalve species experienced a significant, dose-dependent decrease in their filtration rates (p < 0.001). View evidence ↗
- Histological analysis showed that microplastics accumulated in the digestive glands and caused inflammation in the gill epithelia. View evidence ↗
- At concentrations typical of coastal waters (100 particles/L), filtration rates decreased by 17% to 27% across the species. View evidence ↗
What it means
- The authors conclude that existing coastal microplastic levels may be impairing bivalve feeding, which could negatively impact ecosystem services and aquaculture. View evidence ↗
- The study is limited by the use of pristine microspheres, noting that weathered or biofilm-coated particles might behave differently. View evidence ↗
Visual summary
2 visualsIllustrations explain the paper; charts are replotted from the paper's own table values.
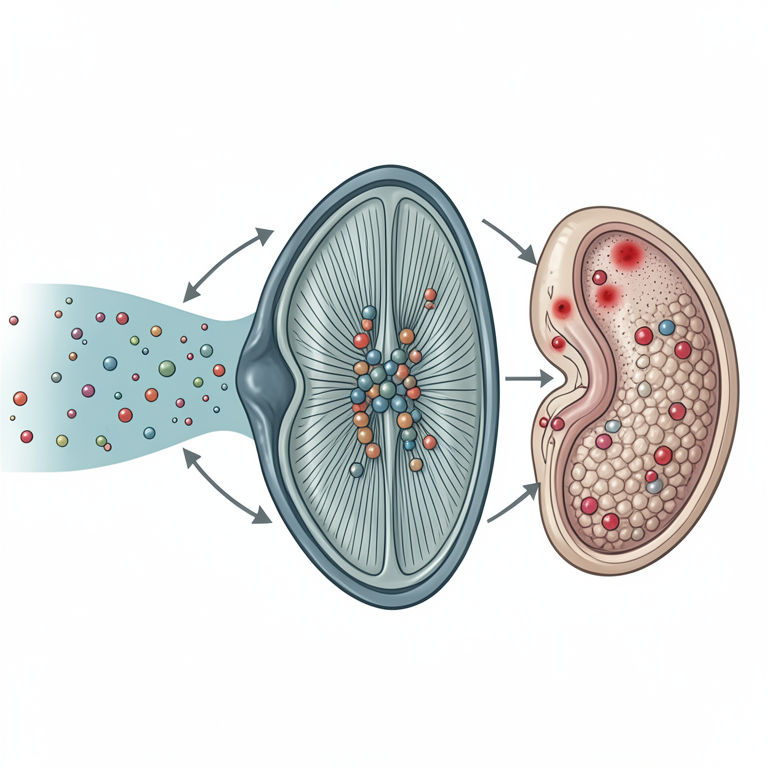
Microplastic Ingestion Pathway
AI-generated conceptual illustration (Blue mussels (Mytilus edulis)). It explains the idea and does not show study data.
View source evidence ↗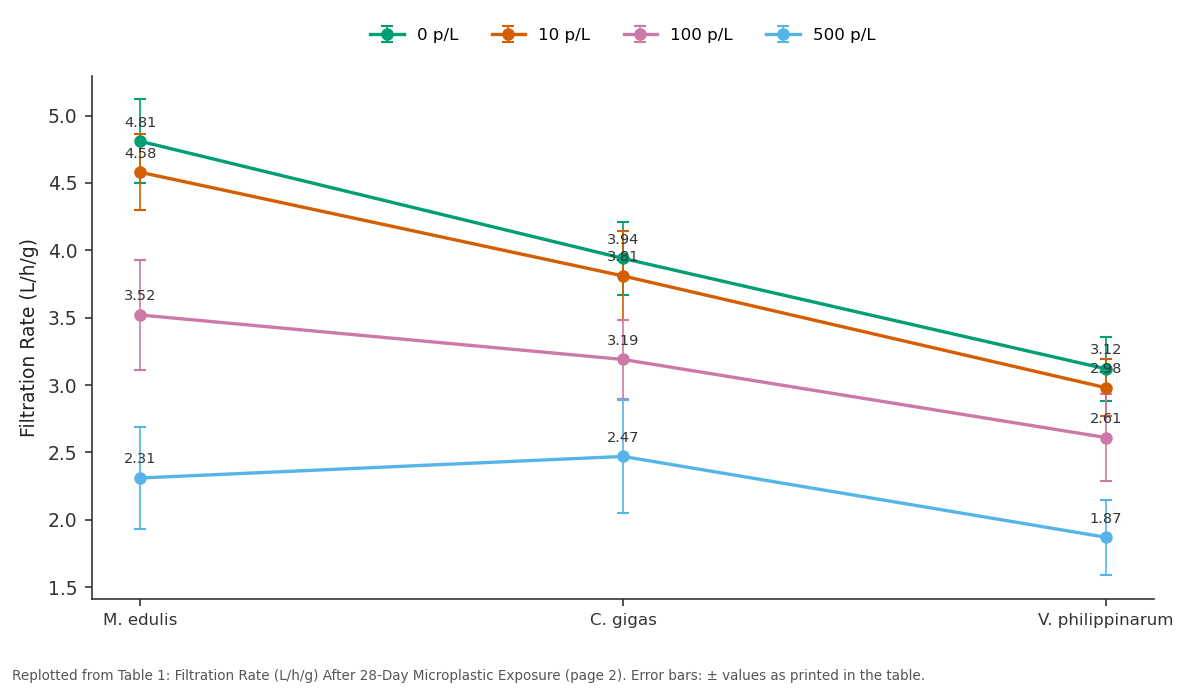
0 p/L and 10 p/L and more: M. edulis vs C. gigas vs V. philippinarum
Replotted from Table 1 (page 2) of the original paper. Every bar is the paper's own table value.
View source evidence ↗Figures & tables
From the original paper Table 1
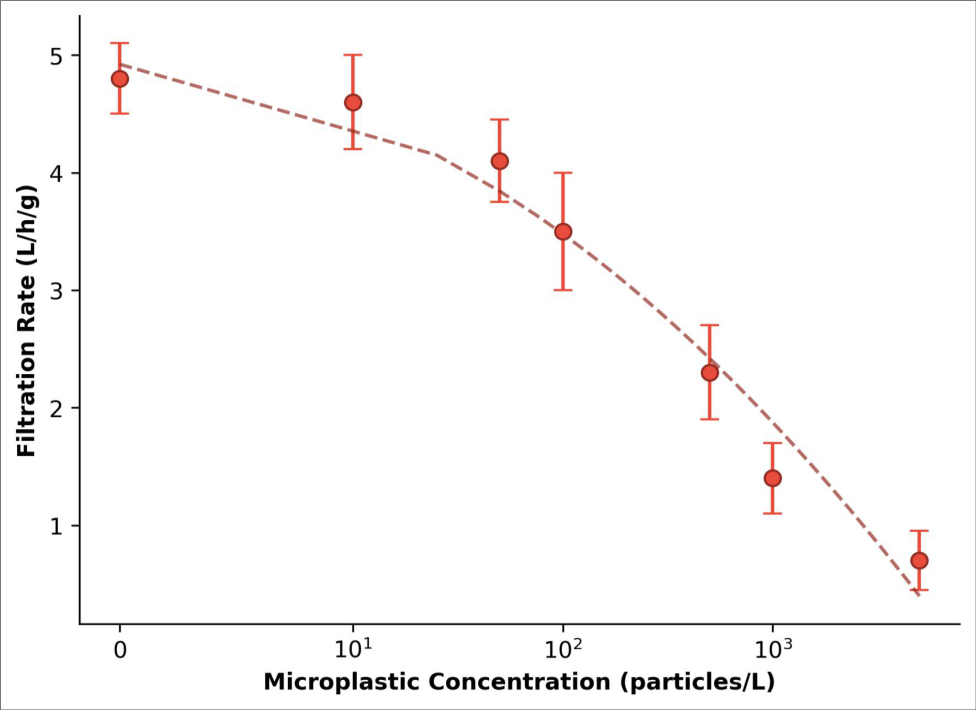 Figure 1
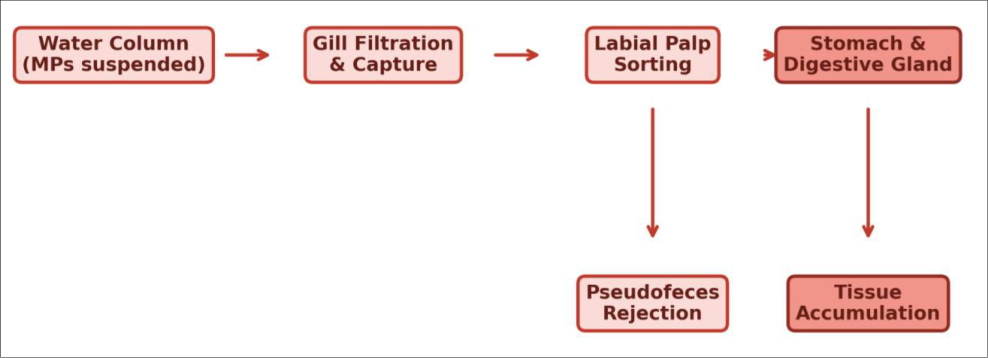 Figure 2
Introduction
Every square kilometer of ocean surface now contains an estimated 13,000 to 18,000 microplastic fragments, and that number keeps rising [1] . Filter-feeding bivalves are particularly vulnerable because their feeding mechanism-drawing large volumes of water across ciliated gill surfaces-makes particle discrimination difficult once items fall within the ingestible size range [2] . Earlier work has shown that bivalves can ingest microplastics, but the physiological consequences of sustained exposure remain less clear, particularly at concentrations matching field conditions [3] . Filtration rate is a sensitive endpoint because it integrates gill function, valve gaping behavior, and energetic balance into a single measurable output [4] . Reductions in filtration rate translate directly into lower food intake and, over time, reduced growth and reproductive output [5] . This research exposed three commercially harvested bivalve species to a range of polyethylene microplastic concentrations for 28 days and measured filtration rate, tissue accumulation, and histological changes at the Pacific Institute of Marine Biology, Victoria, Canada [6] .
Reagents and Chemicals
Polyethylene microspheres (10-300 µm, density 0.96 g/cm³) were purchased from Cospheric LLC (Santa Barbara, CA, USA; Cat. No. CPMS-0.96). Nile Red fluorescent dye (Sigma-Aldrich, Cat. No. 72485) was used to stain particles for visualization. Bouin's fixative (Sigma-Aldrich, Cat. No. HT10132) and hematoxylin-eosin staining reagents (Thermo Fisher Scientific) were used for histological preparation. Filtered seawater (0.45 µm) served as the exposure medium.
Material and Methods
Material and Methods
Material
Adult specimens of M. edulis (n=120), C. gigas (n=120), and V. philippinarum (n=120) were collected from Esquimalt Lagoon, British Columbia, in April 2023 and acclimated for 14 days at the Pacific Institute of Marine Biology. Animals were held in aerated, filtered seawater at 13±0. 5
Methods
Bivalves were randomly assigned to six treatment groups (0, 10, 50, 100, 500, 1,000, and 5,000 particles/L) with 15 individuals per species per treatment. Exposure ran for 28 days with full water renewal every 48 hours. Filtration rate was measured weekly using a clearance rate method with Isochrysis galbana as the food alga [4] . At day 28, five animals per group were sacrificed for histological analysis of gill and digestive gland tissues. Sections (5 µm) were stained with H&E and examined under light microscopy. Microplastic burden in soft tissues was quantified after KOH digestion and vacuum filtration, with Nile Red fluorescence counting [7] . Data were analyzed using twoway ANOVA (species × concentration) with Tukey's HSD post-hoc test.
Quality Control
Procedural blanks were processed alongside every batch of tissue digestions to monitor airborne microplastic contamination. All labware was rinsed three times with filtered deionized water. Cotton laboratory coats were worn to reduce fiber shedding. Particle counts in blanks averaged 0.8±0.4 particles per sample and were subtracted from tissue counts.
Results
Table All three species showed significant dose-dependent reductions in filtration rate (p < 0.001). M. edulis was the most sensitive, losing 85.4% of baseline filtration at the highest concentration.
Discussion
The dose-dependent decline in filtration rate observed here matches patterns reported for M. edulis exposed to polystyrene beads [3] , but extends the finding to two additional species and to polyethylene-the most abundant polymer type in marine environments [8] . Histological changes in gill epithelia suggest that physical irritation from particle contact may trigger mucus overproduction, clogging the filtration apparatus and forcing valve closure [9] . The concentrations used in this research span both environmentally relevant levels (10-100 particles/L, typical of coastal waters [10] ) and elevated levels representing pollution hotspots. Even at 100 particles/L, filtration rate dropped by 17-27% depending on species-a reduction that, if sustained, could impair energy budgets over a reproductive season [5] . A limitation of this research is the use of pristine microspheres rather than weathered or biofilm-coated particles, which may behave differently during ingestion [11] .
Conclusion
This research demonstrated that polyethylene microplastic exposure at concentrations ranging from 10 to 5,000 particles per liter significantly reduced filtration rates in three commercially important bivalve species over 28 days. M. edulis was the most sensitive species, while C. gigas showed moderate tolerance at lower concentrations. Gill histopathology confirmed physical tissue damage at higher exposure levels. These results indicate that current coastal microplastic levels may already be affecting bivalve feeding performance, with potential consequences for aquaculture productivity and ecosystem filtration services.
Acknowledgement
Acknowledgements Funding SourcesThis research was supported by the Pacific Institute of Marine Biology internal research fund. Institutional SupportThe authors thank the Department of Marine Ecology for laboratory and mesocosm facilities. Contributions Not Qualifying for AuthorshipField collection was assisted by graduate students in the Marine Invertebrate Ecology program.
Figures and tables from the paper
| Species | 0 p/L | 10 p/L | 100 p/L | 500 p/L | 1000 p/L | 5000 p/L |
|---|---|---|---|---|---|---|
| M. edulis | 4.81±0.31 | 4.58±0.28 | 3.52±0.41 | 2.31±0.38 | 1.42±0.29 | 0.70±0.22 |
| C. gigas | 3.94±0.27 | 3.81±0.33 | 3.19±0.29 | 2.47±0.42 | 1.83±0.31 | 1.12±0.26 |
| V. philippinarum | 3.12±0.24 | 2.98±0.21 | 2.61±0.32 | 1.87±0.28 | 1.24±0.23 | 0.83±0.19 |
Table text extracted from the original PDF; superscript letters are shown inline. The original table image is below.
View original table image
References
14 in the original paper- Eriksen M, Lebreton LCM, Carson HS. Plastic pollution in the world's oceans: more than 5 trillion plastic pieces weighing over 250000 tons afloat at sea. PLoS ONE. 2014;9(12):e111913.
- Ward JE, Shumway SE. Separating the grain from the chaff: particle selection in suspension-and depositfeeding bivalves. Journal of Experimental Marine Biology and Ecology. 2004;300(1-2):83-130.
- Wegner A, Besseling E, Foekema EM. Effects of nanopolystyrene on the feeding behavior of the blue mussel (Mytilus edulis L.). Environmental Toxicology and Chemistry. 2012;31(11):2490-2497.
- Coughlan J. The estimation of filtering rate from the clearance of suspensions. Marine Biology. 1969;2(4):356-358.
- Sussarellu R, Suquet M, Thomas Y. Oyster reproduction is affected by exposure to polystyrene microplastics. Proceedings of the National Academy of Sciences. 2016;113(9):2430-2435.
- Li J, Lusher AL, Rotchell JM. Using mussel as a global bioindicator of coastal microplastic pollution. Environmental Pollution. 2019;244:522-533.
- Maes T, Jessop R, Wellner N. A rapid-screening approach to detect and quantify microplastics based on fluorescent tagging with Nile Red. Scientific Reports. 2017;7:44501.
- Andrady AL. Microplastics in the marine environment. Marine Pollution Bulletin. 2011;62(8):1596-1605.
- Von Moos N, Burkhardt-Holm P, Koehler A. Uptake and effects of microplastics on cells and tissue of the blue mussel Mytilus edulis L. after an experimental exposure. Environmental Science and Technology. 2012;46(20):11327-11335.
- Lusher AL, Tirelli V, O'Connor I. Microplastics in Arctic polar waters: the first reported values of particles in surface and sub-surface samples. Scientific Reports. 2015;5:14947.
- Rummel CD, Jahnke A, Gorokhova E. Impacts of biofilm formation on the fate and potential effects of microplastic in the aquatic environment. Environmental Science and Technology Letters. 2017;4(7):258-267.
- Browne MA, Dissanayake A, Galloway TS. Ingested microscopic plastic translocates to the circulatory system of the mussel, Mytilus edulis (L.). International Journal of Biology Sciences https://www.biologyjournal.net Environmental Science and Technology. 2008;42(13):5026-5031.
- Van Cauwenberghe L, Claessens M, Vandegehuchte MB. Microplastics are taken up by mussels (Mytilus edulis) and lugworms (Arenicola marina) living in natural habitats. Environmental Pollution. 2015;199:1017.
- Cole M, Lindeque P, Halsband C. Microplastics as contaminants in the marine environment: a review. Marine Pollution Bulletin. 2011;62(12):2588-2597.