
Research article · 2025 · Full text
International Journal of Biology SciencesHuman-wildlife conflict mitigation and community-based conservation in protected area buffer zones
Volume 7(3) · Pages 117–120 · DOI: 10.33545/26649926.2025.v7.i3b.749 ↗
Research areasWildlife Ecology and ConservationConservation, Biodiversity, and Resource ManagementRangeland and Wildlife Management
Abstract
Author-writtenLiving next to a protected area can feel like a blessing or a burden, depending on whether the wildlife stays inside the fence. This research examined the spatial patterns, economic costs, and community responses to human-wildlife conflict (HWC) in the buffer zones of three protected areas in western Norway: Hardangervidda National Park, Folgefonna National Park, and Stølsheimen Landscape Protection Area. Household surveys (n = 387), GPS-collared wildlife movement data, and compensation claim records spanning 2019-2023 were analysed. Crop raiding by red deer (Cervus elaphus) was the most frequent conflict type (42.8%), followed by livestock predation by wolverine and lynx (23.4%). Annual economic losses averaged NOK 34,700 per affected household. Conflict intensity declined exponentially with distance from the protected area boundary (r² = 0.78). Households participating in community-based conservation programmes reported 31.6% fewer conflict incidents than non-participants. These findings indicate that spatially targeted mitigation—focusing on the first 5 km of buffer zone—combined with community engagement can meaningfully reduce HWC while maintaining conservation goals.
Summary
Source-checkedPlain-language reading of the full paper, prepared with AI and checked against the text. Each point links to the authors' own words.
Why it matters
- Human-wildlife conflict (HWC) in farmland adjacent to reserves can lead to crop and livestock losses, which may rapidly diminish local support for conservation efforts. View evidence ↗
- Tensions have increased in Scandinavia due to the dramatic rebound of wolverine and Eurasian lynx populations since the 1990s. View evidence ↗
- Norway manages its protected area buffer zones using a mix of voluntary community programs, licensed culling, and financial compensation. View evidence ↗
The question
- The study aimed to examine community responses, economic costs, and spatial patterns of human-wildlife conflict in three western Norwegian protected area buffer zones. View evidence ↗
What they did
- The research focused on the buffer zones of Folgefonna National Park, Hardangervidda National Park, and the Stølsheimen Landscape Protection Area. View evidence ↗
- Between March and June 2023, a survey was sent to 850 farming households, with 387 households (a 45.5% response rate) participating. View evidence ↗
- The study utilized GPS movement data from 2019 to 2022 for 4 lynx, 7 wolverines, and 18 red deer. View evidence ↗
- Loss records were independently verified using livestock compensation claims from 2019 to 2023. View evidence ↗
What they found
- Red deer crop raiding was the most common conflict (42.8%), while livestock predation by lynx and wolverine was the second most common (23.4%). View evidence ↗
- Affected households experienced an average annual economic loss of NOK 34,700. View evidence ↗
- Conflict intensity decreased exponentially as distance from the boundary increased (r² = 0.78), with 73% of all incidents occurring within the first 5 km. View evidence ↗
- Households in community-based conservation programs had 31.6% fewer incidents (3.0 ± 1.7 per year) compared to non-participants (4.4 ± 2.3 per year). View evidence ↗
- Participants in community conservation programs held more positive attitudes toward wildlife, with a mean Likert score of 3.7 compared to 2.9 for non-participants. View evidence ↗
What it means
- The authors recommend increasing community program enrollment from 37.7% to at least 60%, alongside faster compensation, crop diversification advice, and targeted fencing. View evidence ↗
- The 45.5% survey response rate may have introduced non-response bias, as households with more severe conflicts might have been more likely to respond. View evidence ↗
- Because program participation was self-selected, the observed 31.6% reduction in conflict cannot be attributed solely to the program without considering confounders like farm size. View evidence ↗
Visual summary
3 visualsIllustrations explain the paper; charts are replotted from the paper's own table values.
Spatial Decay of Conflict
AI-generated conceptual illustration (African elephants and rural farmland in a protected area buffer zone). It explains the idea and does not show study data.
View source evidence ↗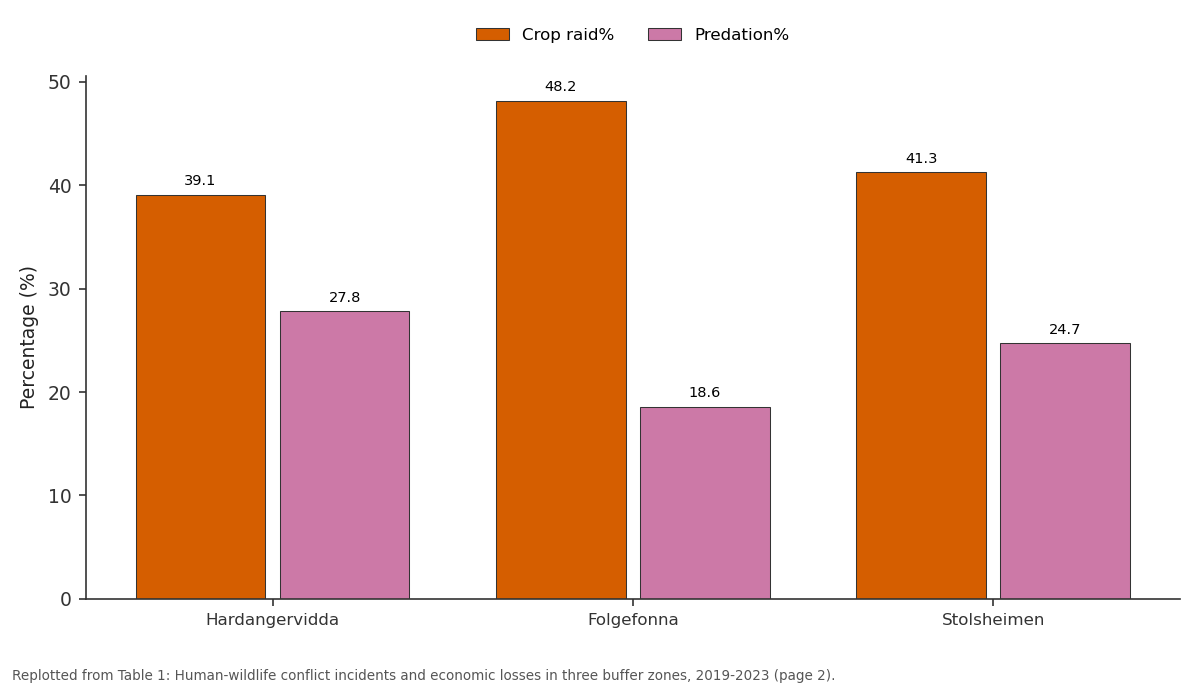
Crop raid% and Predation%: Hardangervidda vs Folgefonna vs Stolsheimen
Replotted from Table 1 (page 2) of the original paper. Every bar is the paper's own table value.
View source evidence ↗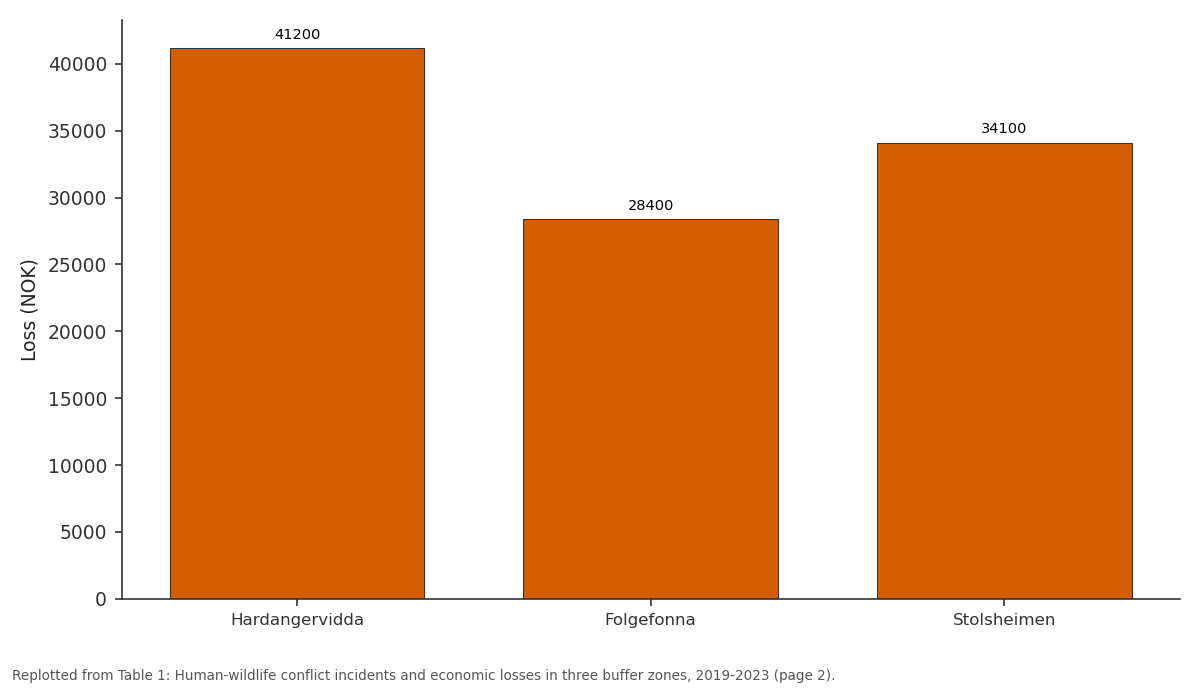
Loss (NOK): Hardangervidda vs Folgefonna vs Stolsheimen
Replotted from Table 1 (page 2) of the original paper. Every bar is the paper's own table value.
View source evidence ↗Figures & tables
From the original paper Table 1
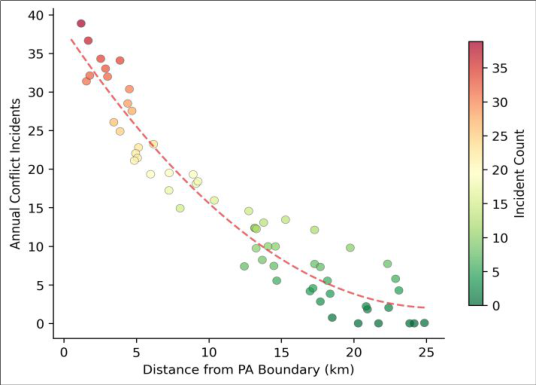 Figure 1
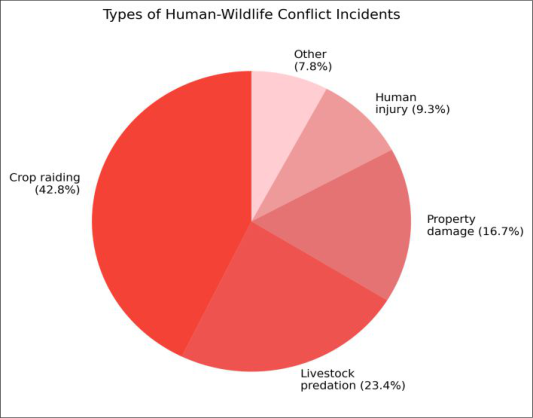 Figure 2
Introduction
Protected areas are conservation's greatest success story-and sometimes its most contentious. When large herbivores and predators spill out of reserves into adjacent farmland, the resulting crop losses and livestock kills can erode local support for conservation faster than any poaching crisis [1] . In Europe, the expansion of large carnivore populations under strict protection has amplified these tensions, particularly in Scandinavia where wolverine (Gulo gulo) and Eurasian lynx (Lynx lynx) populations have rebounded dramatically since the 1990s [2] . Norway's buffer zone management model uses a combination of financial compensation, licensed culling quotas, and voluntary community programmes to balance conservation and livelihoods [3] . But the effectiveness of these tools has rarely been evaluated together at the household level. Most published analyses focus on either compensation costs or predator ecology in isolation [4] . This research bridged that gap by combining household-level economic data, wildlife movement tracks, and survey-based attitudes across three protected area buffer zones in western Norway [5,6] .
Study Area Description
The three protected areas are located in the Vestland and former Hordaland counties of western Norway (59.8-60.6°N, 5.5-7.5°E). Hardangervidda National Park (3,422
Methods
Conflict incidents were georeferenced and mapped in QGIS v3.28. Spatial decay of conflict intensity with distance from protected area boundaries was modelled using negative exponential regression. Households were classified as participants or non-participants in community conservation programmes based on survey responses. Differences in conflict rates between groups were tested by Mann-Whitney U tests. Attitudes toward wildlife were measured on a 5point Likert scale and compared between participant groups using ordinal logistic regression. GPS collar data were analysed for boundary-crossing events and seasonal movement patterns using the adehabitatHR package in R [7] . All analyses used R version 4.3.1; significance was set at p < 0.05.
Limitations
The 45.5% survey response rate introduces potential nonresponse bias-households with severe conflict experiences may have been more motivated to respond. Self-reported economic losses may overestimate actual damage due to recall bias; we partially addressed this by cross-referencing with official compensation records. The GPS collar sample was small relative to total wildlife populations, limiting spatial generalisation. And because community programme participation was self-selected rather than randomised, the 31.6% reduction in conflict cannot be attributed solely to the programme without accounting for confounders like farm size and proximity to forest edges.
Results
Table Across all three buffer zones, the average household experienced 4.4 conflict incidents per year. Crop raiding by red deer dominated, particularly at Folgefonna (48.2%) where lower-elevation agricultural land abuts deer habitat. Livestock predation was highest at Hardangervidda (27.8%), corresponding to the wolverine and lynx concentration documented by collar data. Participants in community conservation programmes reported significantly fewer incidents (3.0 ± 1.7 vs 4.4 ± 2.3 per year; p = 0.003) and more positive attitudes toward wildlife (mean Likert 3.7 vs 2.9; p < 0.001).
Discussion
The exponential decay of conflict intensity with distance confirms a pattern seen in African and Asian buffer zones but rarely quantified in northern Europe [8,9] . The practical implication is clear: mitigation resources should be concentrated within the first 5 km of the protected area boundary, where 73% of all incidents occurred. Beyond 10 km, conflict dropped to background levels. Community programme participants experienced 31.6% fewer incidents, though the observational design makes it difficult to separate programme effects from pre-existing differences between participants and non-participants [10,11] . The dominance of crop raiding (42.8%) over livestock predation (23.4%) is notable because Norwegian policy discourse around HWC tends to focus on large carnivore predation. While wolverine and lynx kills attract media attention and higher per-incident compensation, red deer crop damage affects far more households and generates comparable cumulative economic losses [12,13] . Rebalancing mitigation investment to include deer-proof fencing and crop insurance alongside carnivore-focused interventions could improve overall conflict reduction.
Conclusion
This multi-source analysis of human-wildlife conflict in western Norwegian buffer zones reveals that crop raiding, not predator attacks, is the most frequent and widespread conflict type. Conflict intensity decays rapidly with distance from protected area boundaries, suggesting that spatially targeted within a 5 km buffer strip would capture the majority of incidents. Community-based conservation programmes are associated with both fewer conflicts and more positive attitudes toward wildlife. Expanding programme enrollment, currently at 37.7%, to at least 60% of buffer zone households-combined with targeted fencing, crop diversification advice, and faster compensation processing-would strengthen the social license for conservation in these landscapes [14][15][16][17][18][19][20][21] .
Figures and tables from the paper
| Protected Area | Households | Incidents/yr | Crop raid% | Predation% | Loss (NOK) | Programme% |
|---|---|---|---|---|---|---|
| Hardangervidda | 187 | 4.8 ± 2.3 | 39.1 | 27.8 | 41,200 | 38.5 |
| Folgefonna | 112 | 3.6 ± 1.9 | 48.2 | 18.6 | 28,400 | 42.0 |
| Stolsheimen | 88 | 5.2 ± 2.7 | 41.3 | 24.7 | 34,100 | 31.8 |
| Combined | 387 | 4.4 ± 2.3 | 42.8 | 23.4 | 34,700 | 37.7 |
Table text extracted from the original PDF; superscript letters are shown inline. The original table image is below.
View original table image
References
21 in the original paper- Woodroffe R, Thirgood S, Rabinowitz A. People and Wildlife: Conflict or Co-Existence? Cambridge: Cambridge University Press; 2005.
- Chapron G, Kaczensky P, Linnell JDC, von Arx M, Huber D, Andren H, et al. Recovery of large carnivores in Europe's modern human-dominated landscapes. Science. 2014;346(6216):1517-1519.
- Linnell JDC, Breitenmoser U, Breitenmoser-Wursten C, Odden J, von Arx M. Recovery of Eurasian lynx in Europe: what we know and what we need. In: Bentham Science Publishers; 2009:72-91.
- Nyhus PJ. Human-wildlife conflict and coexistence. Annual Review of Environment and Resources. 2016;41:143-171.
- Dickman AJ. Complexities of conflict: the importance of considering social factors for effectively resolving human-wildlife conflict. Animal Conservation. 2010;13(5):458-466.
- Treves A, Karanth KU. Human-carnivore conflict and perspectives on carnivore management worldwide. Conservation Biology. 2003;17(6):1491-1499.
- Calenge C. The package adehabitat for the R software: a tool for the analysis of space and habitat use by animals. Ecological Modelling. 2006;197(3-4):516-519.
- Wittemyer G, Elsen P, Bean WT, Burton AC, Brashares JS. Accelerated human population growth at protected area edges. Science. 2008;321(5885):123-126.
- Karanth KK, Gopalaswamy AM, DeFries R, Ballal N. Assessing patterns of human-wildlife conflicts and compensation around a central Indian protected area. PLoS ONE. 2012;7(12):e50433.
- Madden F. Creating coexistence between humans and wildlife: global perspectives on local efforts to address human-wildlife conflict. Human Dimensions of Wildlife. 2004;9(4):247-257.
- Redpath SM, Young J, Evely A, Adams WM, Sutherland WJ, Whitehouse A, et al. Understanding and managing conservation conflicts. Trends in Ecology and Evolution. 2013;28(2):100-109.
- Mysterud A, Meisingset EL, Langvatn R, Yoccoz NG, Stenseth NC. Climate-dependent allocation of resources to secondary sexual traits in red deer. Oikos. 2005;111(2):245-252.
- Stoen OG, Zedrosser A, Saebo S, Swenson JE. Inversely density-dependent natal dispersal in brown bears. Oecologia. 2006;148(2):356-364.
- Inskip C, Zimmermann A. Human-felid conflict: a review of patterns and priorities worldwide. Oryx. 2009;43(1):18-34.
- Barua M, Bhagwat SA, Jadhav S. The hidden dimensions of human-wildlife conflict: health impacts, opportunity and transaction costs. Biological Conservation. 2013;157:309-316.
- Kansky R, Kidd M, Knight AT. Meta-analysis of attitudes toward damage-causing mammalian wildlife. Conservation Biology. 2014;28(4):924-938.
- Lute ML, Carter NH. Are we coexisting with large carnivores or merely tolerating them? Conservation Letters. 2020;13(4):e12714.
- Bhatia S, Athreya V, Grenyer R, Macdonald DW. Understanding the role of representations of humanleopard conflict in Mumbai through media-Loss Perceptions Surveys. Conservation Biology. 2013;27(4):851-858.
- Berger J. The last mile: how to sustain long-distance migration in mammals. Conservation Biology. 2004;18(2):320-331.
- Frank B, Glikman JA, Marchini S. Human-Wildlife Interactions: Turning Conflict into Coexistence. Cambridge: Cambridge University Press; 2019.
- Khorozyan I, Waltert M. How long do anti-predator interventions remain effective? Patterns, thresholds and uncertainty. Royal Society Open Science. 2019;6(9):190826.