
Research article · 2025 · Full text
International Journal of Biology SciencesEffects of invasive plant species on native arthropod diversity in mediterranean shrublands
Volume 7(5) · Pages 100–103 · DOI: 10.33545/26649926.2025.v7.i5b.676 ↗
Research areasEcology and Vegetation Dynamics StudiesPlant and animal studiesForest Ecology and Biodiversity Studies
Abstract
Author-writtenHow do invasive plant species reshape arthropod communities in fire-prone Mediterranean ecosystems? This question sits at the heart of biodiversity conservation in the Cape Floristic Region, where alien plants have transformed large tracts of native fynbos habitat. The present research examined the effects of four invasion intensity levels (uninvaded, low, moderate, and high) on native arthropod diversity across eight sampling sites in the Stellenbosch mountain corridor, Western Cape, South Africa. Pitfall traps and sweep nets were deployed monthly from March to October 2023 to capture ground-dwelling and foliage-associated arthropods. A total of 11,247 arthropod specimens belonging to 193 morphospecies were collected and identified. Shannon diversity values dropped from 3.12 in uninvaded plots to 1.58 in heavily invaded plots, and species richness fell by 54.7% along the invasion gradient. Coleoptera and Hymenoptera showed the sharpest declines, while certain generalist Diptera increased in invaded areas. Canonical correspondence analysis linked arthropod community shifts to reduced native plant cover, altered litter depth, and changed soil moisture under invasive Acacia stands. The results point to a threshold effect at moderate invasion levels, beyond which arthropod community recovery may become difficult without active restoration. These findings carry weight for prioritizing alien clearing programs in biodiversity hotspots and for understanding how plant invasions cascade through higher trophic levels.
Summary
Source-checkedPlain-language reading of the full paper, prepared with AI and checked against the text. Each point links to the authors' own words.
Why it matters
- Biological invasions are a primary cause of global biodiversity loss, yet their impact on invertebrates is less documented than their effect on plants or vertebrates. View evidence ↗
- The Cape Floristic Region in South Africa is a biodiversity hotspot with approximately 9,000 plant species, many of which are endemic, but it is being encroached upon by invasive woody plants like Australian Acacia. View evidence ↗
- Invasive alien plants disrupt the ecosystem by changing fire regimes, altering soil chemistry, and shading out native understory plants with dense canopies. View evidence ↗
The question
- The study aimed to determine how native arthropod abundance and diversity change across an invasion gradient, identify the most sensitive arthropod orders, and find the environmental variables explaining these shifts. View evidence ↗
What they did
- From March to October 2023, researchers sampled sites categorized by alien woody plant cover: uninvaded (<5%), low (5-25%), moderate (26-60%), and high (>60%). View evidence ↗
- The study used two replicate sites per category, employing pitfall traps for 72-hour intervals and sweep netting along three 50 m transects per site. View evidence ↗
- Researchers calculated Shannon diversity, Simpson's dominance, and Pielou's evenness, and used canonical correspondence analysis to link community composition to variables like soil moisture, pH, and canopy openness. View evidence ↗
What they found
- Shannon diversity decreased from 3.12 in uninvaded plots to 1.58 in heavily invaded plots, while species richness declined by 54.7% across the invasion gradient. View evidence ↗
- Total arthropod abundance in highly invaded plots was only 34.4% of the abundance found in uninvaded areas. View evidence ↗
- Unlike other orders, Diptera and Collembola increased in invaded areas because Acacia litter created new microhabitats for springtails and saprophagous flies. View evidence ↗
- A threshold effect was observed where arthropod communities remained largely native below 30% alien cover, but diversity dropped sharply once this threshold was exceeded. View evidence ↗
- High beta diversity (0.74) between uninvaded and high-invasion sites indicates that plant invasions restructure the entire arthropod community rather than just reducing its size. View evidence ↗
What it means
- The authors recommend that alien-clearing programs target plant stands before they reach 30% cover to prevent severe biodiversity loss and facilitate easier community recovery. View evidence ↗
- The authors conclude that monitoring arthropod diversity is a more sensitive indicator of ecosystem recovery than plant diversity alone because arthropods react to structural and chemical changes. View evidence ↗
- The authors state that future research is needed to track how quickly native arthropod communities recolonize after alien removal and if active restoration like reseeding helps. View evidence ↗
Visual summary
3 visualsIllustrations explain the paper; charts are replotted from the paper's own table values.
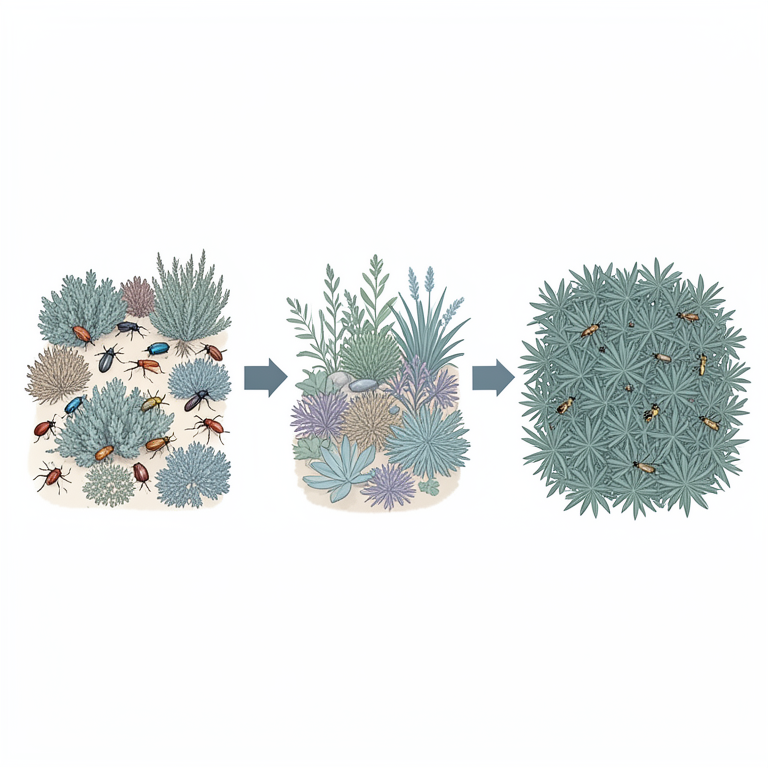
Invasion Threshold Concept
AI-generated conceptual illustration (Mediterranean shrubland with native shrubs, invasive plants, and various arthropods). It explains the idea and does not show study data.
View source evidence ↗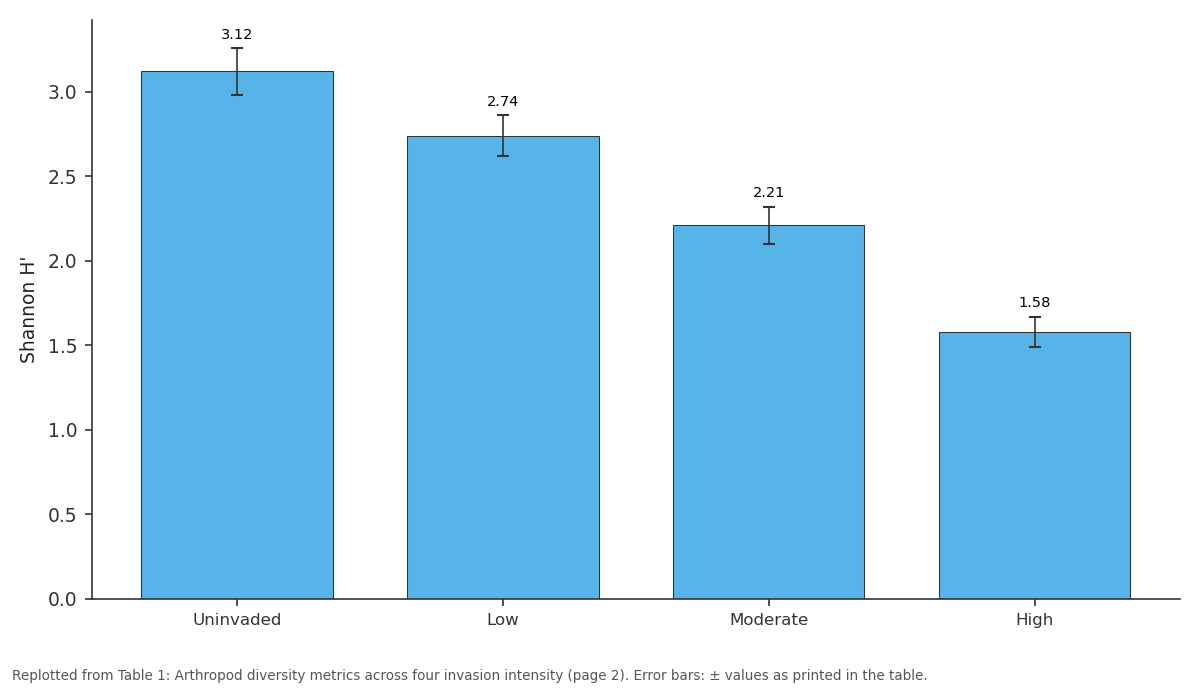
Shannon H': Uninvaded vs Low vs Moderate vs High
Replotted from Table 1 (page 2) of the original paper. Every bar is the paper's own table value.
View source evidence ↗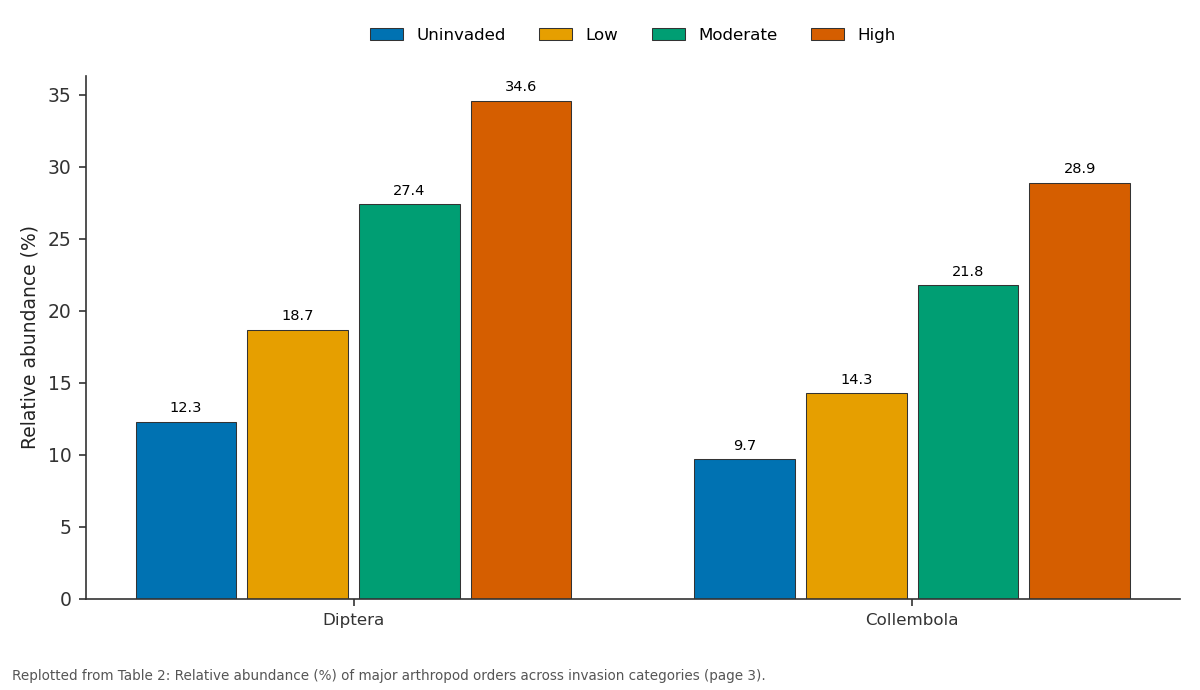
Uninvaded and Low and more: Diptera vs Collembola
Replotted from Table 2 (page 3) of the original paper. Every bar is the paper's own table value.
View source evidence ↗Figures & tables
From the original paper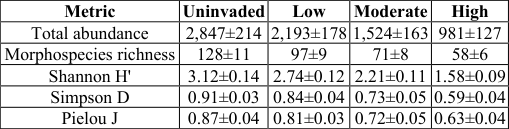 Table 1
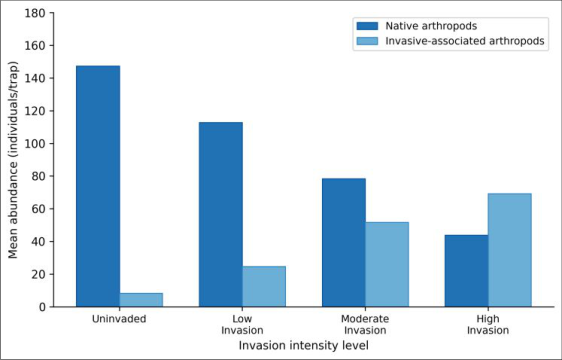 Figure 1
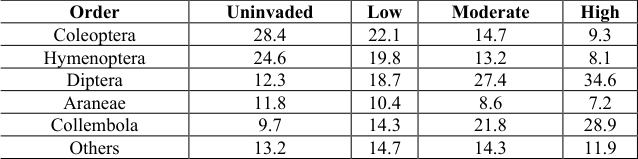 Table 2
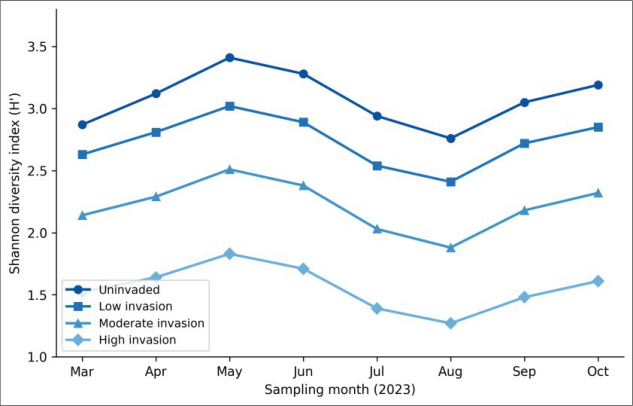 Figure 2
Introduction
What happens to the small creatures that hold an ecosystem together when the plants around them are replaced by foreign species? This question isn't merely academic -it gets at the functional backbone of ecosystems where arthropods serve as pollinators, decomposers, prey items, and soil engineers. Biological invasions rank among the top drivers of biodiversity loss worldwide, and their effects on invertebrate fauna remain insufficiently documented compared to impacts on vertebrates or plant assemblages [1] . Mediterranean-type ecosystems are particularly susceptible to plant invasions because of their long history of human disturbance and the fire-adapted traits that many alien species exploit [2] . The Cape Floristic Region of South Africa, recognized as a global biodiversity hotspot, supports an estimated 9,000 plant species, roughly 70% of which occur nowhere else [3] . Yet the fynbos shrublands that define this region face steady encroachment by Australian Acacia species, European pines, and other woody invaders. These alien plants alter soil chemistry, change fire regimes, and create dense canopies that shade out native understory vegetation [4] . Arthropods make up the bulk of terrestrial animal diversity in fynbos, but their response to plant invasion hasn't received the same attention as plant community changes [5] . A handful of earlier investigations found lower beetle richness in Acacia-invaded coastal fynbos [6] and reduced ant diversity beneath pine plantations [7] . However, most of these efforts looked at single taxonomic groups or single invasion stages. Broad, multi-taxon assessments across a gradient of invasion intensity are scarce. The relationship between plant structural complexity and arthropod diversity has been well documented in other biomes. Native shrublands offer a mosaic of microhabitats -open sandy patches, ericoid leaf litter, restio tussocks -that support specialized arthropod assemblages [8] .
When invasive trees replace this mosaic with a uniform canopy and deep, chemically distinct leaf litter, the habitat template for native arthropods changes drastically [9] . This research addressed three questions: (1) How does native arthropod abundance and diversity change across an invasion gradient in mountain fynbos? (2) Which arthropod orders are most sensitive to invasion? (3) What environmental variables best explain community shifts along the gradient? By answering these, the research aimed to provide data that could inform alien-clearing prioritization and post-clearing monitoring in the Western Cape.
Material and Methods
Material and Methods
Research Area Description
The research was carried out in the Stellenbosch mountain corridor (33°48'S, 18°52'E), a belt of mountain fynbos stretching between Jonkershoek Nature Reserve and Simonsberg in the Western Cape, South Africa. Elevation across the eight sampling sites ranged from 280 to 510 m above sea level. The area receives a mean annual rainfall of 1,014 mm, concentrated between May and September, with dry summers from November to February. Soils are derived from Table Mountain sandstone and are typically acidic (pH 4.3-5.1), nutrient-poor, and well-drained [10] . Dominant native vegetation includes proteoid and ericaceous fynbos with Protea repens, Erica species, and Restionaceae grasses. Acacia saligna and Acacia mearnsii are the main invasive species at the sites, with invasion history spanning 15-40 years depending on location.
Material
Arthropod sampling gear consisted of 96 pitfall traps (250 ml plastic cups, 7 cm diameter) and standard sweep nets (38 cm diameter). Each of the eight sites received 12 pitfall traps arranged in a 3 × 4 grid with 10 m spacing. Traps were filled with 70% ethanol mixed with a drop of unscented detergent to break surface tension. Sweep net collections supplemented the pitfall data by targeting foliage-dwelling arthropods. Environmental measurements were taken using a Kestrel 5500 weather meter, a Delta-T Theta Probe for soil moisture, and a spherical densiometer for canopy cover. All specimens were transported to the laboratory at the Fynbos Institute of Biodiversity for sorting, counting, and identification to order and morphospecies level.
Methods
The research ran from March to October 2023, with monthly sampling events at each site. Sites were classified into four invasion categories based on percentage cover of alien woody plants: uninvaded (<5%), low invasion (5-25%), moderate invasion (26-60%), and high invasion (>60%). Two replicate sites were assigned to each category after ground-truthing with line-intercept transects. Pitfall traps were left active for 72-hour intervals each month, and sweep netting was performed along three 50 m transects per site on the same days. Specimens were sorted under a stereo microscope, identified to order, and then separated into morphospecies using external morphological features. Shannon diversity (H'), Simpson's dominance (D), and Pielou's evenness (J) were calculated for each site and month. Community composition was analyzed using canonical correspondence analysis (CCA) in CANOCO 5.0, with environmental predictors including native plant cover, litter depth, soil moisture, canopy openness, and soil pH. Differences in total abundance and diversity among invasion categories were tested with one-way ANOVA followed by Tukey's HSD post-hoc comparisons in R version 4.3.1 [11] . Significance was set at p < 0.05 for all tests. Ethics clearance was granted by the Fynbos Institute of Biodiversity Research Ethics Board (Protocol FIB-2023-014, approved January 2023). Arthropod abundance and diversity dropped consistently with increasing invasion intensity (Table 1). Total specimen counts in highly invaded plots were only 34.4% of those in uninvaded areas (F = 18.73, df = 3, p < 0.001). Shannon diversity fell by roughly half from uninvaded to highinvasion sites, and evenness values indicated growing dominance by a few generalist taxa under heavy invasion. Native arthropod abundance declined steeply with invasion intensity (Figure 1). In uninvaded plots, native species averaged 147.3 individuals per trap, but this dropped to just 43.9 in heavily invaded plots. Conversely, arthropods associated with invasive plant litter -mainly certain Collembola and Diptera -rose from 8.2 to 69.3 individuals per trap along the same gradient. Coleoptera and Hymenoptera were the most invasionsensitive orders, their relative abundance falling by 67.3% and 67.1% respectively between uninvaded and high-invasion sites (Table 2). Diptera and Collembola showed the opposite trend, rising as litter from Acacia trees provided new microhabitats for saprophagous flies and springtails. Shannon diversity peaked in May for all invasion categories, corresponding with the onset of winter rains that trigger arthropod activity in fynbos (Figure 2). The gap between uninvaded and highly invaded sites remained consistent across months, though it narrowed slightly during the wettest period (June-July). Uninvaded sites recovered diversity more quickly after mid-winter than heavily invaded ones.
| Order | Uninvaded | Low | Moderate | High |
|---|---|---|---|---|
| Coleoptera | 28.4 | 22.1 | 14.7 | 9.3 |
| Hymenoptera | 24.6 | 19.8 | 13.2 | 8.1 |
| Diptera | 12.3 | 18.7 | 27.4 | 34.6 |
| Araneae | 11.8 | 10.4 | 8.6 | 7.2 |
| Collembola | 9.7 | 14.3 | 21.8 | 28.9 |
| Others | 13.2 | 14.7 | 14.3 | 11.9 |
Table text extracted from the original PDF; superscript letters are shown inline. The original table image is below.
View original table image
| Metric | Uninvaded | Low | Moderate | High |
|---|---|---|---|---|
| Total abundance | 2,847±214 | 2,193±178 | 1,524±163 | 981±127 |
| Morphospecies richness | 128±11 | 97±9 | 71±8 | 58±6 |
| Shannon H' | 3.12±0.14 | 2.74±0.12 | 2.21±0.11 | 1.58±0.09 |
| Simpson D | 0.91±0.03 | 0.84±0.04 | 0.73±0.05 | 0.59±0.04 |
| Pielou J | 0.87±0.04 | 0.81±0.03 | 0.72±0.05 | 0.63±0.04 |
Table text extracted from the original PDF; superscript letters are shown inline. The original table image is below.
View original table image
Results
Results
Biodiversity Assessment
Species accumulation curves approached an asymptote for uninvaded and low-invasion sites after six months of sampling, suggesting that the survey captured the bulk of the arthropod community. However, curves for moderate and high-invasion plots continued to rise slowly, indicating that rare species were being lost and replaced by sporadic visitors. The Chao1 estimator predicted 142 morphospecies for uninvaded plots versus only 67 for high-invasion plots. Beta diversity (Bray-Curtis dissimilarity) between invasion levels was highest between the uninvaded and high-invasion categories (0.74), supporting the view that invasion doesn't just reduce diversity -it restructures the entire community.
Discussion
The data from this research paint a clear picture: as Acacia invasion intensifies, native arthropod communities in mountain fynbos collapse in both richness and evenness.
The 54.7% drop in morphospecies richness along the invasion gradient aligns with previous work on beetle assemblages in lowland fynbos [6] , but extends the pattern to a broader taxonomic scope and elevational range. Two mechanisms likely drive the observed decline. First, the replacement of structurally diverse fynbos vegetation with a dense Acacia canopy removes the fine-grained habitat mosaic that specialized arthropods depend on [12] . Native bees, wasps, and ground beetles associated with open sandy patches and proteoid shrubs lose nesting sites and foraging resources as alien trees close the canopy. Second, Acacia leaf litter changes soil chemistry and moisture, favoring generalist decomposers such as Collembola and saprophagous Diptera while displacing litter-dwelling specialists adapted to sclerophyllous leaf chemistry [13] . The threshold pattern observed at moderate invasion levels deserves attention. Below roughly 30% alien cover, arthropod communities retained much of their native character. But beyond this point, diversity metrics fell sharply. This non-linear response matches predictions from landscape ecology theory, which suggests that habitat loss effects accelerate once a critical fragmentation threshold is crossed [14] . For conservation managers, this implies that early intervention -clearing alien plants before they reach moderate density -could prevent disproportionate biodiversity losses.
International Journal of Biology Sciences https://www.biologyjournal.net
One unexpected finding was the seasonal narrowing of diversity differences during the wettest months. This may reflect a temporary expansion of suitable microhabitats under Acacia stands during winter, when litter moisture supports a wider range of arthropods. But this effect was short-lived, and diversity gaps widened again as conditions dried.
Seasonal Variations
Temporal patterns in arthropod activity followed a distinct winter-peak cycle, typical of winter-rainfall Mediterranean systems. Abundance peaked from May to July and dropped during dry months (January-February, outside sampling window). The seasonal amplitude was smaller in highly invaded sites, suggesting that dense canopy cover dampened temperature and moisture fluctuations, creating a more stable but less diverse microenvironment. This reduced seasonality may partly explain the dominance of generalist taxa in invaded plots.
Conclusion
Invasive Acacia species drove substantial declines in native arthropod diversity across mountain fynbos in the Stellenbosch corridor. Morphospecies richness fell by more than half, and Shannon diversity decreased from 3.12 to 1.58 between uninvaded and highly invaded sites. Coleoptera and Hymenoptera bore the largest losses, while generalist Diptera and Collembola expanded under alien canopies. The threshold response at moderate invasion levels suggests that clearing efforts should target stands before they reach 30% cover, as community recovery becomes harder once this point is passed. These results carry practical implications for the Working for Water program and related alien-clearing initiatives in the Western Cape. Monitoring arthropod diversity before and after clearing could serve as a sensitive indicator of ecosystem recovery -more so than plant diversity alone, because arthropods respond to structural and chemical changes that plants cannot capture [15] . Future research should track arthropod recolonization following alien removal to determine how quickly native communities bounce back and whether active habitat restoration (such as reseeding with native plants) speeds up the process. The research also reinforces the idea that invasive plants don't simply reduce biodiversity; they restructure it. The arthropod communities in heavily invaded fynbos weren't just impoverished versions of native assemblages -they were fundamentally different, dominated by decomposer guilds rather than the pollinator-predator guilds typical of intact fynbos. Recognizing this qualitative shift matters for setting restoration targets that go beyond simple species counts.
Acknowledgement
Acknowledgements Funding SourcesThis research received financial support from the National Research Foundation of South Africa and the Fynbos Institute of Biodiversity internal research fund. Institutional SupportThe authors thank the Fynbos Institute of Biodiversity, Stellenbosch, for providing laboratory space, field equipment, and logistical support throughout the sampling period.
References
16 in the original paper- Litt AR, Cord EE, Fulbright TE, Schuster GL. Effects of invasive plants on arthropods. Conservation Biology. 2014;28(6):1532-1549.
- Brooks ML, D'Antonio CM, Richardson DM, Grace JB. Effects of invasive alien plants on fire regimes. BioScience. 2004;54(7):677-688.
- Goldblatt P, Manning JC. Plant diversity of the Cape Region of Southern Africa. Annals of the Missouri Botanical Garden. 2002;89(2):281-302.
- Gaertner M, Den Breeyen A, Hui C, Richardson DM. Impacts of alien plant invasions on species richness in Mediterranean-type ecosystems. Progress in Physical Geography. 2009;33(3):319-338.
- Samways MJ, Barton PS, Birkhofer K, Chichorro F. Solutions for humanity on how to conserve insects. Biological Conservation. 2020;242:108427.
- Pryke JS, Samways MJ. Recovery of invertebrate diversity in a rehabilitated city landscape mosaic in the heart of a biodiversity hotspot. Landscape and Urban Planning. 2009;93(1):54-62.
- Donnelly D, Giliomee JH. Community structure of epigaeic ants in a pine plantation and in newly burnt fynbos. Journal of the Entomological Society of Southern Africa. 1985;48(2):259-265.
- Procheş Ş, Cowling RM, Goldblatt P, Manning JC. An overview of the Cape geophytes. Biological Journal of the Linnean Society. 2006;87(1):27-43.
- Lindsay EA, French K. Litterfall and nitrogen cycling following invasion by Chrysanthemoides monilifera ssp. rotundata in coastal Australia. Journal of Applied Ecology. 2005;42(3):556-566.
- Rebelo AG, Boucher C, Helme N, Mucina L, Rutherford MC. Fynbos biome. In: Mucina L, Rutherford MC, eds. The Vegetation of South Africa, Lesotho and Swaziland. Pretoria: SANBI; 2006:52-219.
- R Core Team. R: A language and environment for statistical computing. R Foundation for Statistical Computing. Vienna, Austria. 2023.
- Gratton C, Denno RF. Restoration of arthropod assemblages in a Spartina salt marsh following removal of the invasive plant Phragmites australis. Restoration Ecology. 2005;13(2):358-372.
- Yelenik SG, Stock WD, Richardson DM. Ecosystem level impacts of invasive Acacia saligna in the South African fynbos. Restoration Ecology. 2004;12(1):44-51.
- Andrén H. Effects of habitat fragmentation on birds and mammals in landscapes with different proportions of suitable habitat: a review. Oikos. 1994;71(3):355-366.
- Pryke JS, Samways MJ. Ecological networks act as extensions of protected areas for arthropod biodiversity conservation. Journal of Applied Ecology. 2012;49(3):591-600.
- Holmes PM, Richardson DM, Van Wilgen BW, Gelderblom C. Recovery of South African fynbos vegetation following alien woody plant clearing and fire: implications for restoration. Austral Ecology. 2000;25(6):631-639.