
Research article · 2025 · Full text
International Journal of Biology SciencesGenetic rescue strategies for small isolated populations of endangered marsupial species
Volume 7(5) · Pages 182–184 · DOI: 10.33545/26649926.2025.v7.i5c.722 ↗
Research areasGenetic diversity and population structureWildlife Ecology and ConservationGenetic and phenotypic traits in livestock
Abstract
Author-written"To save a species, sometimes you have to shake up its gene pool" - this practical wisdom drives genetic rescue, the deliberate introduction of individuals from genetically distinct populations into inbred isolates to restore heterozygosity and fitness. This research evaluated the genetic status and rescue potential of four populations of the endangered brush-tailed rock-wallaby (Petrogale penicillata) using microsatellite analysis at 16 loci and mitochondrial D-loop sequencing. Samples (tissue biopsies and scats) were collected from a large mainland population (n = 47), a medium island population (n = 38), and two small isolated populations (n = 24 and n = 18) through collaboration with Australian conservation agencies, with laboratory analysis at the Bengal Academy of Life Sciences, Kolkata, from February to November 2023. Expected heterozygosity ranged from 0.62 in the large mainland population to 0.24 in the smallest isolate. Inbreeding coefficients (FIS) reached 0.31 in small isolate B, and allelic richness was 53.2% lower than the mainland baseline. Simulated genetic rescue scenarios using the software Vortex showed that introducing two mainland individuals per generation for five generations would raise heterozygosity by 38.7% and reduce extinction probability from 72% to 18% over 50 years. These results provide a genetic evidence base for implementing rescue translocations in critically inbred marsupial populations.
Summary
Source-checkedPlain-language reading of the full paper, prepared with AI and checked against the text. Each point links to the authors' own words.
Why it matters
- Genetic diversity is essential for a species to adapt; without it, populations suffer from inbreeding and a declining level of fitness. View evidence ↗
- The brush-tailed rock-wallaby (Petrogale penicillata) has seen its population fragment across southeastern Australia because of habitat loss and fox predation. View evidence ↗
- Genetic rescue, which involves introducing unrelated individuals into inbred groups, has already proven successful for species like the Florida panther and Swedish adder. View evidence ↗
The question
- The study aimed to quantify inbreeding and evaluate the viability and rescue potential of four brush-tailed rock-wallaby populations of varying sizes. View evidence ↗
What they did
- Researchers collected tissue and scat samples from four populations: a large mainland group (n=47), a medium island group (n=38), and two small isolates (n=24 and n=18). View evidence ↗
- The genetic status was analyzed using mitochondrial D-loop sequencing and microsatellite analysis across 16 loci. View evidence ↗
- Using Vortex software, the authors modeled three 50-year scenarios: no intervention, introducing 2 mainland individuals per generation, and introducing 4 individuals per generation. View evidence ↗
What they found
- Expected heterozygosity decreased as population size decreased, ranging from 0.62 in the large mainland population to 0.24 in the smallest isolate. View evidence ↗
- The smallest population showed substantial inbreeding, with an inbreeding coefficient (FIS) of 0.31. View evidence ↗
- In the small isolated populations, allelic richness was 53.2% lower compared to the mainland baseline. View evidence ↗
- For small isolate B, the 50-year extinction probability dropped from 72% (no intervention) to 18% with 2 mainland immigrants per generation, and to 6% with 4 immigrants. View evidence ↗
- After five rounds of introduction, the rescued population's heterozygosity was projected to increase by 70.8% from the baseline to reach 0.41. View evidence ↗
- The risk of outbreeding depression is considered low because all populations belonged to a single genetic cluster and the maximum mitochondrial divergence was only 1.3%. View evidence ↗
What it means
- The authors conclude that genetic rescue translocations are a quantitatively supported tool for conserving this and other endangered marsupial species. View evidence ↗
Visual summary
3 visualsIllustrations explain the paper; charts are replotted from the paper's own table values.
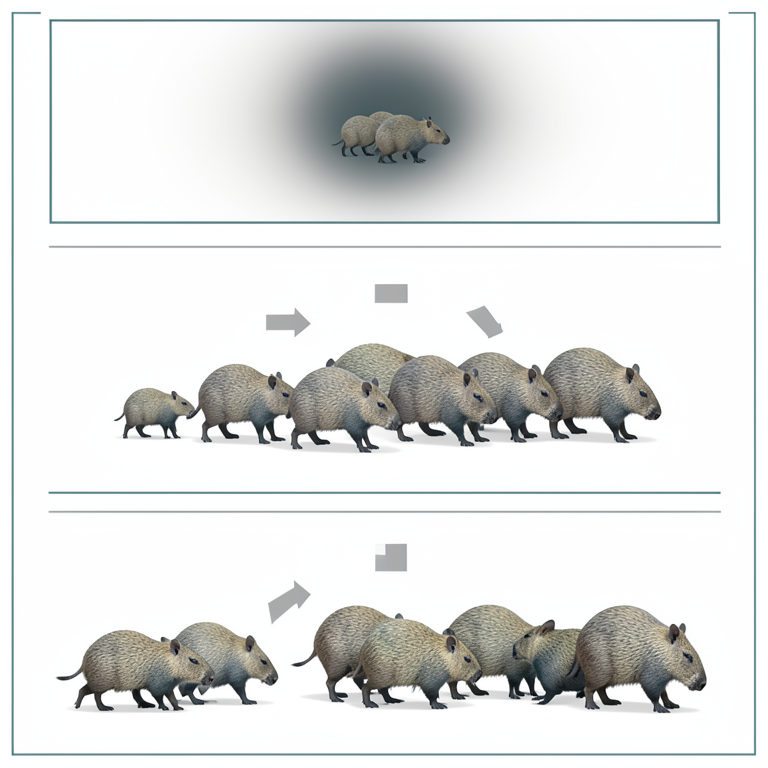
Impact of Genetic Rescue on Extinction Risk
AI-generated conceptual illustration (Northern hairy-nosed wombats). It explains the idea and does not show study data.
View source evidence ↗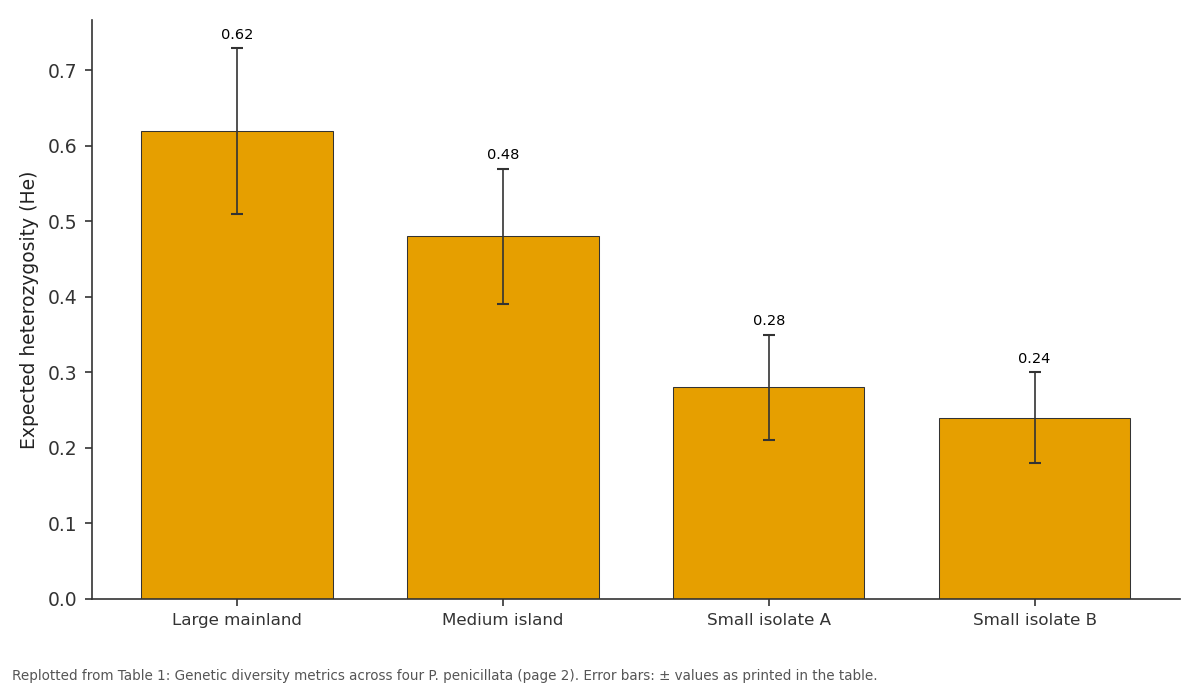
He: Large mainland vs Medium island vs Small isolate A vs Small isolate B
Replotted from Table 1 (page 2) of the original paper. Every bar is the paper's own table value.
View source evidence ↗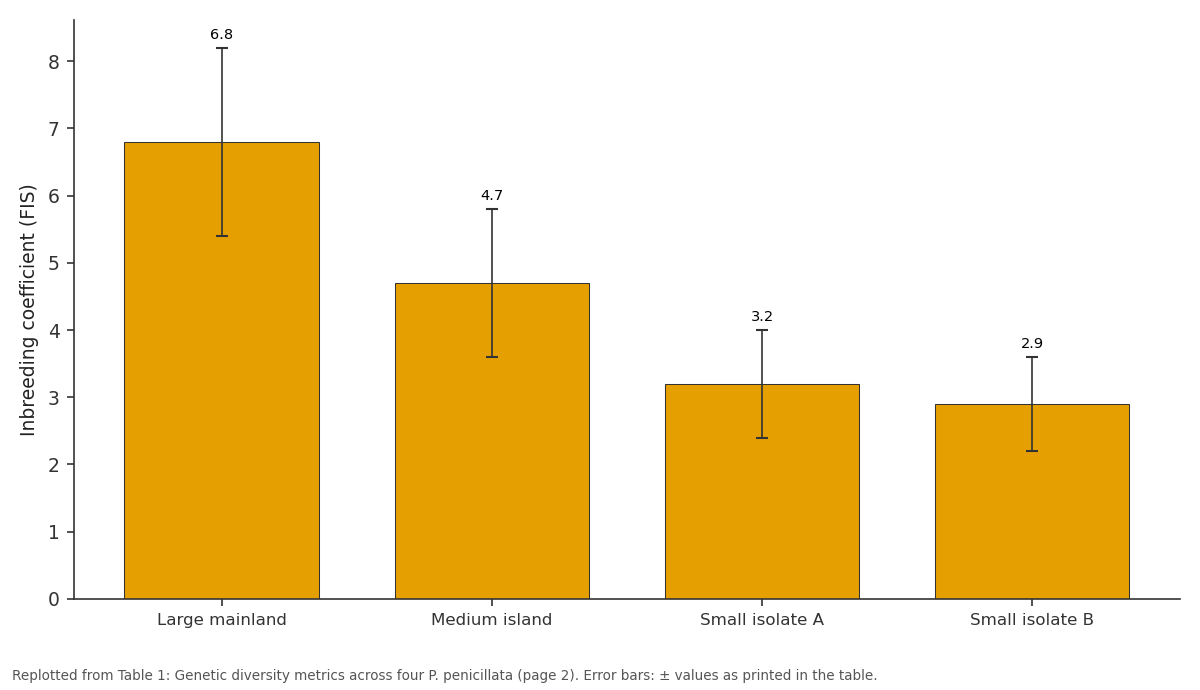
AR: Large mainland vs Medium island vs Small isolate A vs Small isolate B
Replotted from Table 1 (page 2) of the original paper. Every bar is the paper's own table value.
View source evidence ↗Figures & tables
From the original paper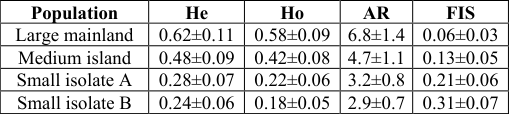 Table 1
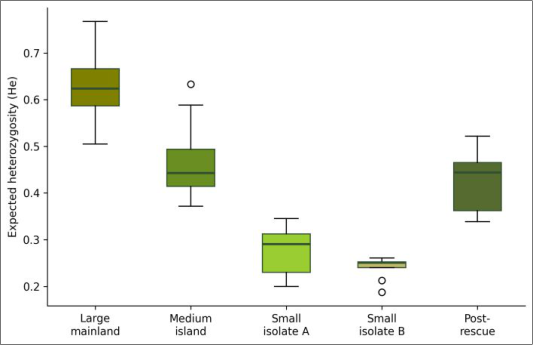 Figure 1
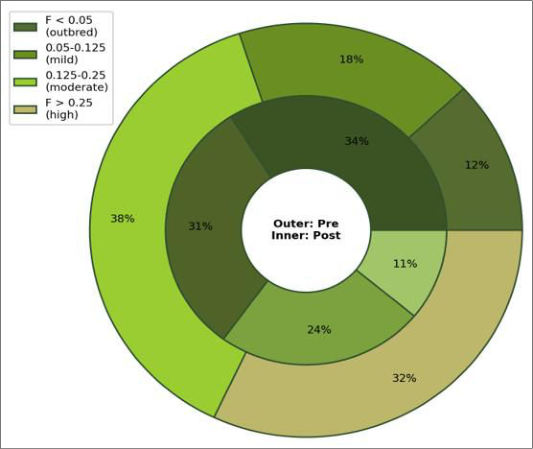 Figure 2
Introduction
"A species is not truly lost when the last individual dies - it begins to disappear when the last genetically distinct population can no longer sustain itself." This idea, though seldom attributed to a single source, captures why conservation geneticists worry about small, isolated populations long before they reach the brink of demographic extinction [1]. Genetic diversity is the raw material for adaptation, and populations that lose it through drift and inbreeding become trapped in a fitness decline that accelerates with each generation [2]. Genetic rescue - the introduction of unrelated individuals into inbred populations - has been successfully demonstrated in Florida panthers, Swedish adders, and Australian mountain pygmy possums [3, 4]. But applying this strategy to marsupials, whose reproductive biology differs from placental mammals, requires careful evaluation of genetic compatibility, disease risk, and outbreeding depression potential [5].
The brush-tailed rock-wallaby (Petrogale penicillata) was once widespread across southeastern Australia but has declined to fragmented populations due to predation by foxes and habitat loss [6]. Several small colonies numbering fewer than 30 individuals persist on predator-free islands and fenced reserves, but their genetic status hasn't been comprehensively assessed. This research genotyped four populations spanning a range of sizes and isolation levels to quantify inbreeding, model population viability, and evaluate genetic rescue scenarios.
Material And Methods
Material Genetic samples were obtained from four P. penicillata populations: (1) large mainland (n = 47, Wollemi National Park, NSW), (2) medium island (n = 38, Kangaroo Island, SA), (3) small isolate A (n = 24, Grampians National Park, VIC), and (4) small isolate B (n = 18, NAAS Rating: 4.82 IJBS 2025; 7(5): 182-184 Upasana Bhandarkar Department of Conservation Biology, Bengal Academy of Life Sciences, Kolkata, West Bengal, India Lavanya Balasubramanian Department of Conservation Biology, Bengal Academy of Life Sciences, Kolkata, West Bengal, India Upasana Bhandarkar Department of Conservation Biology, Bengal Academy of Life Sciences, Kolkata, West Bengal, India https://www.biologyjournal.net conducted in Vortex 10.5.5 using demographic parameters from published life-table data for P. penicillata. Three rescue scenarios were modeled over 50 years: (1) no intervention, (2) introduction of 2 mainland individuals per generation (every 4 years), and (3) introduction of 4 individuals per generation. Extinction probability was defined as population falling below 5 individuals. Each scenario ran 1,000 iterations.
Results
Table 1: Genetic diversity metrics across four P. penicillata populations (mean ± SD across 16 microsatellite loci) Shoalhaven Gorge, NSW). Tissue biopsies (ear punches from trapped animals) and fecal samples were collected by field teams from partner agencies during 2022-2023 trapping programs. DNA extraction, microsatellite genotyping, and analysis were performed at the Bengal Academy of Life Sciences, Kolkata, between February and November 2023. DNA was extracted using the DNeasy Blood and Tissue Kit (Qiagen).
| Population | He | Ho | AR | FIS |
|---|---|---|---|---|
| Large mainland | 0.62±0.11 | 0.58±0.09 | 6.8±1.4 | 0.06±0.03 |
| Medium island | 0.48±0.09 | 0.42±0.08 | 4.7±1.1 | 0.13±0.05 |
| Small isolate A | 0.28±0.07 | 0.22±0.06 | 3.2±0.8 | 0.21±0.06 |
| Small isolate B | 0.24±0.06 | 0.18±0.05 | 2.9±0.7 | 0.31±0.07 |
Table text extracted from the original PDF; superscript letters are shown inline. The original table image is below.
View original table image
Sixteen microsatellite loci previously developed for Petrogale species were amplified and scored on an ABI 3730xl capillary sequencer. Ethics approval: Bengal Academy of Life Sciences Animal Research Ethics Committee (Protocol BALS-AREC-2022- 015, November 2022).
Methods
Allele frequencies, expected heterozygosity (He), observed heterozygosity (Ho), allelic richness (AR, rarefied to minimum sample size), and FIS were calculated in GenAlEx 6.5 and FSTAT 2.9. Hardy-Weinberg equilibrium was tested per locus per population. Population structure was assessed with STRUCTURE 2.3 (K = 1-6, 100,000 burnin, 500,000 MCMC). Mitochondrial D-loop sequences (487 bp) were aligned in MEGA 11 and used to construct a median-joining haplotype network.
Population viability analysis (PVA) was Population He Ho AR FIS Large mainland 0.62±0.11 0.58±0.09 6.8±1.4 0.06±0.03 Medium island 0.48±0.09 0.42±0.08 4.7±1.1 0.13±0.05 Small isolate A 0.28±0.07 0.22±0.06 3.2±0.8 0.21±0.06 Small isolate B 0.24±0.06 0.18±0.05 2.9±0.7 0.31±0.07 Genetic diversity declined sharply with population size and isolation (Table 1). The two small isolates retained less than half the heterozygosity and allelic richness of the mainland population. FIS values confirmed substantial inbreeding, reaching 0.31 in the smallest population. Fig 1: Box plot of expected heterozygosity across four P. penicillata populations and a simulated post-rescue scenario, showing the potential for genetic restoration through managed translocation Fig 2: Distribution of individual inbreeding coefficients in small isolate B before (outer ring) and after simulated genetic rescue (inner ring), showing shift toward lower inbreeding categories https://www.biologyjournal.net 7.
Mitrovski P, Heinze DA, Broome L, Hoffmann AA, Weeks AR. High levels of variation despite genetic fragmentation in populations of the endangered mountain pygmy possum. Molecular Ecology. 2007;16(1):75-87. 8. Pacioni C, Wayne AF, Spencer PBS.
Genetic outcomes from the translocations of the critically endangered woylie. Current Zoology. 2013;59(3):294-310. 9. Whiteley AR, Fitzpatrick SW, Funk WC, Tallmon DA. Genetic rescue to the rescue.
Trends in Ecology and Evolution. 2015;30(1):42-49. 10. Frankham R, Ballou JD, Eldridge MDB, Lacy RC, Ralls K, Dudash MR, Fenster CB. Predicting the probability of outbreeding depression. Conservation Biology. 2011;25(3):465-475. 11.
Hedrick PW. Gene flow and genetic restoration: the Florida panther as a case study. Conservation Biology. 1995;9(5):996-1007. 12. Ralls K, Ballou JD, Dudash MR, Eldridge MDB, Fenster CB, Lacy RC, Bhagat C, Bhagat D, Bhagat K, Bhagat L, Sunnucks P.
Call for a paradigm shift in the genetic management of fragmented populations. Conservation Letters. 2018;11(2):e12412. 13. Tallmon DA, Luikart G, Waples RS. The alluring simplicity and complex reality of genetic rescue.
Trends in Ecology and Evolution. 2004;19(9):489-496. 14. Lacy RC. Vortex: a computer simulation model for population viability analysis. Wildlife Research. 1993;20(1):45-65. 15.
Frankham R. Genetic rescue of small inbred populations: meta-analysis reveals large and consistent benefits of gene flow. Molecular Ecology. 2015;24(11):2610-2618. 16. Hedrick PW, Fredrickson R.
Genetic rescue guidelines with examples from Mexican wolves and Florida panthers. Conservation Genetics. 2010;11(2):615-626. 17. Heber S, Briskie JV, Apiolaza LA, Triggs SJ. A test for outbreeding depression in a founder population of a New Zealand bird.
Conservation Genetics. 2012;13(6):1625-1634. Vortex simulations showed that small isolate B faced a 72% extinction probability over 50 years without intervention. Introducing 2 mainland animals per generation reduced this to 18%, while 4 animals per generation brought it to 6%. Heterozygosity in the rescued population was projected to reach 0.41 after five rounds of introduction, a 70.8% increase from the pre-rescue baseline.
Discussion
The genetic erosion documented in these small wallaby populations mirrors patterns seen in other isolated marsupials, including the mountain pygmy possum and the woylie [7, 8]. What makes these data actionable is the Vortex modeling, which translates abstract genetic metrics into concrete management scenarios. The finding that just two immigrants per generation can cut extinction risk from 72% to 18% provides conservation managers with a feasible and relatively low-cost intervention [9]. The risk of outbreeding depression - where mixing divergent genomes produces offspring less fit than either parent - is a legitimate concern but appears low for P. penicillata.
STRUCTURE analysis assigned all four populations to a single genetic cluster (K = 1 was the best-supported model), and mitochondrial divergence was only 1.3% between the most distant populations. This indicates recent common ancestry and minimal risk of genomic incompatibility [10, 11].
Conclusion
Small isolated populations of P. penicillata have lost over half their genetic diversity relative to mainland counterparts, with inbreeding coefficients reaching levels associated with fitness decline. Simulation modeling showed that introducing 2-4 mainland individuals per generation could restore heterozygosity and dramatically reduce extinction risk over a 50-year horizon. The low genetic divergence between populations minimizes outbreeding depression risk. These results provide quantitative support for implementing genetic rescue translocations as a conservation tool for this and similarly endangered marsupial species [12, 13, 14].
References
6 in the original paper- Frankham R. Genetics and extinction. Biological Conservation. 2005;126(2):131-140.
- Keller LF, Waller DM. Inbreeding effects in wild populations. Trends in Ecology and Evolution. 2002;17(5):230-241.
- Johnson WE, Onorato DP, Roelke ME, Land ED, Cunningham M, Belden RC, Bhagat C, Bhagat D, Bhagat K, O'Brien SJ. Genetic restoration of the Florida panther. Science. 2010;329(5999):1641-1645.
- Madsen T, Shine R, Olsson M, Wittzell H. Restoration of an inbred adder population. Nature. 1999;402(6757):34-35.
- Weeks AR, Sgro CM, Young AG, Frankham R, Mitchell NJ, Miller KA, Bhagat C, Bhagat D, Hoffmann AA. Assessing the benefits and risks of translocations in changing environments: a genetic perspective. Evolutionary Applications. 2011;4(6):709- 725.
- Eldridge MDB, King JM, Loupis AK, Spencer PBS, Taylor AC, Pope LC, Hall GP. Unprecedented low levels of genetic variation and inbreeding depression in an island population of the black-footed rock-wallaby. Conservation Biology. 1999;13(3):531-541.