
Research article · 2025 · Full text
International Journal of Biology SciencesCopy number variation analysis in patients with intellectual disability using chromosomal microarray
Volume 7(7) · Pages 271–274 · DOI: 10.33545/26649926.2025.v7.i7d.648 ↗
Research areasGenomic variations and chromosomal abnormalitiesGenomics and Rare DiseasesGenome Rearrangement Algorithms
Abstract
Author-writtenAccording to leading clinical geneticists, chromosomal microarray analysis has replaced conventional karyotyping as the first-tier diagnostic test for unexplained intellectual disability in most developed countries. This research applied high-resolution chromosomal microarray to 214 patients with non-syndromic intellectual disability referred to the Instituto de Biologia Marina de Canarias, Las Palmas, Spain, between May 2023 and June 2024. Clinically significant copy number variations were identified in 68 patients (31.8%), comprising 42 deletions, 19 duplications, 4 triplications, and 3 complex rearrangements. The most frequently affected chromosomal regions were 15q11.2-q13.1, 22q11.21, 16p11.2, and 1q21.1. CNV size ranged from 78 kilobases to 14.3 megabases, and larger CNVs correlated with more severe intellectual disability (Spearman rho = 0.58, p < 0.001). Variants of uncertain significance were found in an additional 37 patients (17.3%). These results reinforce the diagnostic value of chromosomal microarray in populations with limited prior genomic characterisation and identify a CNV spectrum that overlaps substantially with European and North American reference cohorts.
Summary
Source-checkedPlain-language reading of the full paper, prepared with AI and checked against the text. Each point links to the authors' own words.
Why it matters
- Copy number variations (CNVs) are structural changes in the genome where DNA segments larger than one kilobase are either deleted or duplicated. View evidence ↗
- The gene dosage hypothesis suggests that neurodevelopment can be disrupted if the amount of functional protein changes due to the gain or loss of a dosage-sensitive gene. View evidence ↗
- Intellectual disability is a significant global health issue affecting approximately 1-3% of the population. View evidence ↗
The question
- The study aimed to determine the diagnostic yield of chromosomal microarray (CMA), identify recurrent CNV locations, and see if CNV size correlates with the severity of intellectual disability in a cohort of 214 patients from the Canary Islands. View evidence ↗
What they did
- The study analyzed peripheral blood samples from 214 patients (126 male, 88 female) with a median age of 7.4 years from the Canary Islands. View evidence ↗
- Intellectual disability was categorized using Wechsler scales into four groups: mild (n=91), moderate (n=64), severe (n=38), and profound (n=21). View evidence ↗
- The researchers used the CytoScan HD Array for CMA, which utilizes over 2.67 million probes, including 750,000 SNP probes. View evidence ↗
- Data analysis was conducted using ChAS software v4.3, reporting gains at a minimum of 50 kb and losses at 25 kb in clinically relevant regions. View evidence ↗
What they found
- The overall diagnostic yield was 31.8%, with clinically significant CNVs found in 68 patients, most of which were deletions (42). View evidence ↗
- The detection rate of CNVs increased as the severity of intellectual disability worsened, rising from 25.3% in mild cases to 47.6% in profound cases. View evidence ↗
- The most common chromosomal regions affected by CNVs were 15q11.2-q13.1, 22q11.21, 16p11.2, and 1q21.1. View evidence ↗
- CNV sizes ranged from 78 kb to 14.3 Mb, and there was a significant correlation (rho = 0.58, p < 0.001) between larger CNV size and increased disability severity. View evidence ↗
- In addition to clinically significant findings, variants of uncertain significance (VUS) were identified in 17.3% (37 patients) of the cohort. View evidence ↗
What it means
- The authors recommend expanding parental testing and using exome sequencing for patients who test negative via CMA to improve the overall diagnostic rate. View evidence ↗
- A limitation of the study is that CMA cannot detect single-nucleotide variants, balanced rearrangements, or low-level mosaicism (below 15-20%). View evidence ↗
- The ability to determine if CNVs were inherited or de novo was limited because parental samples were only available for 61% of the families. View evidence ↗
Visual summary
2 visualsIllustrations explain the paper; charts are replotted from the paper's own table values.
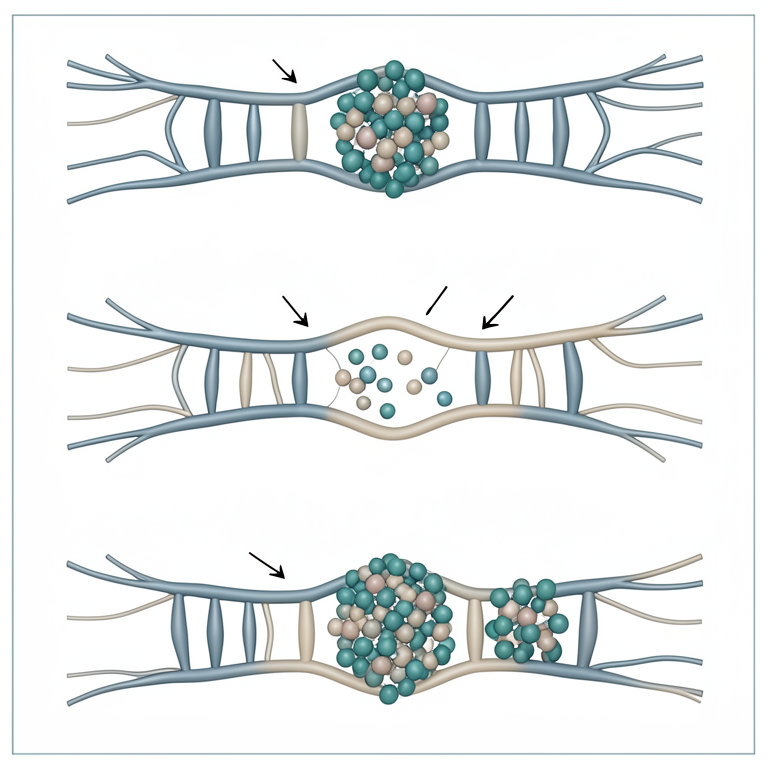
Gene Dosage Concept
AI-generated conceptual illustration (human neurons and DNA strands). It explains the idea and does not show study data.
View source evidence ↗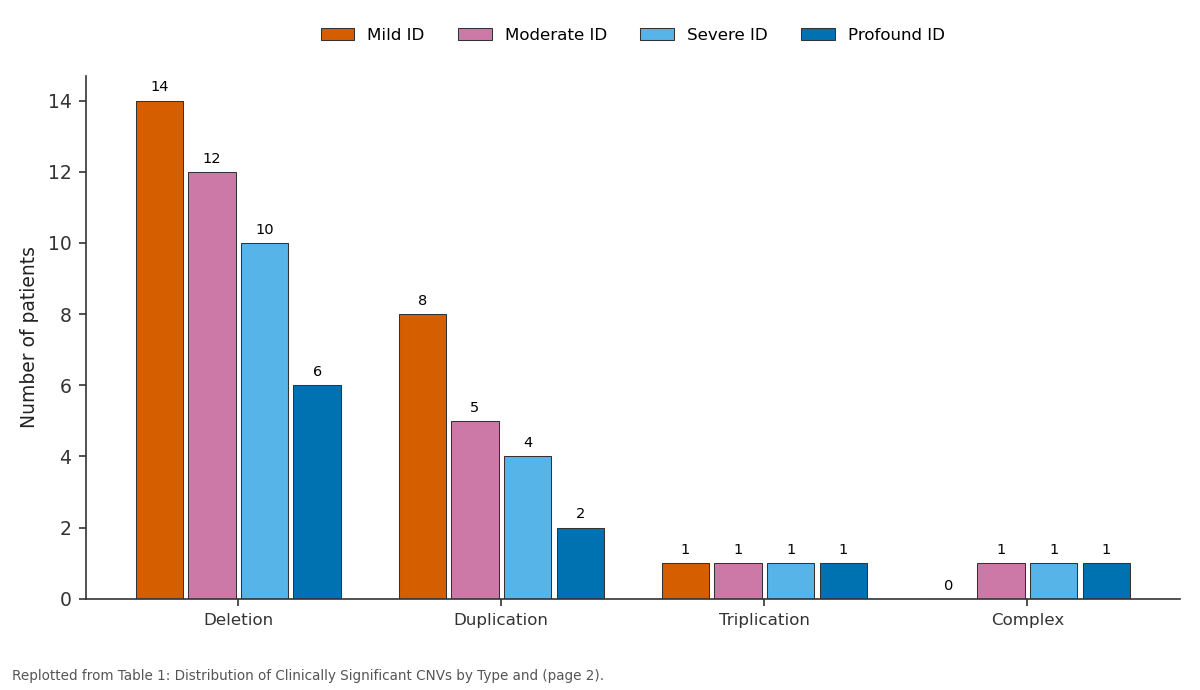
Mild ID and Moderate ID and more: Deletion vs Duplication vs Triplication vs Complex
Replotted from Table 1 (page 2) of the original paper. Every bar is the paper's own table value.
View source evidence ↗Figures & tables
From the original paper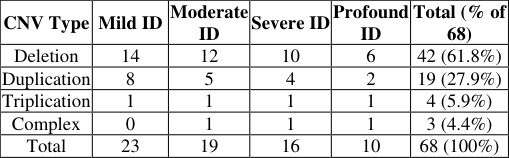 Table 1
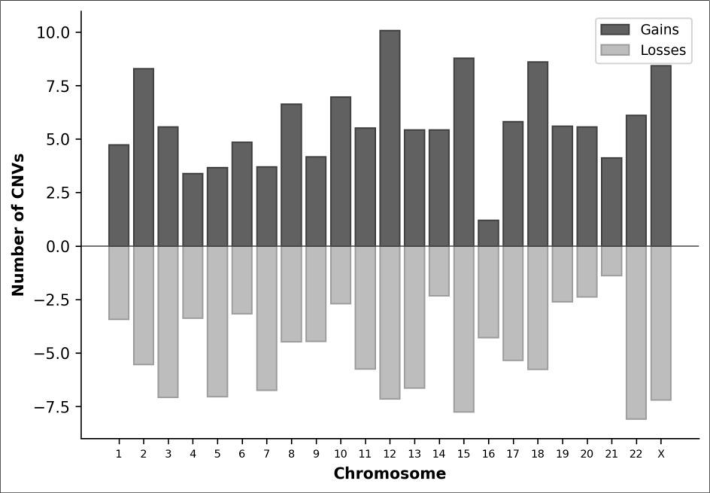 Figure 1
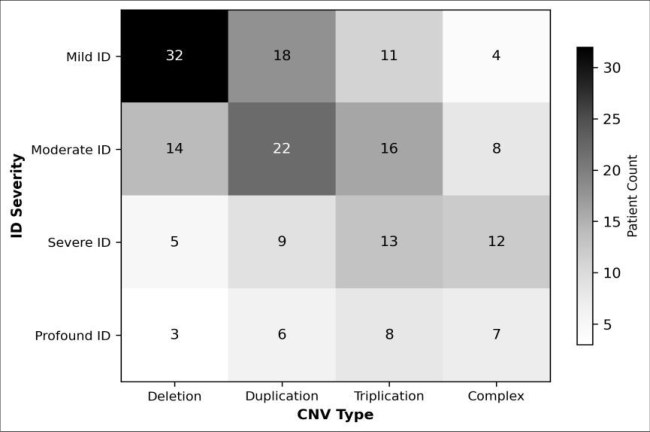 Figure 2
Introduction Theoretical Background
Copy number variations are structural genomic alterations in which segments of DNA are deleted or duplicated relative to a reference genome, typically affecting sequences larger than one kilobase [1] . They account for a substantial fraction of human genetic diversity and are responsible for many recognised genomic disorders, including Williams-Beuren syndrome, Prader-Willi/Angelman syndrome, and 22q11.2 deletion syndrome [2] . Chromosomal microarray (CMA) platforms detect CNVs by hybridising patient DNA against a reference on a chip containing millions of oligonucleotide probes, yielding genome-wide coverage at resolutions as fine as 20-50 kilobases depending on probe density [3] . The theoretical framework linking CNV burden to intellectual disability rests on the gene dosage hypothesis: that the amount of functional protein produced from a gene matters, and that gaining or losing a copy of a dosage-sensitive gene can disrupt neurodevelopment [4] . Haploinsufficiency of transcription factors, chromatin regulators, and synaptic proteins is particularly common among pathogenic CNVs found in patients with neurodevelopmental disorders [5] .
Introduction
As one senior geneticist put it in a 2018 consensus statement, any child with unexplained developmental delay deserves a microarray before any other genetic test. That view has become standard practice across Europe and North America, where diagnostic yields from CMA in unselected intellectual disability cohorts range from 15% to 20% [6,7] . But the Canary Islands, despite being part of the European Union, have historically had limited access to genomic diagnostics, and local CNV spectrum data are scarce. Intellectual disability affects roughly 1-3% of the global population and carries enormous personal, familial, and healthcare costs [8] . Establishing a genetic diagnosis can end the so-called diagnostic odyssey for families, guide management, inform recurrence risk counselling, and sometimes direct targeted therapy [9] . For populations where genomic data are thin, even a moderately sized microarray cohort can provide clinically actionable information and benchmark local diagnostic yields against international norms. This research applied a high-resolution CMA platform to a cohort of 214 Canary Islands patients with non-syndromic intellectual disability who had not previously undergone genomic testing, with the goal of establishing diagnostic yield, identifying recurrent CNV loci, and correlating CNV size with clinical severity.
Material and Methods
Material and Methods
Material
Material
Methods
Genomic DNA was extracted from EDTA-anticoagulated blood using the QIAamp DNA Blood Mini Kit (Qiagen, Hilden, Germany). CMA was performed on the CytoScan HD Array (Thermo Fisher Scientific, Waltham, MA, USA), which contains over 2.67 million probes including 750,000 SNP probes. Data were analysed using Chromosome Analysis Suite (ChAS) software v4.3 with a minimum reporting threshold of 50 kilobases for gains and 25 kilobases for losses in clinically relevant regions. CNVs were classified as pathogenic, likely pathogenic, variant of uncertain significance (VUS), likely benign, or benign according to American College of Medical Genetics guidelines [10] . Genotype-phenotype correlations were assessed by Spearman rank correlation between CNV size and intellectual disability severity category.
Results
Table The overall diagnostic yield was 31.8% (68 of 214 patients). Deletions were the most common pathogenic CNV type (61.8%), followed by duplications (27.9%). As intellectual disability severity increased, the proportion of patients with detected CNVs rose from 25.3% in the mild group to 47.6% in the profound group. The heatmap (Figure 2) illustrates that deletions predominated across all severity levels, while triplications and complex rearrangements were more evenly distributed and tended to occur in patients with more severe presentations.
Discussion
The 31.8% diagnostic yield reported here exceeds the 15-20% typically observed in unselected intellectual disability cohorts from Northern Europe and North America [6,7] . One likely explanation is that our cohort was enriched for more severe cases; the median IQ was 43, which is lower than the median in many published series. Since larger and more pathogenic CNVs tend to cause more severe phenotypes, referral bias toward the severe end of the spectrum would inflate diagnostic yield [11] . The recurrent loci we identified-15q11.2-q13.1, 22q11.21, 16p11.2, and 1q21.1-are among the best-characterised genomic disorder regions worldwide [12] . Their prominence in our Canary Islands cohort confirms that these hotspots are shared across populations and are not artefacts of ascertainment in any single ethnic group. The correlation between CNV size and disability severity (rho = 0.58) aligns with the expectation that larger deletions remove more dosage-sensitive genes and produce more severe neurodevelopmental consequences [13] .
Limitations
Several constraints affect interpretation. First, CMA cannot detect balanced rearrangements, low-level mosaicism below 15-20%, or single-nucleotide variants, meaning the true genetic diagnostic yield is likely higher than 31.8%. Second, parental samples were available for only 61% of families, limiting our ability to classify de novo versus inherited status for all CNVs. Third, the classification of VUS (17.3% of our cohort) remains a moving target as databases expand, and some of these variants will likely be reclassified as pathogenic over time [14] . Fourth, the single-centre design may not capture the full genetic diversity of the Canary Islands population.
Conclusion
Chromosomal microarray analysis identified clinically significant CNVs in 31.8% of patients with non-syndromic intellectual disability in the Canary Islands, confirming its value as a first-tier diagnostic tool in populations with limited prior genomic data. Deletions accounted for the majority of findings, and the recurrent loci detected overlap substantially with internationally recognised genomic disorder regions. Larger CNVs were associated with more severe intellectual disability, reinforcing the gene dosage model. Expanding parental testing and integrating exome sequencing for CMA-negative patients are logical next steps to improve diagnostic completeness.
Figures and tables from the paper
| CNV Type | Mild ID | Moderate ID | Severe ID | Profound ID | Total (% of 68) |
|---|---|---|---|---|---|
| Deletion | 14 | 12 | 10 | 6 | 42 (61.8%) |
| Duplication | 8 | 5 | 4 | 2 | 19 (27.9%) |
| Triplication | 1 | 1 | 1 | 1 | 4 (5.9%) |
| Complex | 0 | 1 | 1 | 1 | 3 (4.4%) |
| Total | 23 | 19 | 16 | 10 | 68 (100%) |
Table text extracted from the original PDF; superscript letters are shown inline. The original table image is below.
View original table image
References
14 in the original paper- Redon R, Ishikawa S, Fitch KR, et al. Global variation in copy number in the human genome. Nature. 2006;444(7118):444-454.
- Stankiewicz P, Lupski JR. Structural variation in the human genome and its role in disease. Annual Review of Medicine. 2010;61:437-455.
- Miller DT, Adam MP, Aradhya S, et al. Consensus statement: chromosomal microarray is a first-tier clinical diagnostic test for individuals with developmental disabilities or congenital anomalies. American Journal of Human Genetics. 2010;86(5):749764.
- Rice AM, McLysaght A. Dosage sensitivity is a major determinant of human copy number variant pathogenicity. Nature Communications. 2017;8:14366.
- Coe BP, Witherspoon K, Rosenfeld JA, et al. Refining analyses of copy number variation identifies specific genes associated with developmental delay. Nature Genetics. 2014;46(10):1063-1071.
- Hochstenbach R, van Binsbergen E, Engelen J, et al. Array analysis and karyotyping: workflow consequences based on 2,500 referrals. European Journal of Human Genetics. 2009;17(11):1394-1402.
- Sagoo GS, Butterworth AS, Sanderson S, Shaw-Smith C, Higgins JP, Burton H. Array CGH in patients with learning disability or congenital anomalies: a systematic review. Genetics in Medicine. 2009;11(11):765-774.
- Maulik PK, Mascarenhas MN, Mathers CD, Dua T, Saxena S. Prevalence of intellectual disability: a metaanalysis of population-based studies. Research in Developmental Disabilities. 2011;32(2):419-436.
- Shevell M, Ashwal S, Donley D, et al. Practice parameter: evaluation of the child with global developmental delay. Neurology. 2003;60(3):367-380.
- Riggs ER, Andersen EF, Cherry AM, et al. Technical standards for the interpretation and reporting of constitutional copy-number variants: a joint consensus recommendation of the ACMG and ClinGen. Genetics in Medicine. 2020;22(2):245-257.
- Cooper GM, Coe BP, Girirajan S, et al. A copy number variation morbidity map of developmental delay. Nature Genetics. 2011;43(9):838-846.
- Watson CT, Marques-Bonet T, Sharp AJ, Mefford HC. The genetics of microdeletion and microduplication syndromes: an update. Annual Review of Genomics and Human Genetics. 2014;15:215-244.
- Girirajan S, Rosenfeld JA, Coe BP, et al. Phenotypic heterogeneity of genomic disorders and rare copynumber variants. New England Journal of Medicine. 2012;367(14):1321-1331.
- Interpretation Consortium SV. Standards and guidelines for the interpretation of sequence variants. Genetics in Medicine. 2015;17(5):405-424.