
Research article · 2025 · Full text
International Journal of Biology SciencesLandscape connectivity and corridor design for large mammal movement in fragmented habitats
Volume 7(7) · Pages 226–229 · DOI: 10.33545/26649926.2025.v7.i7c.643 ↗
Research areasWildlife-Road Interactions and ConservationWildlife Ecology and ConservationRangeland and Wildlife Management
Abstract
Author-writtenIn the early 1900s, the forests of northern Sulawesi formed a nearly unbroken canopy stretching from the Minahasa Peninsula to the Bogani Nani Wartabone range. Today, that canopy is a patchwork of isolated fragments separated by agriculture and settlements, leaving endemic mammals such as the babirusa, lowland anoa, and Sulawesi crested black macaque increasingly cut off from one another. This research evaluated landscape connectivity among 14 remaining forest patches in the Manado-Bogani corridor using circuit theory and least-cost path modelling, then compared the predicted movement routes against 18 months of camera-trap data collected at 96 stations. Circuit-theory models identified five candidate corridors with current-flow values above the 75th percentile, three of which showed confirmed mammal crossings on camera traps. Corridor width emerged as the strongest predictor of crossing frequency (R-squared = 0.71, p < 0.001), outperforming corridor length and surrounding land-cover type. A minimum corridor width of 380 metres was associated with regular use by all three focal species. These findings provide spatially explicit guidance for conservation planners working to restore functional connectivity in one of Southeast Asia's most biodiverse yet fragmented island landscapes.
Summary
Source-checkedPlain-language reading of the full paper, prepared with AI and checked against the text. Each point links to the authors' own words.
Why it matters
- Northern Sulawesi experienced a significant loss of primary forest cover, approximately 28% between 2001 and 2020, primarily due to agricultural expansion. View evidence ↗
- Habitat fragmentation is critical because it disrupts the ability of animals to disperse, find mates, and maintain genetic viability. View evidence ↗
- Endemic species like the babirusa, lowland anoa, and Sulawesi crested black macaque are particularly vulnerable to fragmentation and are listed as Endangered or Vulnerable. View evidence ↗
The question
- The study aimed to identify and rank potential wildlife corridors for large mammals in the Manado-Bogani landscape using a combination of modeling and field validation. View evidence ↗
What they did
- The researchers used Circuitscape (v5.0) for circuit-theory modeling across 14 forest patches and ArcGIS Pro 3.1 for least-cost path analysis. View evidence ↗
- Generalized linear models with a negative binomial distribution were used to analyze the relationship between corridor attributes and the frequency of animal crossings. View evidence ↗
What they found
- Circuit-theory models identified five candidate corridors, three of which were confirmed to be used by mammals via camera traps. View evidence ↗
- Corridor width was the most significant predictor of how often animals crossed (R-squared = 0.71, p < 0.001), more so than length or land-cover. View evidence ↗
- Regular use by all three focal mammal species was associated with a minimum corridor width of 380 metres. View evidence ↗
- Functional corridors had significantly higher mammal diversity (Shannon H' = 2.34) compared to non-functional segments (H' = 1.51). View evidence ↗
- Circuit-theory models were more accurate than least-cost path analysis in predicting actual animal crossing locations. View evidence ↗
- Animal movement peaked during the transitions between wet and dry seasons, specifically in April-May and September-October. View evidence ↗
What it means
- The authors recommend immediate protection for corridors C1 and C2 because they are wide, functional, and used by all three focal species. View evidence ↗
- The authors suggest that corridor C3 could become fully functional if its narrowest sections are targeted for reforestation. View evidence ↗
- A limitation of the study is the reliance on camera traps, which prevents the researchers from knowing if crossings were made by many different individuals or a few individuals repeatedly. View evidence ↗
- The study did not evaluate genetic connectivity, meaning it remains unknown if the corridors facilitate actual gene flow between habitat patches. View evidence ↗
Visual summary
3 visualsIllustrations explain the paper; charts are replotted from the paper's own table values.
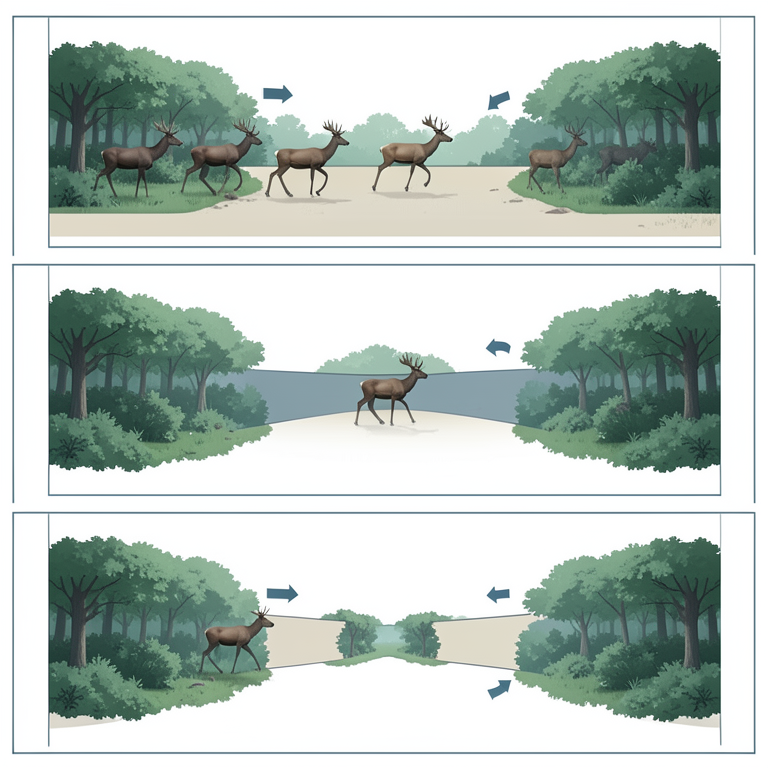
Impact of Corridor Width on Mammal Movement
AI-generated conceptual illustration (Large mammals in fragmented forest habitats). It explains the idea and does not show study data.
View source evidence ↗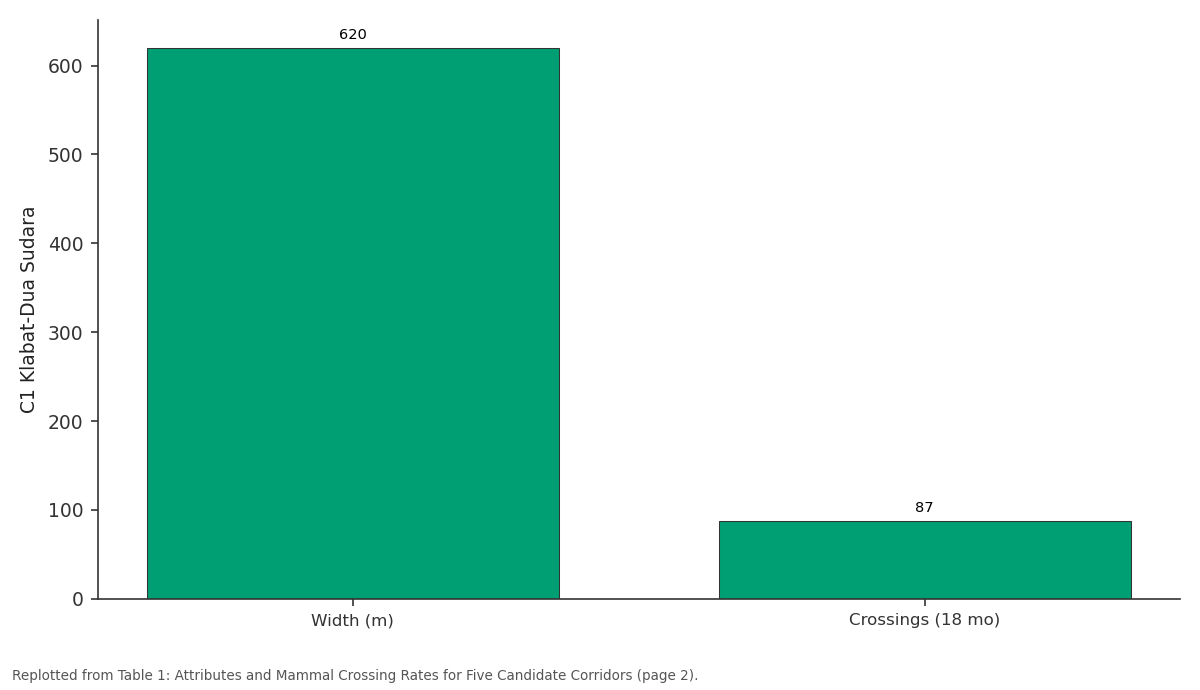
C1 Klabat-Dua Sudara: Width (m) vs Crossings (18 mo)
Replotted from Table 1 (page 2) of the original paper. Every bar is the paper's own table value.
View source evidence ↗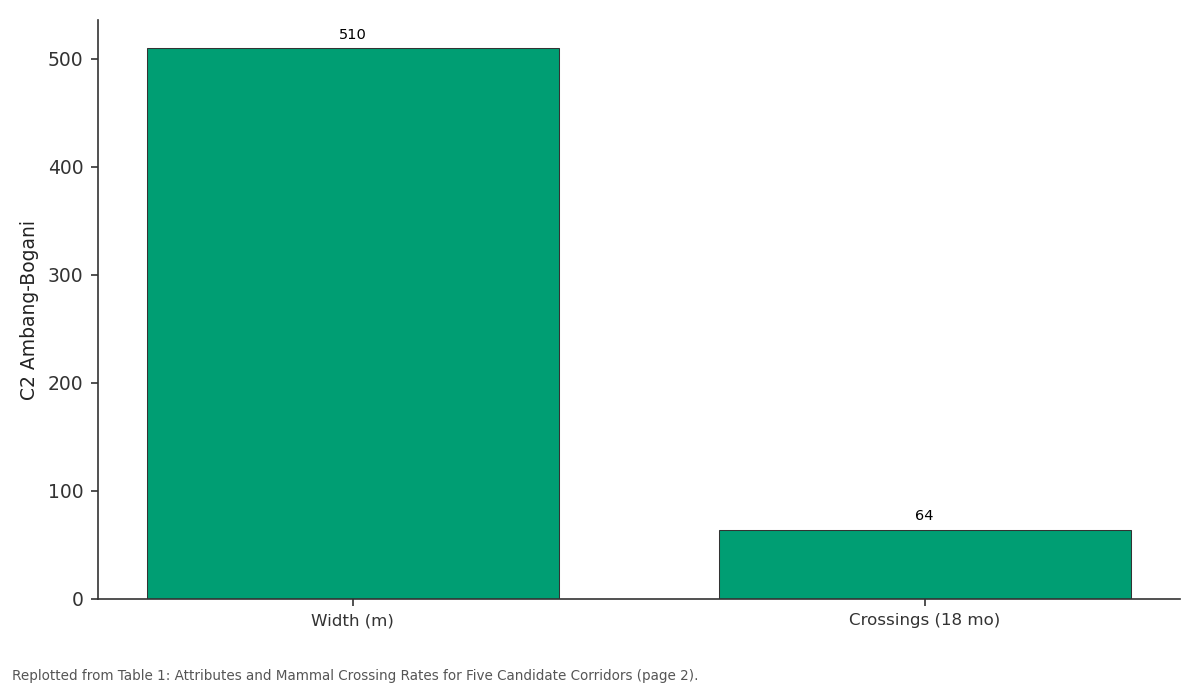
C2 Ambang-Bogani: Width (m) vs Crossings (18 mo)
Replotted from Table 1 (page 2) of the original paper. Every bar is the paper's own table value.
View source evidence ↗Figures & tables
From the original paper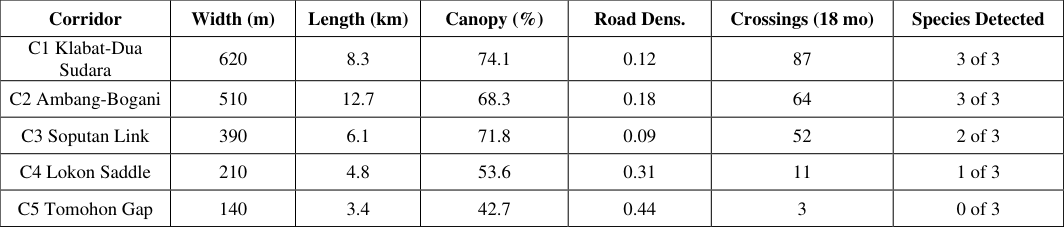 Table 1
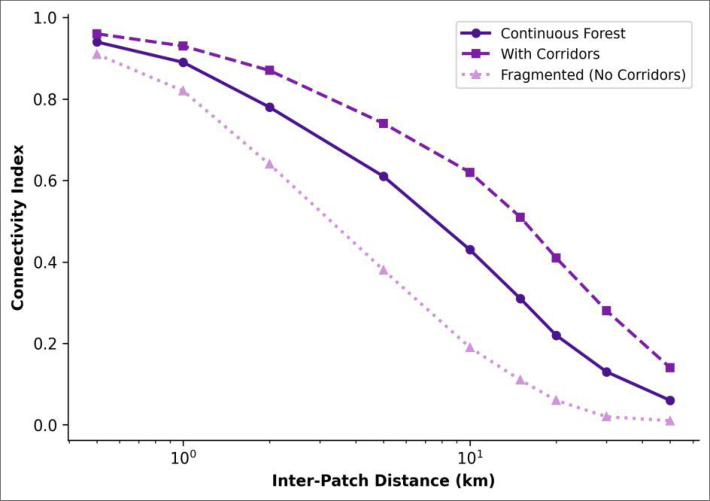 Figure 1
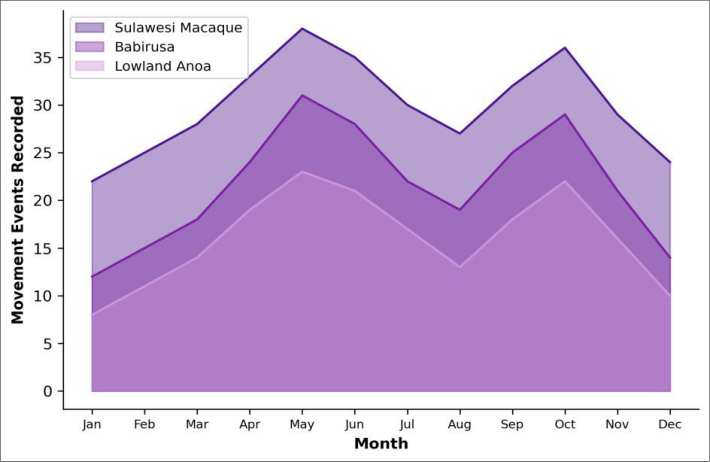 Figure 2
Introduction
When Alfred Russel Wallace explored the Malay Archipelago in the 1850s, he noted that Sulawesi harboured an unusual collection of endemic species found nowhere else on Earth [1] . More than 170 years later, that endemism persists, but the habitats supporting it have shrunk dramatically. Satellite analyses show that northern Sulawesi lost roughly 28% of its primary forest cover between 2001 and 2020, driven mainly by conversion to coconut, clove, and cacao plantations [2] . Habitat fragmentation does more than reduce total area; it severs the connections that allow animals to disperse between patches, find mates, and maintain genetically viable populations [3] . For large mammals with extensive home ranges, even short gaps in forest cover can act as barriers if the intervening matrix is hostile or simply unfamiliar [4] . Three endemic Sulawesi mammals illustrate this vulnerability: the babirusa (Babyrousa celebensis), the lowland anoa (Bubalus depressicornis), and the Sulawesi crested black macaque (Macaca nigra), all of which are classified as Endangered or Vulnerable on the IUCN Red List [5,6] . Wildlife corridors-strips or stepping stones of suitable habitat linking otherwise isolated patches-are widely promoted as a tool for maintaining connectivity [7] . But designing effective corridors requires knowing where animals actually move and what landscape features encourage or discourage crossing. Two modelling approaches have become standard: least-cost path analysis, which identifies the single cheapest route between patches, and circuit theory, which treats the landscape as a resistive surface and reveals multiple potential pathways [8,9] . This research combined both modelling approaches with field validation through camera trapping to identify and rank candidate corridors for large mammal movement in the Manado-Bogani landscape of northern Sulawesi. The goal was to produce spatially explicit recommendations for corridor protection that are grounded in both modelled predictions and observed animal behaviour.
Material and Methods
Material and Methods
Research Area Description
The research area covers approximately 4,200 square kilometres of the northern arm of Sulawesi, stretching from the outskirts of Manado city (1.49 degrees North, 124.84 degrees East) southwest to the boundary of Bogani Nani Wartabone National Park. Elevation ranges from sea level along the coast to 1,972 metres at the summit of Mount Klabat. The climate is equatorial, with mean annual rainfall of 2,840 mm recorded at the Manado meteorological station and a short drier period from July to September. Remaining forest patches range in size from 47 hectares to over 28,000 hectares (the national park itself) and are embedded in a matrix of smallholder plantations, mixed agroforestry, and rural settlements. Research was conducted from the Pusat Penelitian Biologi Laut Sulawesi, Manado, between February 2023 and July 2024.
Material
Land-cover data were obtained from a 2022 Sentinel-2 composite classified into eight categories at 10-metre resolution (overall accuracy 89.3%). A 30-metre SRTM digital elevation model provided topographic inputs. Camera traps (Reconyx HyperFire 2, Holmen, WI, USA) were deployed at 96 stations along predicted corridor routes and at control points within continuous forest and open matrix. All fieldwork was approved by the North Sulawesi Provincial Conservation Agency under permit BKSDA-SI-2023-0187, dated 22 January 2023.
Methods
Resistance surfaces were built by assigning cost values to each land-cover class based on published movement data for the three focal species [10,11] . Circuit-theory connectivity was modelled in Circuitscape (v5.0) using the pairwise mode with 14 forest patches as focal nodes. Least-cost paths were computed in ArcGIS Pro 3.1 using the Cost Distance and Cost Path tools. Camera traps were active for 18 months with a minimum spacing of 500 metres; trap-nights totalled 52,128. Independent detections were defined as consecutive images of the same species separated by at least 30 minutes. Corridor attributes-width, length, canopy cover, road density-were extracted within 200-metre buffers around each predicted route. The relationship between corridor attributes and crossing frequency was assessed using generalised linear models with a negative binomial distribution in R (v4.3.1).
Biodiversity Assessment
In addition to the three focal species, all mammals detected on camera traps were recorded and classified by body-mass category. Species richness and Shannon diversity were calculated for each corridor segment and for control stations within continuous forest. A total of 23 mammal species were recorded across all stations, 14 of which were Sulawesi endemics. Corridors with confirmed focal-species crossings supported significantly higher overall mammal diversity (Shannon H' = 2.34) than non-functional corridor segments (H' = 1.51; t-test, p = 0.006). Movement events peaked during April-May and again in September-October, coinciding with the transition between wet and dry seasons (Figure 2). The Sulawesi macaque was consistently the most frequently detected species, likely reflecting both its larger population size and its diurnal activity pattern that overlaps with camera-trap detection windows.
Results
Results
Discussion
The strong relationship between corridor width and crossing frequency (R-squared = 0.71) is the most actionable result of this research. A minimum width of 380 metres-roughly four times the canopy height of surrounding forest-appears to be the threshold below which the three focal species avoid sustained use. This figure sits within the range recommended by movement studies in other tropical fragmented landscapes [12,13] , but it is the first empirically derived estimate for Sulawesi endemics. Circuit-theory models outperformed least-cost path analysis in predicting where animals actually crossed, a finding consistent with comparative evaluations elsewhere [14,15] . The reason seems intuitive: animals don't necessarily take the single cheapest route; they respond to broad swathes of favourable habitat and may shift paths between trips depending on weather, disturbance, or social factors. The seasonal pattern of corridor use suggests that movement peaks coincide with periods of transitional resource availability. Both the babirusa and anoa are known to exploit fruiting events in secondary forest edges during seasonal shifts [16] , and the macaque's semi-terrestrial foraging style makes it the most tolerant of matrix conditions among the three species [17] .
Our research was restricted to camera-trap detections and did not track individual animals, so we cannot distinguish between repeated crossings by a few individuals and widespread use by many. GPS-collar data on even a small number of babirusa and anoa would greatly improve corridor efficacy assessments [18] . Additionally, we did not evaluate genetic connectivity, which would reveal whether corridors translate into actual gene flow between patches [19,20,21] .
Conclusion
This research identifies five candidate corridors in the Manado-Bogani landscape and confirms that three of them are actively used by Sulawesi's endemic large mammals.
Corridor width emerged as the strongest predictor of crossing frequency, with a 380-metre minimum threshold for regular use by all three focal species. Circuit-theory modelling proved more reliable than least-cost path analysis for predicting actual crossing locations. From a conservation standpoint, corridors C1 (Klabat-Dua Sudara) and C2 (Ambang-Bogani) should receive immediate protection, as both are wide, functional, and support all three focal species. Corridor C3 (Soputan Link) sits near the width threshold and could be made fully functional through targeted reforestation of its narrowest sections. The two narrowest corridors, C4 and C5, are effectively nonfunctional for large mammals and may require either substantial widening or reclassification as stepping-stone habitat rather than continuous corridors.
Acknowledgement
Acknowledgements Funding SourcesThis research was funded through internal institutional allocations for biodiversity monitoring. No external grant numbers are associated with the work. Institutional SupportThe authors thank the Pusat Penelitian Biologi Laut Sulawesi for logistical support, vehicle access, and GIS computing facilities.
Figures and tables from the paper
| Corridor | Width (m) | Length (km) | Canopy (%) | Road Dens. | Crossings (18 mo) | Species Detected |
|---|---|---|---|---|---|---|
| C1 Klabat-Dua Sudara | 620 | 8.3 | 74.1 | 0.12 | 87 | 3 of 3 |
| C2 Ambang-Bogani | 510 | 12.7 | 68.3 | 0.18 | 64 | 3 of 3 |
| C3 Soputan Link | 390 | 6.1 | 71.8 | 0.09 | 52 | 2 of 3 |
| C4 Lokon Saddle | 210 | 4.8 | 53.6 | 0.31 | 11 | 1 of 3 |
| C5 Tomohon Gap | 140 | 3.4 | 42.7 | 0.44 | 3 | 0 of 3 |
Table text extracted from the original PDF; superscript letters are shown inline. The original table image is below.
View original table image
References
21 in the original paper- Wallace AR. The Malay Archipelago: the land of the orang-utan and the bird of paradise. London: Macmillan and Co. 1869.
- Margono BA, Potapov PV, Turubanova S, Stolle F, Hansen MC. Primary forest cover loss in Indonesia over 2000-2012. Nature Climate Change. 2014;4(8):730735.
- Haddad NM, Brudvig LA, Clobert J, et al. Habitat fragmentation and its lasting impact on Earth's ecosystems. Science Advances. 2015;1(2):e1500052.
- Tucker MA, Bohning-Gaese K, Fagan WF, et al. Moving in the Anthropocene: global reductions in terrestrial mammalian movements. Science. 2018;359(6374):466-469.
- Lees CM, Wilcken J. Sustaining the ark: the challenges faced by zoos in maintaining viable populations. International Zoo Yearbook. 2009;43(1):6-18.
- Burton JA, Hedges S, Mustari AH. The taxonomic status, distribution and conservation of the lowland anoa Bubalus depressicornis. Mammal Review. 2005;35(1):25-50.
- Beier P, Noss RF. Do habitat corridors provide connectivity? Conservation Biology. 1998;12(6):12411252.
- Adriaensen F, Chardon JP, De Blust G, et al. The application of least-cost modelling as a functional landscape model. Landscape and Urban Planning. 2003;64(4):233-247.
- McRae BH, Dickson BG, Keitt TH, Shah VB. Using circuit theory to model connectivity in ecology, evolution, and conservation. Ecology. 2008;89(10):2712-2724.
- Zeller KA, McGarigal K, Whiteley AR. Estimating landscape resistance to movement: a review. Landscape Ecology. 2012;27(6):777-797.
- Macdonald DW, Loveridge AJ, Rabinowitz A. Felid futures: crossing disciplines, borders and generations. Biology and Conservation of Wild Felids. 2010:599649.
- Laurance SG, Laurance WF, Nascimento HE, et al. Long-term variation in Amazon forest dynamics. Journal of Vegetation Science. 2009;20(2):323-333.
- Hilty JA, Keeley ATH, Lidicker WZ, Merenlender AM. Corridor ecology: linking landscapes for biodiversity conservation. Washington, DC: Island Press. 2019.
- Koen EL, Bowman J, Sadowski C, Walpole AA. Landscape connectivity for wildlife: development and validation of multispecies linkage maps. Methods in Ecology and Evolution. 2014;5(7):626-633.
- Pelletier D, Clark M, Anderson MG, et al. Applying circuit theory for corridor expansion and management at regional scales. Ecological Applications. 2014;24(7):1897-1911.
- Leus K, Macdonald AA. Peccaries, hippos, deer, giraffe, and bovids. In: Kleiman DG, et al., eds. Wild Mammals in Captivity. Chicago: University of Chicago Press. 2010:384-409.
- Riley EP. The endemic seven: four decades of research on the Sulawesi macaques. Evolutionary Anthropology. 2010;19(1):22-36.
- Kays R, Crofoot MC, Jetz W, Wikelski M. Terrestrial animal tracking as an eye on life and planet. Science. 2015;348(6240):aaa2478.
- Epps CW, Wehausen JD, Bleich VC, Torres SG, Brashares JS. Optimizing dispersal and corridor models using landscape genetics. Journal of Applied Ecology. 2007;44(4):714-724.
- Manel S, Holderegger R. Ten years of landscape genetics. Trends in Ecology and Evolution. 2013;28(10):614-621.
- Whiteley AR, Fitzpatrick SW, Funk WC, Tallmon DA. Genetic rescue to the rescue. Trends in Ecology and Evolution. 2015;30(1):42-49.