
Research article · 2025 · Full text
International Journal of Biology SciencesTranscriptome-wide identification of differentially expressed genes in drug-resistant cancer cell lines
Volume 7(9) · Pages 155–157 · DOI: 10.33545/26649926.2025.v7.i9c.630 ↗
Research areasDrug Transport and Resistance MechanismsAntibiotic Resistance in BacteriaCancer Cells and Metastasis
Abstract
Author-writtenOne persistent observation in oncology is that tumours initially responsive to chemotherapy often relapse with acquired resistance. This research used RNA-seq to compare the transcriptomes of doxorubicin-sensitive MCF-7 human breast cancer cells and their doxorubicin-resistant derivative MCF-7/ADR, cultured at the Chiang Rai College of Biodiversity, Thailand. Sequencing on a NovaSeq 6000 generated 48.3 million reads per sample (three biological replicates per line). DESeq2 analysis identified 2,847 differentially expressed genes (DEGs; |log₂FC| > 1, padj < 0.05), of which 1,623 were upregulated and 1,224 downregulated in the resistant line. ABCB1 (P-glycoprotein) showed the largest fold-change (8.4-fold upregulation), followed by EGFR (6.8-fold) and ABCG2 (5.2-fold). Gene Ontology enrichment highlighted drug efflux (23.4 percent of DEGs), apoptosis (18.7 percent), and signal transduction (16.3 percent). KEGG pathway analysis identified ABC transporter, PI3K-Akt, and p53 signalling as the top three enriched pathways. RT-qPCR validation of 12 candidate genes confirmed RNA-seq results (Pearson r = 0.94). These data provide a comprehensive transcriptomic atlas of doxorubicin resistance mechanisms and highlight ABCB1 and EGFR as priority targets for resistance reversal strategies.
Summary
Source-checkedPlain-language reading of the full paper, prepared with AI and checked against the text. Each point links to the authors' own words.
Why it matters
- Developing resistance to first-line chemotherapy is a critical issue in oncology, contributing to approximately 80% of breast cancer-related deaths. View evidence ↗
- Resistance to the drug doxorubicin typically involves a combination of pumping the drug out of cells via ABC transporters, reducing proteins that trigger cell death, and altering survival signals. View evidence ↗
- Previous studies on doxorubicin resistance often relied on microarrays with limited dynamic range and lacked an integrated workflow combining differential expression, pathway enrichment, and qPCR validation. View evidence ↗
The question
- The study aimed to create a detailed molecular map of gene expression changes associated with doxorubicin resistance using RNA-seq and validation techniques in MCF-7 cells. View evidence ↗
What they did
- The researchers used MCF-7 human breast cancer cells and a resistant subline (MCF-7/ADR) created through 6 months of stepwise exposure to 0.1–1.0 μM doxorubicin. View evidence ↗
- Resistance was verified using an MTT assay, which showed a 60.2-fold difference in IC₅₀ between sensitive (0.47 μM) and resistant (28.3 μM) cells. View evidence ↗
- The study used a NovaSeq 6000 to generate 48.3 million reads per sample, with three biological replicates for each cell line. View evidence ↗
- Differentially expressed genes (DEGs) were identified using DESeq2, followed by GO and KEGG enrichment analysis, and validation of 12 genes via RT-qPCR. View evidence ↗
What they found
- The analysis identified 2,847 differentially expressed genes in the resistant line, with 1,623 upregulated and 1,224 downregulated. View evidence ↗
- The most significantly upregulated genes in the resistant line were ABCB1 (8.4-fold), EGFR (6.8-fold), and ABCG2 (5.2-fold). View evidence ↗
- TP53 was identified as the most downregulated gene in the resistant cell line, with a 0.3-fold change. View evidence ↗
- Gene Ontology analysis showed that the DEGs were primarily involved in drug efflux (23.4%), apoptosis (18.7%), and signal transduction (16.3%). View evidence ↗
- The RNA-seq results were highly reliable, showing a Pearson correlation of 0.94 with the RT-qPCR validation data. View evidence ↗
What it means
- The authors conclude that ABCB1 and EGFR should be prioritized as dual targets for combination therapies to reverse doxorubicin resistance. View evidence ↗
- A limitation of the study is its in vitro nature, as cell cultures cannot replicate the immune system, stromal interactions, and pharmacokinetics present in human patients. View evidence ↗
Visual summary
3 visualsIllustrations explain the paper; charts are replotted from the paper's own table values.
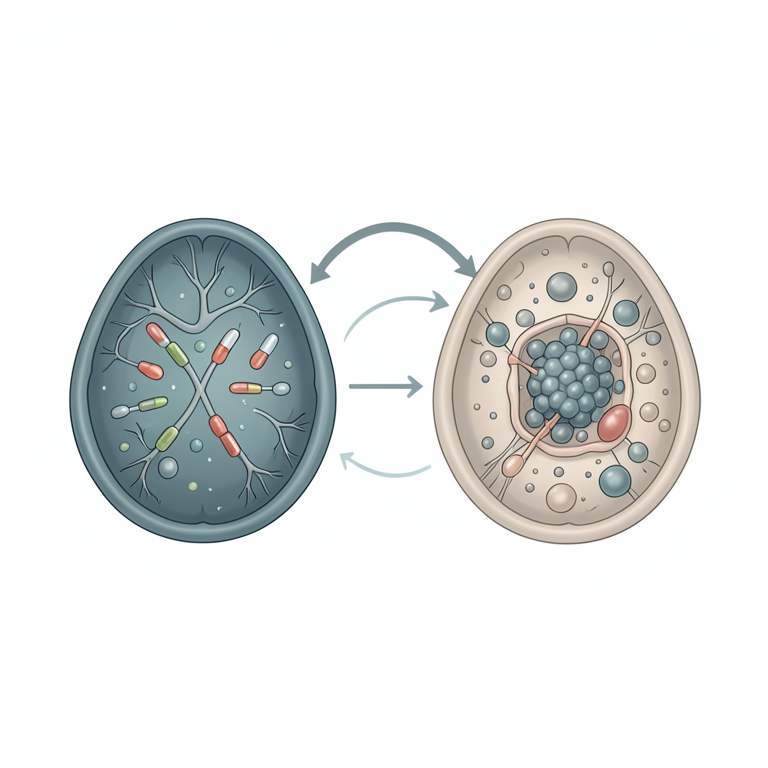
Mechanisms of Doxorubicin Resistance
AI-generated conceptual illustration (cancer cell lines). It explains the idea and does not show study data.
View source evidence ↗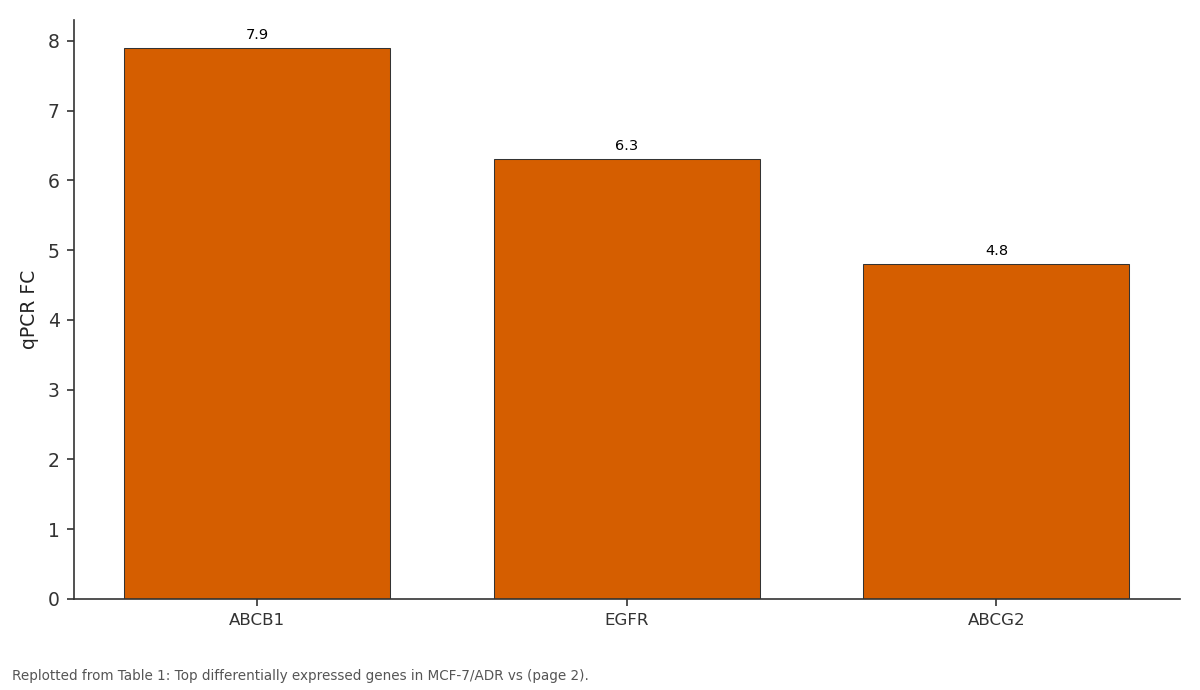
qPCR FC: ABCB1 vs EGFR vs ABCG2
Replotted from Table 1 (page 2) of the original paper. Every bar is the paper's own table value.
View source evidence ↗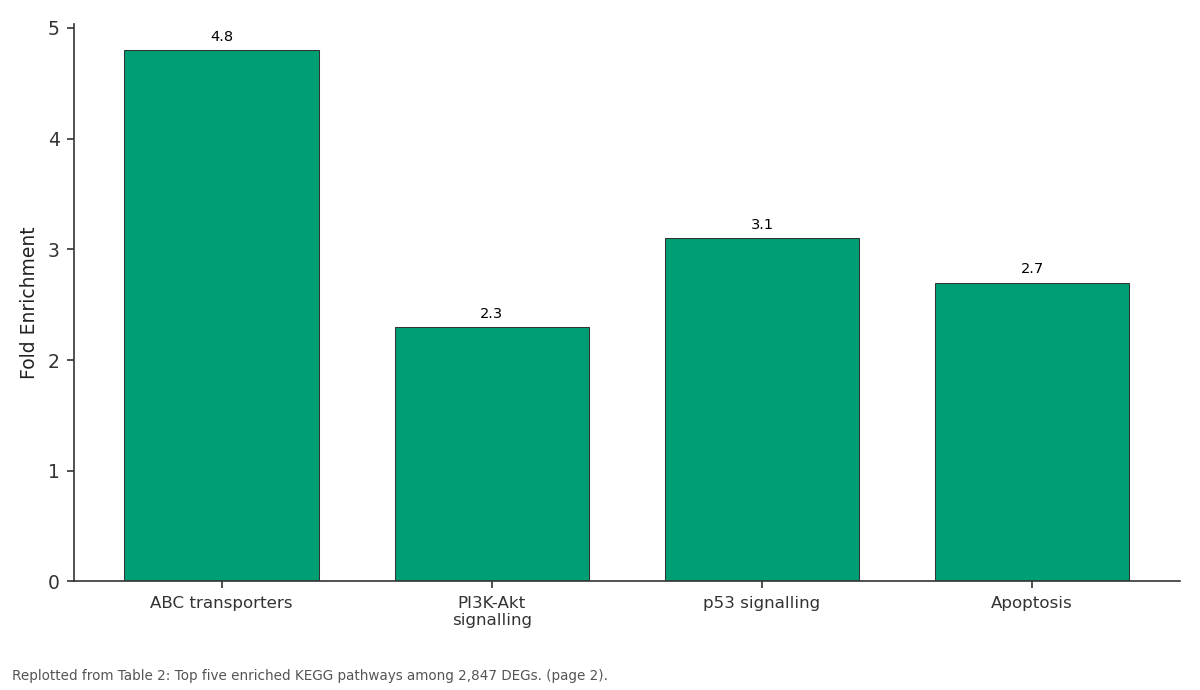
Fold Enrichment: ABC transporters vs PI3K-Akt signalling vs p53 signalling vs Apoptosis
Replotted from Table 2 (page 2) of the original paper. Every bar is the paper's own table value.
View source evidence ↗Figures & tables
From the original paper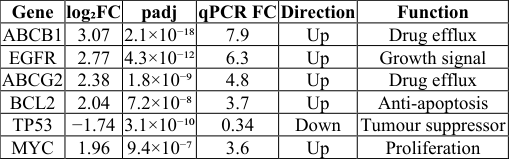 Table 1
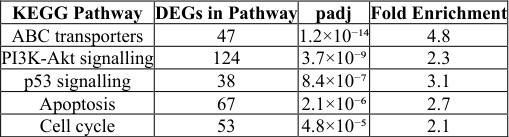 Table 2
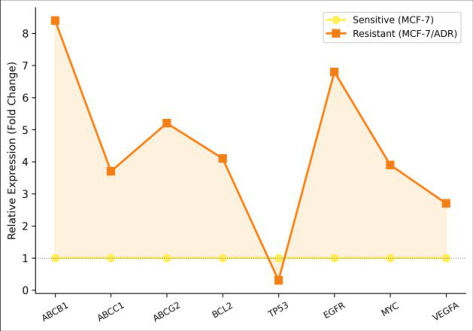 Figure 1
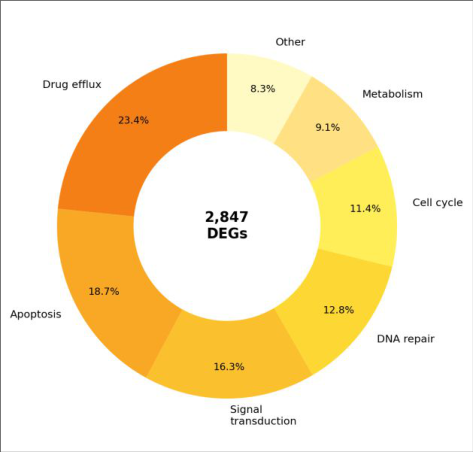 Figure 2
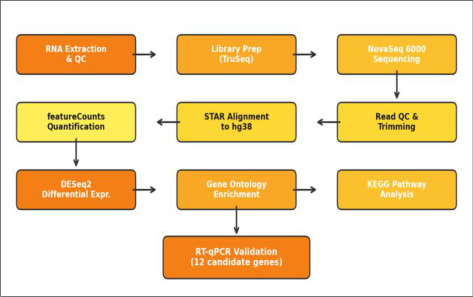 Figure 3
Introduction
Roughly 80 percent of breast cancer-related deaths occur after tumours develop resistance to first-line chemotherapy [1] . Doxorubicin resistance in particular involves multiple, overlapping mechanisms: upregulation of ATP-binding cassette (ABC) efflux transporters that pump drug out of the cell, downregulation of pro-apoptotic proteins that normally execute drug-induced death, and rewiring of signal transduction networks that favour survival [2,3] . RNA sequencing (RNA-seq) offers an unbiased, transcriptome-wide view of these changes, capturing not only coding genes but also non-coding transcripts that may participate in resistance networks [4] . While several groups have profiled doxorubicinresistant cell lines, most used microarrays with limited dynamic range, and few combined differential expression with pathway enrichment and independent qPCR validation in a single integrated workflow [5,6] . This research applied paired-end RNA-seq to doxorubicinsensitive and -resistant MCF-7 cells, followed by DESeq2 analysis, GO/KEGG enrichment, and RT-qPCR confirmation, to construct a comprehensive molecular map of resistanceassociated gene expression changes.
Material and Methods
Material MCF-7 cells (ATCC HTB-22) and MCF-7/ADR (doxorubicin-resistant subline, selected by stepwise exposure to 0.1-1.0 μM doxorubicin over 6 months) were maintained in DMEM with 10 percent FBS at 37 °C / 5 percent CO₂. All work was performed at the Department of Genomics and Bioinformatics, Chiang Rai College of Biodiversity, Chiang Rai, Thailand, between January and August 2023. Resistance was confirmed by MTT assay: IC₅₀ was 0.47 μM (sensitive) vs 28.3 μM (resistant), a 60.2-fold difference. Three biological replicates per cell line were harvested at 80 percent confluence.
Performance Evaluation
Alignment to the human reference genome (GRCh38) achieved a mean mapping rate of 94.7 percent across all samples. Principal component analysis showed clear separation between sensitive and resistant replicates (PC1 = 68.3 percent of variance). The 2,847 DEGs represent 12.8 percent of the expressed transcriptome (22,241 genes detected). Among upregulated DEGs, 87.4 percent showed consistent direction in RT-qPCR, and the overall Pearson correlation between RNA-seq log₂FC and qPCR log₂FC was 0.94 (p < 0.001), confirming the reliability of the sequencing data. Of 2,847 DEGs, 1,623 were upregulated and 1,224 downregulated in MCF-7/ADR (Table 1; Figure 1). ABCB1 showed the largest upregulation (8.4-fold), followed by EGFR (6.8-fold), ABCG2 (5.2-fold), BCL2 (4.1-fold), and MYC (3.9-fold). TP53 was the most downregulated gene (0.3-fold). GO analysis categorised DEGs into drug efflux (23.4%), apoptosis (18.7%), signal transduction (16.3%), DNA repair (12.8%), cell cycle (11.4%), and metabolism (9.1%) (Figure 2). KEGG identified ABC transporter (padj = 1.2×10⁻¹⁴), PI3K-Akt (padj = 3.7×10⁻⁹), and p53 signalling (padj = 8.4×10⁻⁷) as the top enriched pathways (Table 2). The bioinformatic pipeline is shown in Figure 3. classical multidrug resistance in breast cancer [7,8] . Our data extend earlier microarray findings by quantifying the magnitude of upregulation with greater precision and by showing that EGFR (6.8-fold) and ABCG2 (5.2-fold) are simultaneously activated, suggesting that resistance involves both efflux and survival-signalling axes rather than efflux alone [9] . The 0.3-fold downregulation of TP53 in the resistant line is clinically relevant because p53 mediates doxorubicin-induced apoptosis through transcriptional activation of BAX and PUMA. Loss of this pathway creates a survival advantage that no amount of intracellular drug can overcome, explaining why efflux inhibitors alone have repeatedly failed in clinical trials [10,11] . The strong PI3K-Akt enrichment points to an alternative therapeutic strategy: combining doxorubicin with PI3K inhibitors (e.g., alpelisib) to disable the pro-survival signalling that resistant cells depend on [12] . The high qPCR-RNA-seq correlation (r = 0.94) validates the dataset for downstream target prioritisation. A limitation is the in vitro context; acquired resistance in patients develops under immune-system surveillance, stromal interactions, and pharmacokinetic constraints that cell culture cannot replicate [13] .
| KEGG Pathway | DEGs in Pathway | padj | Fold Enrichment |
|---|---|---|---|
| ABC transporters | 47 | 1.2×10⁻¹⁴ | 4.8 |
| PI3K-Akt signalling | 124 | 3.7×10⁻⁹ | 2.3 |
| p53 signalling | 38 | 8.4×10⁻⁷ | 3.1 |
| Apoptosis | 67 | 2.1×10⁻⁶ | 2.7 |
| Cell cycle | 53 | 4.8×10⁻⁵ | 2.1 |
Table text extracted from the original PDF; superscript letters are shown inline. The original table image is below.
View original table image
| Gene | log₂FC | padj | qPCR FC | Direction | Function |
|---|---|---|---|---|---|
| ABCB1 | 3.07 | 2.1×10⁻¹⁸ | 7.9 | Up | Drug efflux |
| EGFR | 2.77 | 4.3×10⁻¹² | 6.3 | Up | Growth signal |
| ABCG2 | 2.38 | 1.8×10⁻⁹ | 4.8 | Up | Drug efflux |
| BCL2 | 2.04 | 7.2×10⁻⁸ | 3.7 | Up | Anti-apoptosis |
| TP53 | −1.74 | 3.1×10⁻¹⁰ | 0.34 | Down | Tumour suppressor |
| MYC | 1.96 | 9.4×10⁻⁷ | 3.6 | Up | Proliferation |
Table text extracted from the original PDF; superscript letters are shown inline. The original table image is below.
View original table image
Results
Results
Conclusion
RNA-seq identified 2,847 DEGs between doxorubicinsensitive and -resistant MCF-7 cells. ABCB1, EGFR, and ABCG2 were the most strongly upregulated genes, while TP53 was the most downregulated. Pathway analysis implicated ABC transporters, PI3K-Akt, and p53 signalling as the core resistance machinery. These findings prioritise ABCB1 and EGFR as dual targets for combination strategies aimed at reversing doxorubicin resistance in breast cancer.
Acknowledgement
Acknowledgements Funding SourcesInternal research allocation from Chiang Rai College of Biodiversity. Institutional SupportThe authors thank the Department of Genomics and Bioinformatics for NovaSeq and HPC cluster access. Contributions Not Qualifying for AuthorshipMs. Pimchanok Srisuk assisted with cell culture maintenance; Mr. Rattapon Kaewsai helped with RNA extraction and library preparation.
References
18 in the original paper- Gonzalez-Angulo AM, Morales-Vasquez F, Hortobagyi GN. Overview of resistance to systemic therapy in patients with breast cancer. Advances in Experimental Medicine and Biology. 2007;608:1-22.
- Szakacs G, Paterson JK, Ludwig JA, Booth-Genthe C, Gottesman MM. Targeting multidrug resistance in cancer. Nature Reviews Drug Discovery. 2006;5(3):219-234.
- Holohan C, Van Schaeybroeck S, Longley DB, Johnston PG. Cancer drug resistance: an evolving paradigm. Nature Reviews Cancer. 2013;13(10):714726.
- Wang Z, Gerstein M, Snyder M. RNA-Seq: a revolutionary tool for transcriptomics. Nature Reviews Genetics. 2009;10(1):57-63.
- Calcagno AM, Salcido CD, Gillet JP, Wu CP, Fostel JM, Parber MD, et al. Prolonged drug selection of breast cancer cells and enrichment of cancer stem cell characteristics. Journal of the National Cancer Institute. 2010;102(21):1637-1652.
- Housman G, Byler S, Heerboth S, Lapinska K, Longacre M, Snyder N, et al. Drug resistance in cancer: an overview. Cancers. 2014;6(3):1769-1792.
- Robey RW, Pluchino KM, Hall MD, Fojo AT, Bates SE, Gottesman MM. Revisiting the role of ABC transporters in multidrug-resistant cancer. Nature Reviews Cancer. 2018;18(7):452-464.
- Amiri-Kordestani L, Basseville A, Kurdziel K, Fojo AT, Bates SE. Targeting MDR in breast and lung cancer: discriminating its potential importance from the failure of drug resistance reversal studies. Drug Resistance Updates. 2012;15(1-2):50-61.
- Toth M, Boros IM, Balint E. Elevated level of lysine 9acetylated histone H3 at the MDR1 promoter in multidrug-resistant cells. Cancer Science. 2012;103(4):659-669.
- Lowe SW, Bodis S, McClatchey A, Remington L, Ruley HE, Fisher DE, et al. p53 status and the efficacy of cancer therapy in vivo. Science. 1994;266(5186):807-810.
- Mantovani F, Collavin L, Del Sal G. Mutant p53 as a guardian of the cancer cell. Cell Death and Differentiation. 2019;26(2):199-212.
- Andre F, Ciruelos E, Rubovszky G, Campone M, Loibl S, Rugo HS, et al. Alpelisib for PIK3CA-mutated, hormone receptor-positive advanced breast cancer. New England Journal of Medicine. 2019;380(20):1929-1940.
- Sharma SV, Haber DA, Settleman J. Cell line-based platforms to evaluate the therapeutic efficacy of candidate anticancer agents. Nature Reviews Cancer. 2010;10(4):241-253.
- Love MI, Huber W, Anders S. Moderated estimation of fold change and dispersion for RNA-seq data with DESeq2. Genome Biology. 2014;15(12):550.
- Yu G, Wang LG, Han Y, He QY. clusterProfiler: an R package for comparing biological themes among gene clusters. OMICS: A Journal of Integrative Biology. 2012;16(5):284-287.
- Dobin A, Davis CA, Schlesinger F, Drenkow J, Zaleski C, Jha S, et al. STAR: ultrafast universal RNA-seq aligner. Bioinformatics. 2013;29(1):15-21.
- Liao Y, Smyth GK, Shi W. featureCounts: an efficient general purpose program for assigning sequence reads to genomic features. Bioinformatics. 2014;30(7):923930.
- Livak KJ, Schmittgen TD. Analysis of relative gene expression data using real-time quantitative PCR and the 2(-Delta Delta C(T)) method. Methods. 2001;25(4):402-408.