
Research article · 2025 · Full text
International Journal of Biology SciencesBiodiversity assessment of freshwater zooplankton communities in Himalayan glacial lakes
Volume 7(11) · Pages 158–160 · DOI: 10.33545/26649926.2025.v7.i11c.735 ↗
Research areasAquatic Ecosystems and Phytoplankton DynamicsFreshwater macroinvertebrate diversity and ecologyPolar Research and Ecology
Abstract
Author-writtenIf zooplankton diversity declines predictably with altitude in Himalayan glacial lakes, then climate-driven changes in glacial meltwater input could reshape these communities from the top down—this was the working hypothesis behind the present research. This research assessed zooplankton community composition, abundance, and diversity across eight glacial lakes spanning an elevation gradient from 2,800 to 4,200 m in Sikkim, northeastern India. Monthly sampling was conducted from May to October 2023 at the Sikkim Institute of Biological Sciences, Gangtok. A total of 47 zooplankton taxa were identified, including 22 Rotifera, 14 Cladocera, and 11 Copepoda. Species richness declined sharply with altitude, from 24 taxa at 2,800 m to 7 taxa at 4,200 m. Shannon diversity index (H') dropped from 2.87 at the lowest site to 1.21 at the highest (r =-0.98, p
Summary
Source-checkedPlain-language reading of the full paper, prepared with AI and checked against the text. Each point links to the authors' own words.
Why it matters
- Himalayan glacial lakes are extreme freshwater environments characterized by cold temperatures, low nutrient levels (oligotrophic), and high UV exposure. View evidence ↗
- Zooplankton are critical to these ecosystems because they link primary producers to higher trophic levels like fish and birds, and their community structure serves as an indicator of overall environmental conditions. View evidence ↗
- There is a lack of systematic zooplankton diversity surveys in the eastern Himalayas compared to the western Himalayas or the Tibetan Plateau. View evidence ↗
The question
- The study aimed to assess zooplankton diversity, abundance, and composition across eight glacial lakes in Sikkim along an elevation gradient and determine which environmental variables drive these variations. View evidence ↗
What they did
- The study examined eight glacial lakes in Sikkim, India, ranging in elevation from 2,800 to 4,200 meters. View evidence ↗
- Sampling was performed monthly between May and October 2023. View evidence ↗
- Zooplankton were collected using vertical tows with a 55-μm mesh net from the surface down to 10 meters at three stations per lake. View evidence ↗
- The researchers concurrently measured several environmental parameters, including water temperature, dissolved oxygen, pH, conductivity, total dissolved solids, chlorophyll-a, and Secchi depth. View evidence ↗
- The study used Canonical Correspondence Analysis (CCA) to relate community composition to environmental variables and Pearson's r to correlate diversity indices with altitude. View evidence ↗
What they found
- The study identified 47 zooplankton taxa in total, consisting of 22 Rotifera, 14 Cladocera, and 11 Copepoda. View evidence ↗
- Species richness declined by 71% as altitude increased, dropping from 24 taxa at 2,800 m to 7 taxa at 4,200 m. View evidence ↗
- The Shannon diversity index (H') showed a strong negative correlation with altitude, decreasing from 2.87 at the lowest site to 1.21 at the highest site. View evidence ↗
- Zooplankton abundance peaked in July for all lakes, with low-altitude lakes reaching 687 individuals L⁻¹ and high-altitude lakes reaching 412 individuals L⁻¹. View evidence ↗
- CCA explained 68.4% of the variance in community composition, identifying water temperature, chlorophyll-a, and dissolved oxygen as the strongest environmental predictors. View evidence ↗
- Community composition shifted with altitude, with Rotifera dominating lower-altitude lakes and Copepoda becoming more prominent at higher elevations. View evidence ↗
What it means
- The authors conclude that these findings provide a quantitative baseline to monitor how climate warming and glacial retreat may alter zooplankton communities in the future. View evidence ↗
Visual summary
3 visualsIllustrations explain the paper; charts are replotted from the paper's own table values.
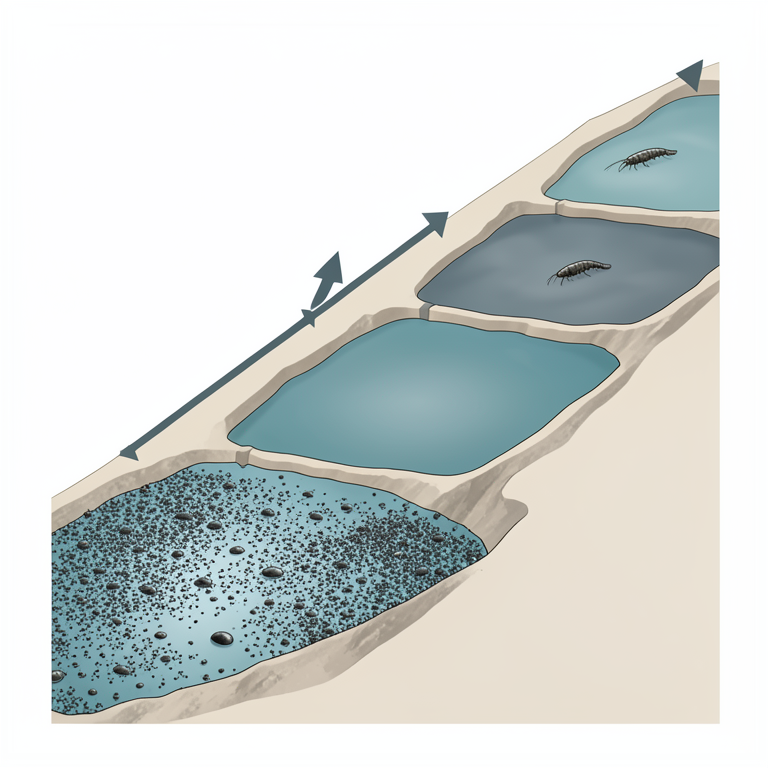
Altitude Gradient and Biodiversity Shift
AI-generated conceptual illustration (Freshwater zooplankton (Rotifera and Copepoda) in Himalayan glacial lakes). It explains the idea and does not show study data.
View source evidence ↗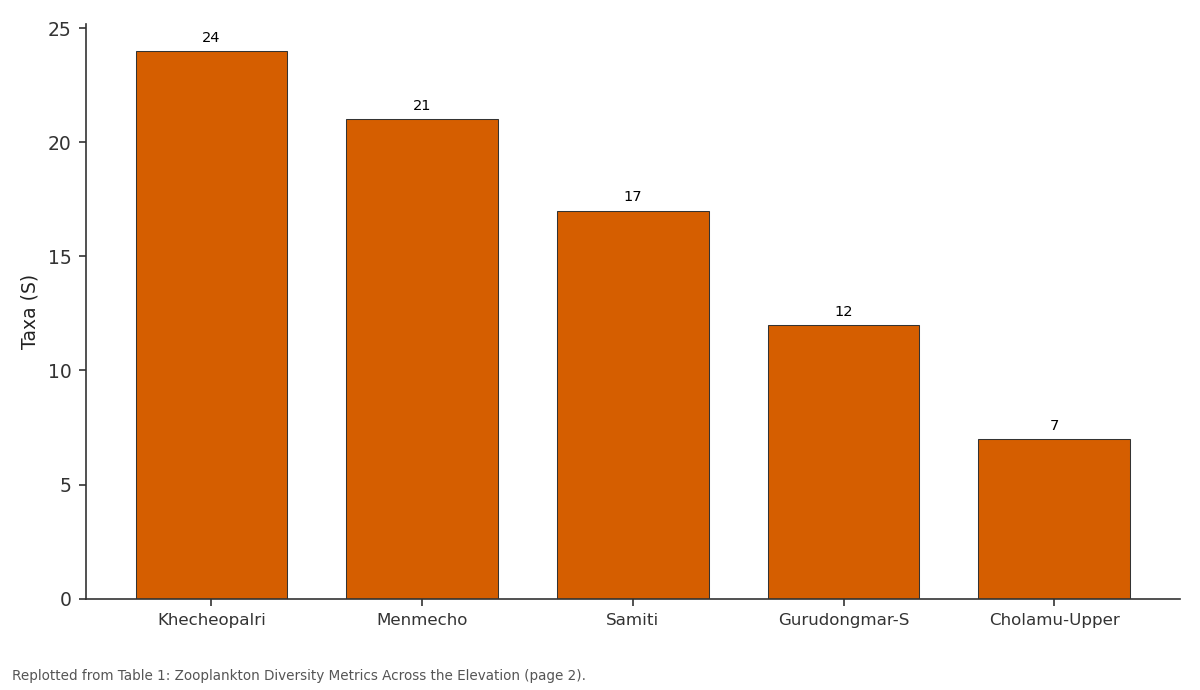
Taxa (S): Khecheopalri vs Menmecho vs Samiti vs Gurudongmar-S vs Cholamu-Upper
Replotted from Table 1 (page 2) of the original paper. Every bar is the paper's own table value.
View source evidence ↗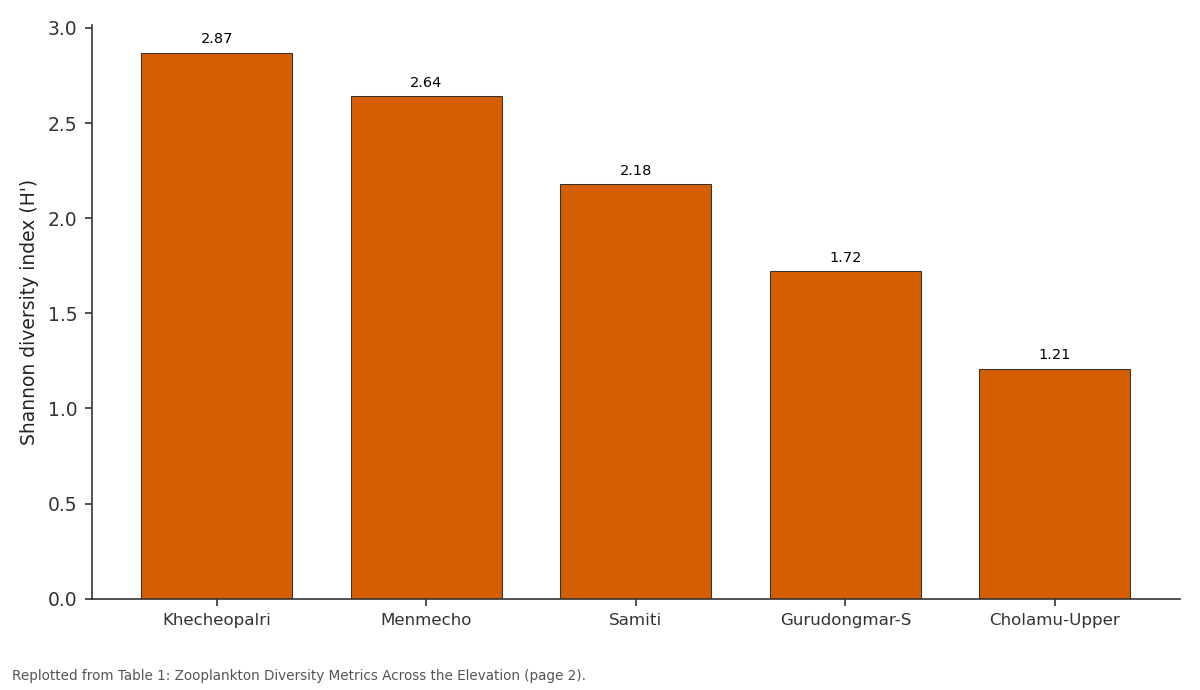
H': Khecheopalri vs Menmecho vs Samiti vs Gurudongmar-S vs Cholamu-Upper
Replotted from Table 1 (page 2) of the original paper. Every bar is the paper's own table value.
View source evidence ↗Figures & tables
From the original paper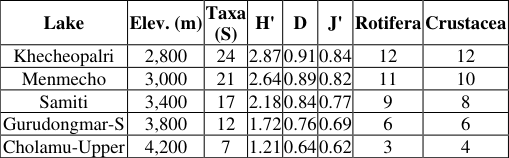 Table 1
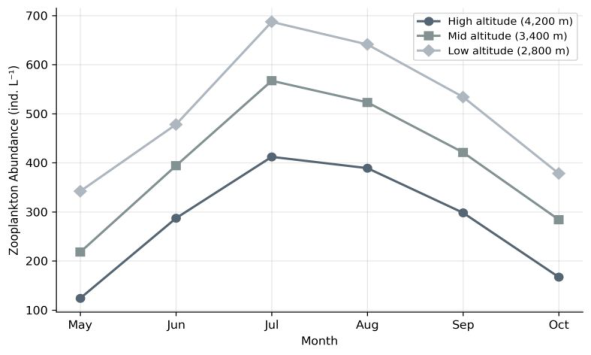 Figure 1
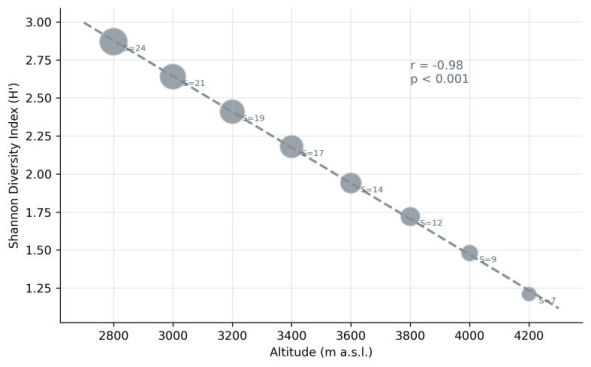 Figure 2
Introduction
If biodiversity follows elevation in the Himalayas the way it does in most mountain systems, then the highest glacial lakes should harbor the fewest species-a prediction that, if confirmed, has practical consequences for predicting how climate change will reshape these ecosystems. Himalayan glacial lakes are among the most extreme freshwater environments on Earth: cold, oligotrophic, UV-exposed, and subject to dramatic seasonal shifts as glacial meltwater pulses through them [1] . Zooplankton sit at a pivotal position in these food webs, linking primary producers to fish and waterbirds, and their community structure reflects integrated environmental conditions in ways that single physical or chemical measurements cannot [2] . Yet systematic surveys of zooplankton diversity across elevation gradients in the eastern Himalayas remain rare, with most available data coming from the western Himalayan states or the Tibetan Plateau [3,4] . Sikkim, wedged between Nepal and Bhutan, contains over 300 glacial lakes spanning a 2,000 m elevation range within a compact geographic areaideal for testing how altitude shapes community composition while minimizing confounding regional effects [5] . This research aimed to survey zooplankton diversity, abundance, and community composition across eight glacial lakes on an elevation gradient in Sikkim and to identify the environmental variables driving community variation. (4,200 m). Monthly sampling at each lake was conducted by collecting vertical tows with a 55-μm mesh plankton net from 10 m depth to the surface at three stations per lake.
Methods
Zooplankton samples were preserved in 4% buffered formalin and identified to the lowest practical taxonomic level under a Leica S9i stereomicroscope using keys by Koste [6] for Rotifera and Dussart and Defaye [7] for Copepoda. Abundance was expressed as individuals per liter. Species richness (S), Shannon diversity index (H'), Simpson's dominance index (D), and Pielou's evenness (J') were calculated for each lake-month combination. Environmental parameters-water temperature, dissolved oxygen, pH, conductivity, total dissolved solids, chlorophyll-a, and Secchi depth-were measured concurrently using standard methods [8] . Canonical correspondence analysis (CCA) in CANOCO v5 tested relationships between zooplankton community composition and environmental variables. Correlation between diversity indices and altitude used Pearson's r.
Sampling Site Characterization
The eight study lakes ranged in surface area from 0.8 ha (Cholamu-Upper) to 12.4 ha (Khecheopalri) and in maximum depth from 4.2 m to 28.7 m. All lakes were fed primarily by glacial meltwater, with supplementary precipitation input during the monsoon months (June-September). Water temperatures during the sampling season ranged from 2.1 °C at Cholamu-Upper in May to 14.8 °C at Khecheopalri in July. Conductivity was uniformly low (12-48 μS/cm), reflecting the dilute glacial source water.
Chlorophyll-a concentrations followed the altitude gradient, from 3.7 μg/L at the lowest site to 0.4 μg/L at the highest. Species richness dropped from 24 taxa at 2,800 m to 7 taxa at 4,200 m-a 71% decline over a 1,400 m elevation range. Shannon diversity showed a near-perfect negative linear relationship with altitude (r =-0.98, p<0.001). Rotifera dominated the lower-altitude communities while Copepoda became proportionally more important at higher elevations. Canonical correspondence analysis explained 68.4% of the total variance in zooplankton community composition across the first two axes. Water temperature (axis 1 loading: 0.87), chlorophyll-a (0.74), and dissolved oxygen (0.69) were the strongest environmental predictors. High-altitude communities were associated with low temperature and chlorophyll-a, while lower-altitude assemblages correlated with warmer, more productive conditions.
Results
Results
Discussion
The sharp decline in zooplankton diversity with altitudelosing roughly one taxon for every 60 m of elevation gained-matches the pattern reported for Himalayan lakes in Ladakh and Nepal, though the gradient appears steeper in Sikkim, possibly due to the greater moisture input from the Bay of Bengal monsoon that supports higher productivity at lower altitudes [3,4] . The dominance of Rotifera at lower elevations likely reflects warmer temperatures and greater food availability from phytoplankton blooms, while the shift toward Copepoda at higher elevations is consistent with their cold-tolerance adaptations and lower metabolic rates [2] . The July abundance peak across all elevations coincides with the monsoon onset, when increased nutrient runoff and warming stimulate primary production [1] . Water temperature emerging as the strongest CCA predictor is consistent with the known thermal sensitivity of zooplankton metabolism and reproduction [5] . As Himalayan glaciers retreat and meltwater contributions shift, these lakes may warm, potentially allowing lower-elevation taxa to colonize higher sites-a process already documented in European alpine lakes [9] . These baseline data are needed to detect such changes.
Conclusion
This research documented a strong negative relationship between zooplankton diversity and altitude across eight Himalayan glacial lakes in Sikkim. Species richness dropped from 24 taxa at 2,800 m to 7 at 4,200 m, with Shannon diversity declining nearly linearly. Water temperature, chlorophyll-a, and dissolved oxygen were the primary environmental drivers of community composition. The July abundance peak reflects monsoon-driven productivity across all elevations. These results establish a quantitative baseline for monitoring how ongoing glacial retreat and climate warming may reshape zooplankton communities in high-altitude Himalayan lakes.
Acknowledgement
Acknowledgements Funding SourcesInternal research funds from the Sikkim Institute of Biological Sciences supported this work. Institutional SupportThe authors thank the Sikkim Institute of Biological Sciences for laboratory and field logistics support, and the Sikkim State Biodiversity Board for research permits.
Figures and tables from the paper
| Lake | Elev. (m) | Taxa (S) | H' | D | J' | Rotifera | Crustacea |
|---|---|---|---|---|---|---|---|
| Khecheopalri | 2,800 | 24 | 2.87 | 0.91 | 0.84 | 12 | 12 |
| Menmecho | 3,000 | 21 | 2.64 | 0.89 | 0.82 | 11 | 10 |
| Samiti | 3,400 | 17 | 2.18 | 0.84 | 0.77 | 9 | 8 |
| Gurudongmar-S | 3,800 | 12 | 1.72 | 0.76 | 0.69 | 6 | 6 |
| Cholamu-Upper | 4,200 | 7 | 1.21 | 0.64 | 0.62 | 3 | 4 |
Table text extracted from the original PDF; superscript letters are shown inline. The original table image is below.
View original table image
References
9 in the original paper- Mani MS. Ecology and Biogeography of High Altitude Insects. The Hague: Springer; 1968.
- Sharma S, Sharma RC. Zooplankton diversity in Himalayan wetlands. Research Journal of Environmental Sciences. 2008;2(5):382-393.
- Bhat NA, Wanganeo A, Raina R. Zooplankton assemblage in Dal Lake, Srinagar, Kashmir with regard to trophic status. Journal of Ecology and the Natural Environment. 2014;6(1):1-7.
- Tartari GA, Tartari G, Mosello R. Water chemistry of high altitude lakes in the Khumbu and Imja Kola valleys (Nepalese Himalayas). Memorie dell'Istituto Italiano di Idrobiologia. 1998;57:51-76.
- Manca M, Comoli P. Biomass estimates of freshwater zooplankton from length-carbon regression equations. Journal of Limnology. 2000;59(1):15-18.
- Koste W. Rotatoria. Die Radertiere Mitteleuropas. Berlin: Gebruder Borntraeger; 1978.
- Dussart BH, Defaye D. Introduction to the Copepoda. Guides to the Identification of Microinvertebrates of Continental Waters of the World. 2001;16:1-344.
- APHA. Standard Methods for the Examination of Water and Wastewater. 23rd ed. Washington, DC: American Public Health Association; 2017.
- Winder M, Schindler DE. Climatic effects on the phenology of lake processes. Global Change Biology. 2004;10(11):1844-1856.