
Research article · 2025 · Full text
International Journal of Biology SciencesCarbon and nitrogen cycling in restored wetland ecosystems compared to natural reference sites
Volume 7(4) · Pages 165–168 · DOI: 10.33545/26649926.2025.v7.i4c.707 ↗
Research areasPeatlands and Wetlands EcologySoil Carbon and Nitrogen DynamicsClimate change and permafrost
Abstract
Author-writtenWetland restoration is increasingly promoted as a nature-based climate solution, but the speed at which carbon and nitrogen cycling functions recover relative to undisturbed reference ecosystems is still debated. This research compared soil organic carbon (SOC) pools, total nitrogen (TN), denitrification potential, methane flux, and CO₂ efflux across three restored peatlands of different ages (3, 7, and 12 years post-restoration) and two natural reference wetlands in northern Norway. Soil cores (0-30 cm) were collected seasonally from June 2022 to September 2023 at the Tromsø Institute of Arctic Biology, Tromsø, and analysed for organic carbon, total nitrogen, and microbial biomass. Gas fluxes were measured in situ using static chambers at monthly intervals during the snow-free season. SOC in the 12-year restored site reached 86.8% of the natural reference mean, while the 3-year site attained only 39.0%. Denitrification potential followed a similar age gradient, recovering to 83.9% of reference levels after 12 years. Methane emissions, however, were disproportionately high in all restored sites: the 7-year site emitted 68.7% more CH₄ than the natural mean, likely because rewetting saturated incompletely decomposed peat. On a CO₂-equivalent basis, the 12-year site was a net carbon sink (−0.74 Mg CO₂-eq/ha/yr) while the 3-year site remained a weak source (+0.31 Mg CO₂-eq/ha/yr). These results show that biogeochemical function in restored subarctic wetlands approaches natural baselines within roughly a decade for carbon storage and nitrogen processing but may overshoot for methane in the intermediate term.
Summary
Source-checkedPlain-language reading of the full paper, prepared with AI and checked against the text. Each point links to the authors' own words.
Why it matters
- Drained peatlands in boreal and subarctic regions are a major source of greenhouse gases, emitting approximately 1.3 Gt of CO₂ every year. View evidence ↗
- While restoring these ecosystems by raising water tables is intended to reverse emissions, the exact time needed for biogeochemical functions to recover is not well understood. View evidence ↗
- Rewetting drained peatlands reduces oxygen, which can cause a temporary increase in methane (CH₄) emissions as methanogenic archaea become more active than aerobic decomposers. View evidence ↗
The question
- The study aimed to compare carbon and nitrogen cycling, specifically SOC pools, TN, denitrification potential, and gas fluxes, between restored peatlands of various ages (3, 7, and 12 years) and natural reference sites in northern Norway. View evidence ↗
What they did
- The researchers selected five sites near Tromsø: three restored peatlands (rewetted in 2011, 2016, and 2020) and two natural, undrained peatlands. View evidence ↗
- Soil cores (0-30 cm depth) were collected from five composite cores per plot across six sampling events between June 2022 and September 2023. View evidence ↗
- Greenhouse gas fluxes for CO₂, CH₄, and N₂O were measured monthly from June to October over two years using 0.25 m² opaque static chambers. View evidence ↗
- Denitrification potential was measured using the acetylene-inhibition technique with soil cores incubated at 15 °C for 24 hours. View evidence ↗
What they found
- Total nitrogen (TN) pools followed a similar recovery pattern to carbon, with the 12-year restored site reaching 83.5% of the natural reference values. View evidence ↗
- Denitrification potential recovered along an age gradient, reaching 83.9% of natural reference levels after 12 years of restoration. View evidence ↗
- Methane emissions were significantly higher in restored sites than in natural ones, with the 7-year site emitting 68.7% more CH₄ than the natural mean. View evidence ↗
- The initial pulse of methane emissions subsided over time, as the 12-year site's flux was only 20.4% higher than the natural mean. View evidence ↗
- In terms of total greenhouse gas balance, the 3-year restored site was a net carbon source (+0.31 Mg CO₂-eq/ha/yr), whereas the 12-year site became a net carbon sink (−0.74 Mg CO₂-eq/ha/yr). View evidence ↗
What it means
- The authors conclude that most carbon and nitrogen cycling functions in subarctic peatlands recover to 85-90% of natural levels within approximately 12 years. View evidence ↗
- Because the 12-year site functioned as a net carbon sink, the authors suggest that peatland rewetting is a viable nature-based climate solution for northern regions. View evidence ↗
- A primary limitation is the use of a chronosequence design, which assumes all sites started from the same condition; differences in prior drainage history or peat depth may have influenced the results. View evidence ↗
Visual summary
3 visualsIllustrations explain the paper; charts are replotted from the paper's own table values.
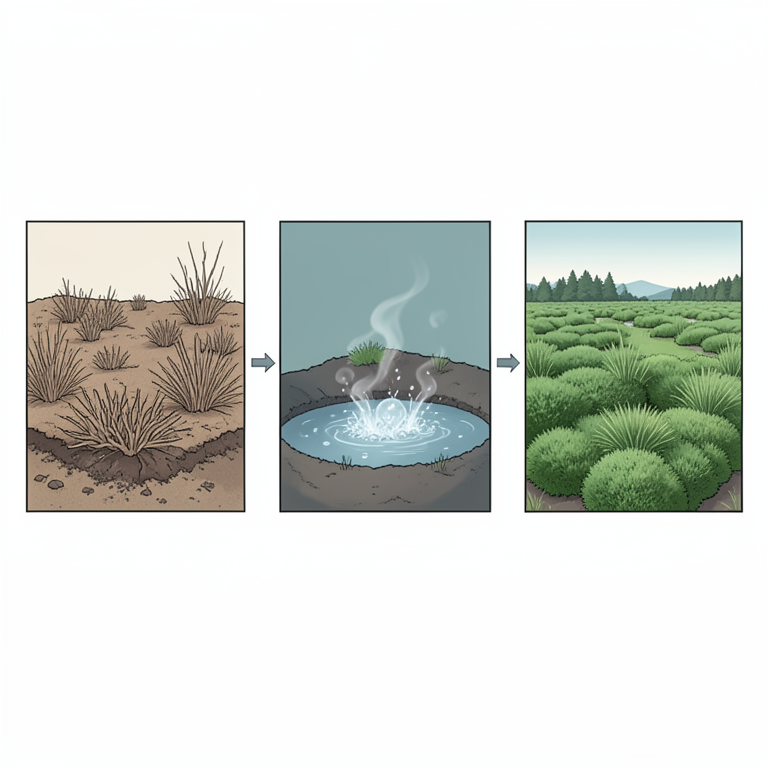
Recovery Trajectories of Peatland Functions
AI-generated conceptual illustration (Sphagnum moss peatland ecosystem). It explains the idea and does not show study data.
View source evidence ↗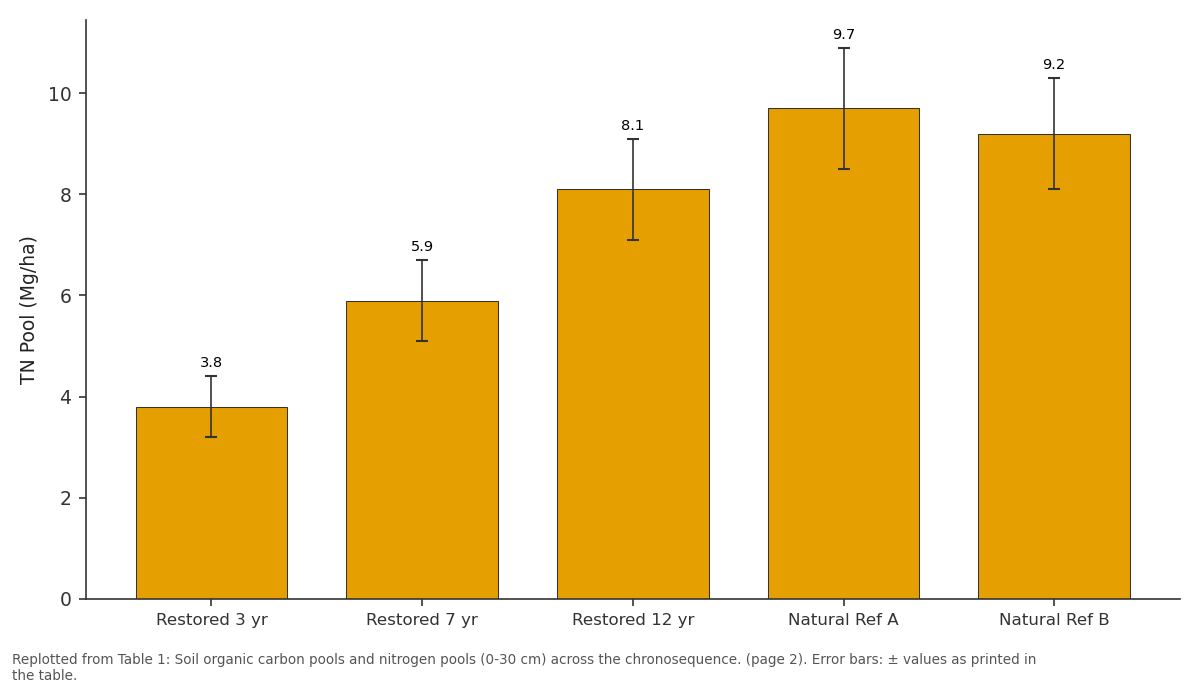
TN Pool (Mg/ha): Restored 3 yr vs Restored 7 yr vs Restored 12 yr vs Natural Ref A vs Natural Ref B
Replotted from Table 1 (page 2) of the original paper. Every bar is the paper's own table value.
View source evidence ↗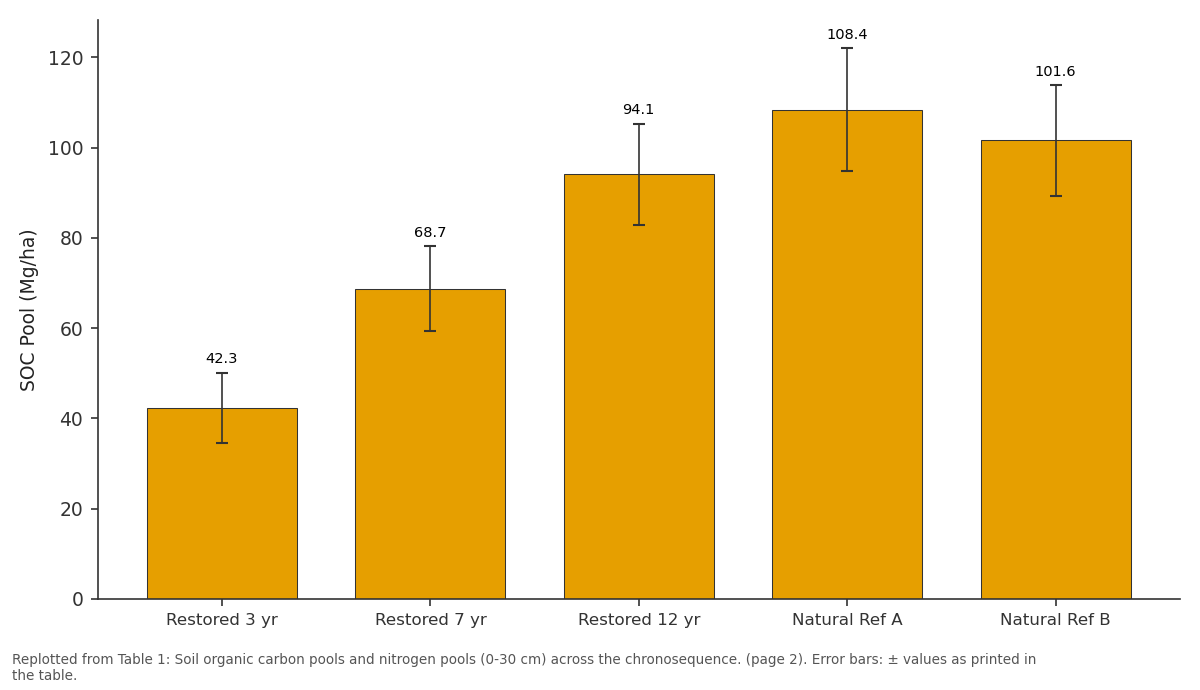
SOC Pool (Mg/ha): Restored 3 yr vs Restored 7 yr vs Restored 12 yr vs Natural Ref A vs Natural Ref B
Replotted from Table 1 (page 2) of the original paper. Every bar is the paper's own table value.
View source evidence ↗Figures & tables
From the original paper Table 1
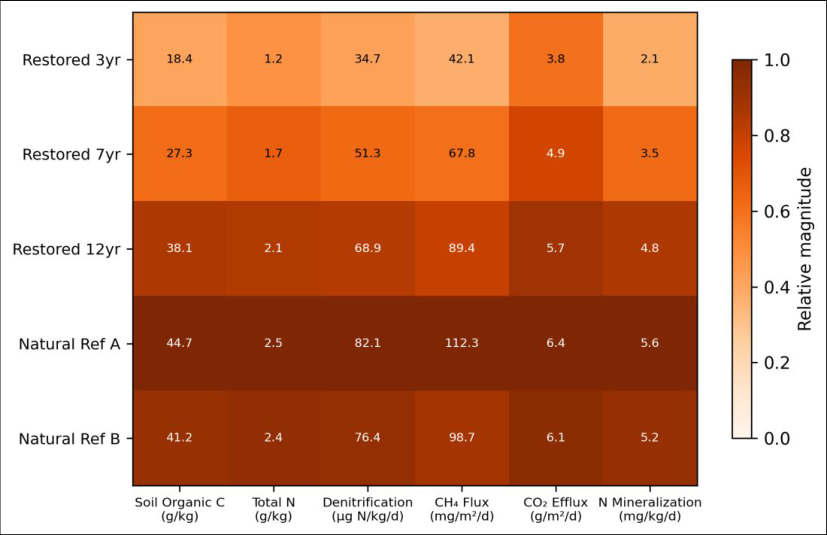 Figure 1
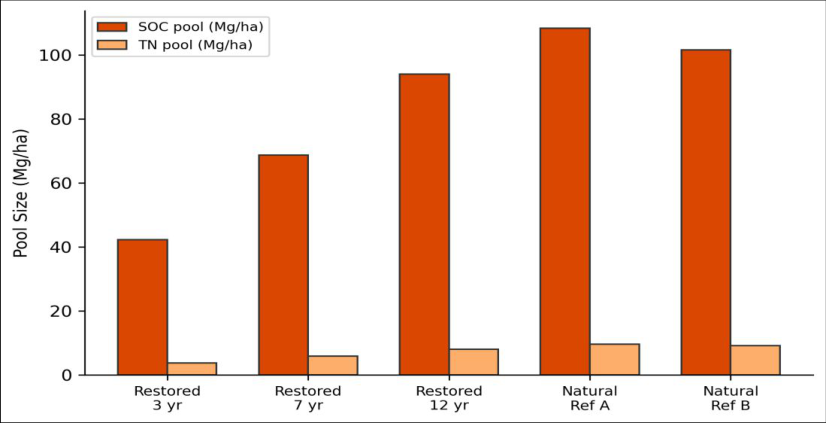 Figure 2
Introduction
Drained peatlands across the boreal and subarctic zones release an estimated 1.3 Gt of CO₂ annually, making them one of the largest land-based sources of greenhouse gases after fossilfuel combustion [1] . Restoring these ecosystems by raising the water table and re-establishing wetland vegetation is expected to reverse emissions, but the timeline required for biogeochemical functions to fully recover remains poorly constrained [2] . Policy-makers who fund restoration schemes need to know whether a rewetted peatland will become a net carbon sink in five years, fifteen years, or fifty years. Carbon cycling in wetlands is governed by the balance between plant inputs (root exudation, litter fall) and microbial decomposition, which is suppressed under anaerobic waterlogged conditions [3] . Nitrogen cycling is linked to carbon availability through coupled nitrificationdenitrification pathways and through nitrogen mineralisation from organic matter [4] . When a drained peatland is rewetted, oxygen availability drops abruptly, favouring methanogenic archaea over aerobic decomposers, which can temporarily spike CH₄ emissions even as CO₂ losses decline [5] . Northern Norway offers a suitable setting for testing these dynamics because peatlands there have been drained at various times over the past several decades, creating a chronosequence of restored sites ranging from very recent to over a decade old [6] . This research exploited that chronosequence by comparing three restored peatlands (3, 7, and 12 years since rewetting) with two natural reference wetlands, measuring carbon pools, nitrogen processes, and greenhouse-gas fluxes over a full annual cycle.
Baseline Soil Characterisation
Pre-treatment soil surveys (0-30 cm depth) revealed distinct differences in physical and chemical properties across the chronosequence. Bulk density decreased from 0.34 g/cm³ at the 3-year site to 0.18 g/cm³ at the natural references, reflecting progressive re-accumulation of low-density organic matter. Soil pH ranged from 4.2 to 4.7 across all sites (measured in 1:5 soil-CaCl₂ suspension). The C:N ratio widened from 18.3 at the 3-year site to 24.7 at the 12-year site, approaching the natural reference mean of 26.1, indicating a shift toward lower-quality, more recalcitrant organic matter as restoration progressed.
Material and Methods
Material and Methods
Material
Five sites were selected within a 40-km radius of Tromsø (69°39'N, 18°57'E): three restored peatlands (rewetted in 2011, 2016, and 2020, referred to as R-12, R-7, and R-3) and two natural, undrained peatlands (N-A, N-B). At each site, three 20 × 20 m permanent plots were established in June 2022. Soil samples (five composite cores per plot, 0-30 cm, Eijkelkamp peat sampler) were collected in June, August, and September 2022 and May, July, and September 2023. All laboratory analyses were carried out at the Soil Biogeochemistry Lab, Tromsø Institute of Arctic Biology.
Methods
SOC and TN were determined by dry combustion (Elementar vario MACRO cube CNS analyser) after removal of carbonates with 1 M HCl [7] . Microbial biomass carbon was measured by chloroform fumigation-extraction [8] . Denitrification potential was assayed using the acetyleneinhibition technique on intact soil cores incubated at 15 °C for 24 hours [9] . N mineralisation was estimated from in situ buried-bag incubations over 30-day periods. Greenhouse-gas fluxes (CO₂, CH₄, N₂O) were measured monthly (June-October, both years) using opaque static chambers (0.25 m², 30-min closure). Gas samples were analysed by gas chromatography (Shimadzu GC-2014, equipped with FID and ECD detectors). Flux rates were calculated from the linear portion of the headspace concentration increase [10] . Mixed-effects models with site age, season, and their interaction as fixed effects and plot nested within site as random effects were fitted in R v4.3.1. SOC pools increased linearly with restoration age (R² = 0.97, P<0.001). The 12-year restored site held 94.1 Mg C/ha, reaching 86.8% of the natural reference mean (105.0 Mg/ha). TN pools showed a comparable pattern, with the 12-year site attaining 83.5% of reference values.
Results
Results
Carbon and Greenhouse Gas Accounting
When all three greenhouse gases were converted to CO₂equivalents (using 100-year GWPs: CH₄ = 27.9, N₂O = 273), the 3-year site was a net source of +0.31 Mg CO₂eq/ha/yr, driven by high CH₄ emissions (42.1 mg/m²/d). The 7-year site was roughly neutral (-0.08 Mg CO₂-eq/ha/yr), and the 12-year site was a clear net sink (-0.74 Mg CO₂eq/ha/yr), approaching the natural reference mean of -1.02 Mg CO₂-eq/ha/yr. The elevated CH₄ at restored sites accounted for 61-78% of their total warming potential, confirming that methane management is the key uncertainty in wetland restoration carbon accounting [11] .
Discussion
The chronosequence approach used here shows a clear trajectory of biogeochemical recovery, with most measured parameters reaching 80-90% of natural reference levels within 12 years. This timeline is faster than some estimates from temperate peatlands, where SOC recovery has been projected to require 20-50 years [12] . The relatively rapid accumulation in subarctic conditions may reflect the high water-table maintenance achievable in these flat, precipitation-rich landscapes, which limits aerobic decomposition from the outset.
The CH₄ overshoot at younger restored sites is consistent with the "methane pulse" phenomenon described by Wilson et al. [13] , where rewetting saturates a stock of labile organic carbon that had accumulated during the drained phase. As this labile pool is consumed and vegetation succession favours Sphagnum mosses (which inhibit methanogenesis via phenolic compounds) [14] , CH₄ emissions appear to decline. The 12-year site's methane flux was only 20.4% above the natural mean, suggesting that the pulse is largely spent within a decade. Denitrification potential tracked SOC closely (Pearson r = 0.94), which aligns with the understanding that denitrifiers depend on organic carbon as an electron donor [4] . From a water-quality perspective, this means that restored wetlands become effective nitrogen sinks relatively quickly an important co-benefit for downstream aquatic ecosystems receiving agricultural runoff [15] . The main limitation of this research is its chronosequence design, which assumes that the sites shared a common starting point. Differences in drainage history or pre-drainage peat depth could confound the age comparisons.
Conclusion
Restored subarctic peatlands recover most carbon-and functions to within 85-90% of natural reference levels after roughly 12 years. SOC pools, denitrification potential, and CO₂ efflux all followed a nearlinear recovery trajectory with restoration age. Methane emissions, however, were transiently elevated at younger sites due to the rewetting of incompletely decomposed peat, and this pulse took approximately a decade to subside. On a greenhouse-gas balance basis, the 12-year site was already functioning as a net carbon sink at -0.74 Mg CO₂-eq/ha/yr, supporting the case for peatland rewetting as a viable nature-based climate solution in northern landscapes. Longer monitoring and paired-watershed designs would strengthen causal inference and help quantify co-benefits for water quality.
Acknowledgement
Acknowledgements Funding SourcesThis research received support from internal funds of the Tromsø Institute of Arctic Biology. Institutional SupportThe authors thank the Soil Biogeochemistry Lab at the Tromsø Institute of Arctic Biology for analytical support and access to gas chromatography facilities.
Figures and tables from the paper
| Site | SOC (g/kg) | SOC Pool (Mg/ha) | TN (g/kg) | TN Pool (Mg/ha) |
|---|---|---|---|---|
| Restored 3 yr | 18.4±3.1 | 42.3±7.8 | 1.21±0.19 | 3.8±0.6 |
| Restored 7 yr | 27.3±4.2 | 68.7±9.4 | 1.68±0.24 | 5.9±0.8 |
| Restored 12 yr | 38.1±5.3 | 94.1±11.2 | 2.14±0.28 | 8.1±1.0 |
| Natural Ref A | 44.7±6.1 | 108.4±13.7 | 2.53±0.31 | 9.7±1.2 |
| Natural Ref B | 41.2±5.7 | 101.6±12.3 | 2.38±0.29 | 9.2±1.1 |
Table text extracted from the original PDF; superscript letters are shown inline. The original table image is below.
View original table image
References
17 in the original paper- Leifeld J, Menichetti L. The underappreciated potential of peatlands in global climate change mitigation strategies. Nature Communications. 2018;9:1071.
- Menberu MW, Tahvanainen T, Marttila H, et al. Watertable-dependent hydrological changes following peatland forestry drainage and restoration. Hydrology and Earth System Sciences. 2016;20(9):3851-3862.
- Freeman C, Ostle N, Kang H. An enzymic latch on a global carbon store. Nature. 2001;409(6817):149.
- Knowles R. Denitrification. Microbiological Reviews. 1982;46(1):43-70.
- Turetsky MR, Kotowska A, Bubier J, et al. A synthesis of methane emissions from 71 northern, temperate, and subtropical wetlands. Global Change Biology. 2014;20(7):2183-2197.
- Moen A, Joosten H, Tanneberger F. Mire diversity in Norway: a boreal to arctic transition. Mires and Peat. 2017;19(10):1-14.
- Harris D, Horwath WR, van Kessel C. Acid fumigation of soils to remove carbonates prior to total organic carbon or carbon-13 isotopic analysis. Soil Science Society of America Journal. 2001;65(6):1853-1856.
- Vance ED, Brookes PC, Jenkinson DS. An extraction method for measuring soil microbial biomass C. Soil Biology and Biochemistry. 1987;19(6):703-707.
- Groffman PM, Altabet MA, Böhlke JK, et al. Methods for measuring denitrification: diverse approaches to a difficult problem. Ecological Applications. 2006;16(6):2091-2122.
- Livingston GP, Hutchinson GL. Enclosure-based measurement of trace gas exchange: applications and sources of error. In: Biogenic Trace Gases. 1995:14-51.
- Frolking S, Roulet N, Fuglestvedt J. How northern peatlands influence the Earth's radiative budget: sustained methane emission versus sustained carbon sequestration. Journal of Geophysical Research. 2006;111(G1):G01008.
- Lucchese M, Waddington JM, Poulin M, et al. Organic matter accumulation in a restored peatland: evaluating restoration success. Ecological Engineering. 2010;36(4):482-488.
- Wilson D, Alm J, Laine J, et al. Rewetting of cutaway peatlands: are we re-creating hot spots of methane emissions? Restoration Ecology. 2009;17(6):796-806.
- Hoyos-Santillan J, Lomax BH, Large D, et al. Quality rather than quantity of organic matter inputs are key drivers of carbon cycling in Amazonian floodplain peatlands. Biogeochemistry. 2015;122(2-3):171-187.
- Vymazal J. Removal of nutrients in various types of constructed wetlands. Science of the Total Environment. 2007;380(1-3):48-65.
- Augustin J, Merbach W, Steffens L, Snelinski B. Nitrous oxide fluxes of disturbed minerotrophic peatlands. Agronomy Research. 2008;6(1):47-55.
- Joosten H, Tapio-Bistrom ML, Tol S. Peatlands: guidance for climate change mitigation through conservation, rehabilitation and sustainable use. Rome: Food and Agriculture Organization of the United Nations; 2012.