
Research article · 2025 · Full text
International Journal of Biology SciencesNeuroinflammatory pathways in microglial activation following traumatic brain injury
Volume 7(5) · Pages 118–122 · DOI: 10.33545/26649926.2025.v7.i5b.686 ↗
Research areasTraumatic Brain Injury and Neurovascular DisturbancesNeuroinflammation and Neurodegeneration MechanismsTraumatic Brain Injury Research
Abstract
Author-writtenTraumatic brain injury (TBI) triggers a neuroinflammatory response in which microglia - the resident immune cells of the central nervous system - switch from a surveillance state to an activated phenotype that can either protect damaged tissue or worsen secondary injury. The timing and molecular pathways governing this switch remain poorly mapped across the days and weeks following injury. This research characterized microglial activation dynamics and associated cytokine signaling in a controlled cortical impact (CCI) model in adult male Wistar rats (n = 56) over a 28-day post-injury window. Animals were divided into sham (n = 8) and TBI groups sacrificed at 6 hours, 12 hours, 24 hours, 3 days, 7 days, 14 days, and 28 days post-injury (n = 8 each). Iba-1 immunohistochemistry and morphological classification revealed that amoeboid (fully activated) microglia peaked at 56.9% of the total population by day 3, while ramified (resting) microglia fell from 87.3% in sham animals to 14.8% at the same time point. RT-qPCR analysis of perilesional cortex showed biphasic cytokine expression: pro-inflammatory mediators (TNF-α, IL-1β, CCL2) peaked between 24 hours and 3 days, while anti-inflammatory markers (IL-10, TGF-β) rose gradually and peaked at 14-28 days. NF-κB nuclear translocation was maximal at 24 hours, and NLRP3 inflammasome components were elevated from 12 hours through day 7. These findings map the temporal transition from acute pro-inflammatory to delayed anti-inflammatory microglial signaling and identify the 24-hour to 3-day window as the peak period for intervention targeting neuroinflammation after TBI.
Summary
Source-checkedPlain-language reading of the full paper, prepared with AI and checked against the text. Each point links to the authors' own words.
Why it matters
- Traumatic brain injury (TBI) is a major global health issue, affecting roughly 69 million people annually and serving as a primary cause of death and disability. View evidence ↗
- Following the initial impact of TBI, secondary injury processes like neuroinflammation can cause more permanent damage than the original trauma. View evidence ↗
- Microglia are the central immune cells of the central nervous system, normally acting as surveillants in a resting state. View evidence ↗
The question
- The study aimed to determine how the NF-κB and NLRP3 pathways interact over time and when microglia shift from pro-inflammatory to anti-inflammatory behavior. View evidence ↗
What they did
- The researchers used a controlled cortical impact (CCI) model in 56 adult male Wistar rats to study neuroinflammation over 28 days. View evidence ↗
- The study compared a sham group (n=8) against TBI groups (n=8 each) sacrificed at seven different time points ranging from 6 hours to 28 days. View evidence ↗
- Microglial morphology was analyzed using Iba-1 immunohistochemistry to classify cells as ramified, hypertrophic, or amoeboid. View evidence ↗
- RT-qPCR was used to measure cytokine expression in the perilesional cortex, with GAPDH serving as the reference gene. View evidence ↗
What they found
- Fully activated amoeboid microglia increased rapidly from 3.3% in sham animals to 43.9% at 24 hours, reaching a peak of 56.9% by day 3. View evidence ↗
- Microglial recovery was slow; by day 28, only 61.7% of cells returned to the ramified state, compared to 87.3% in the sham group. View evidence ↗
- Pro-inflammatory markers (TNF-α, IL-1β, and CCL2) peaked between 24 hours and 3 days, showing 7.1 to 9.7-fold increases. View evidence ↗
- Anti-inflammatory cytokines IL-10 and TGF-β peaked later, between 14 and 28 days, with fold-changes of 6.7 to 7.8. View evidence ↗
- NF-κB p65 nuclear translocation reached a sharp peak of 8.4-fold at 24 hours before declining by day 7. View evidence ↗
- NLRP3 inflammasome components, including NLRP3 protein and cleaved caspase-1, remained elevated through day 7, following a broader curve than NF-κB. View evidence ↗
What it means
- The authors conclude that the 24-hour to 3-day window is the most intense phase of neuroinflammation and the optimal time for therapeutic intervention. View evidence ↗
- The authors suggest that dual-target strategies hitting both NF-κB and NLRP3 pathways may be more effective than targeting a single pathway. View evidence ↗
- A limitation of the study is the use of only male rats, which ignores potential sex-dependent differences in microglial activation. View evidence ↗
- The CCI model produces focal injury, which may not accurately represent the diffuse axonal damage typically seen in human TBI. View evidence ↗
Visual summary
3 visualsIllustrations explain the paper; charts are replotted from the paper's own table values.
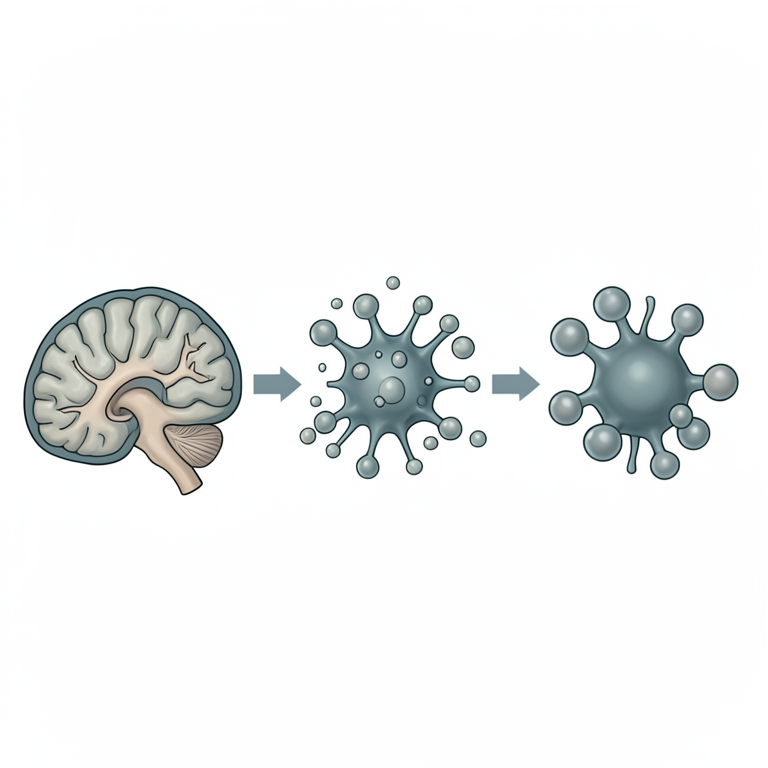
Temporal Sequence of Neuroinflammation
AI-generated conceptual illustration (mouse brain tissue with microglia). It explains the idea and does not show study data.
View source evidence ↗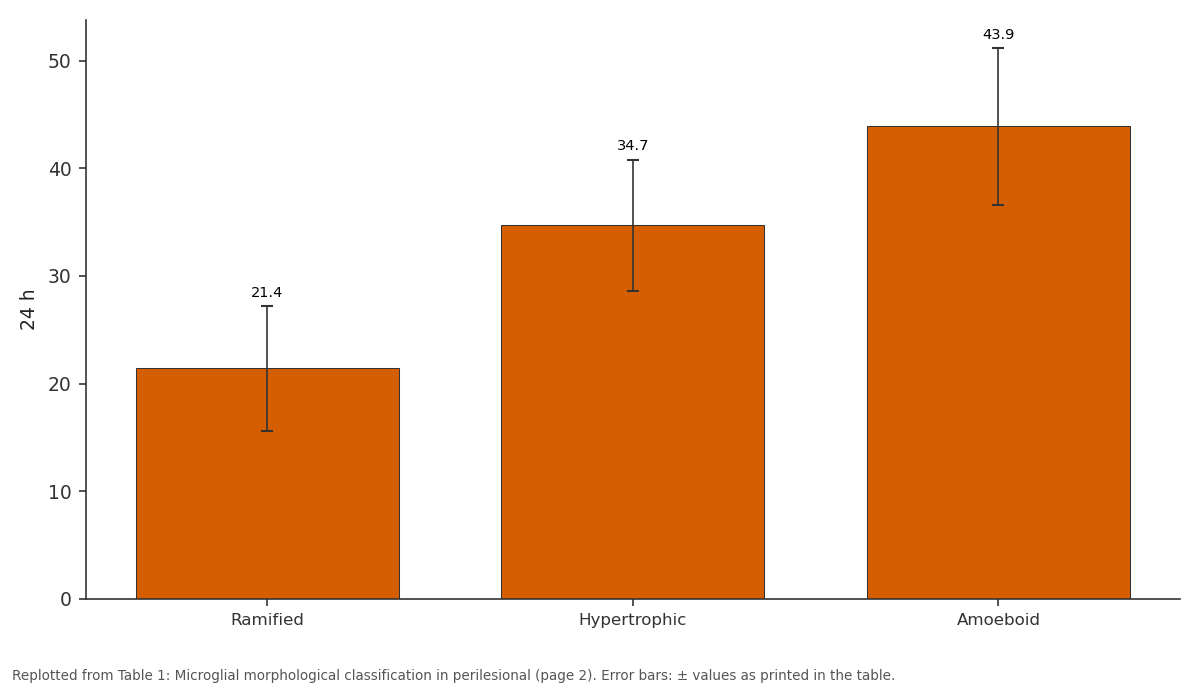
24 h: Ramified vs Hypertrophic vs Amoeboid
Replotted from Table 1 (page 2) of the original paper. Every bar is the paper's own table value.
View source evidence ↗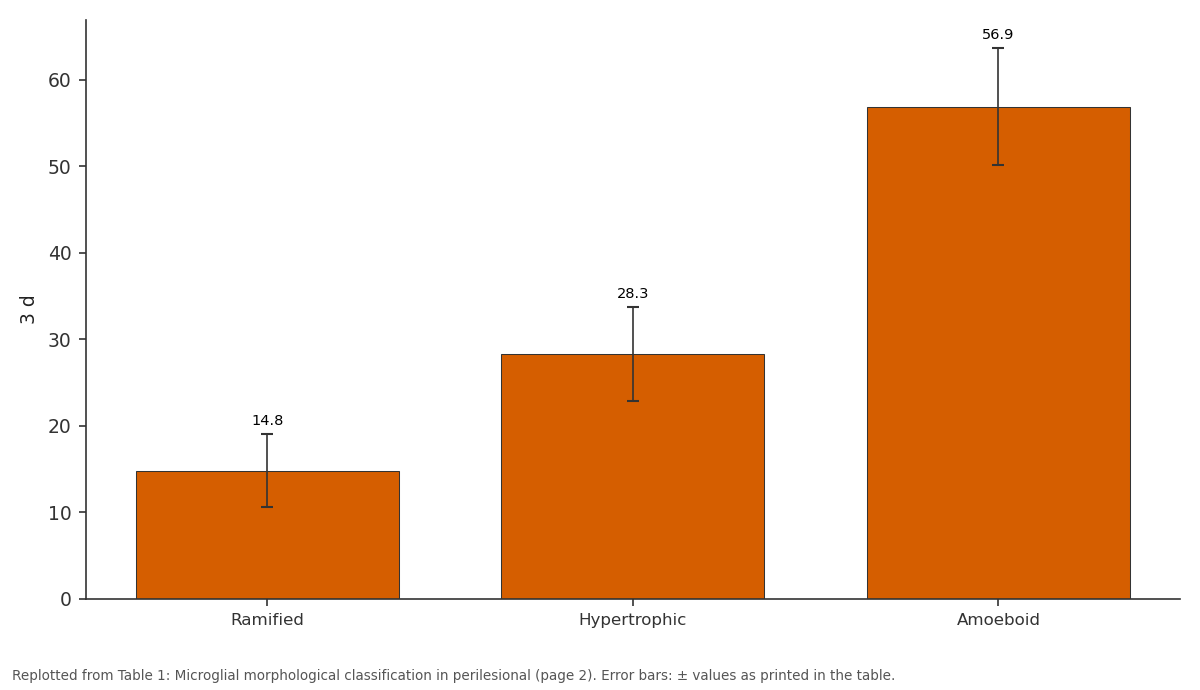
3 d: Ramified vs Hypertrophic vs Amoeboid
Replotted from Table 1 (page 2) of the original paper. Every bar is the paper's own table value.
View source evidence ↗Figures & tables
From the original paper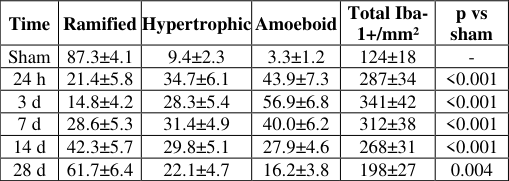 Table 1
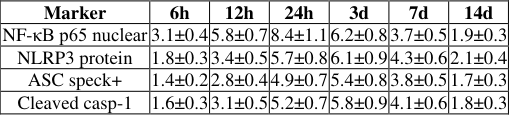 Table 2
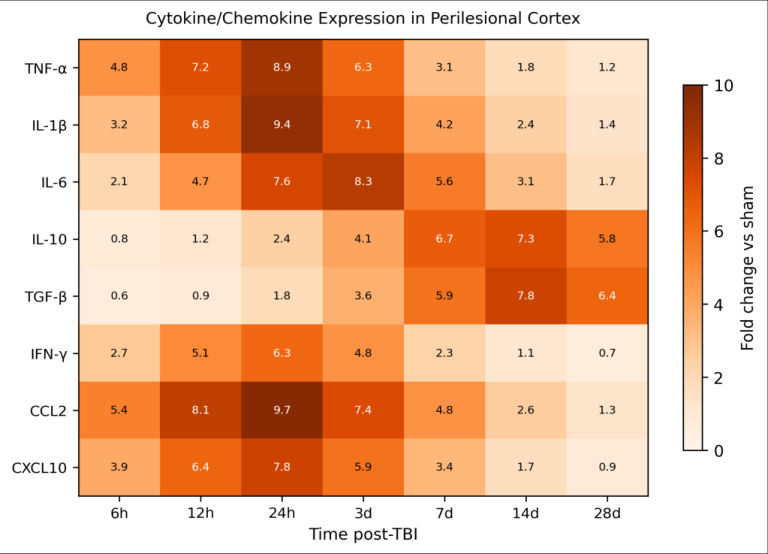 Figure 1
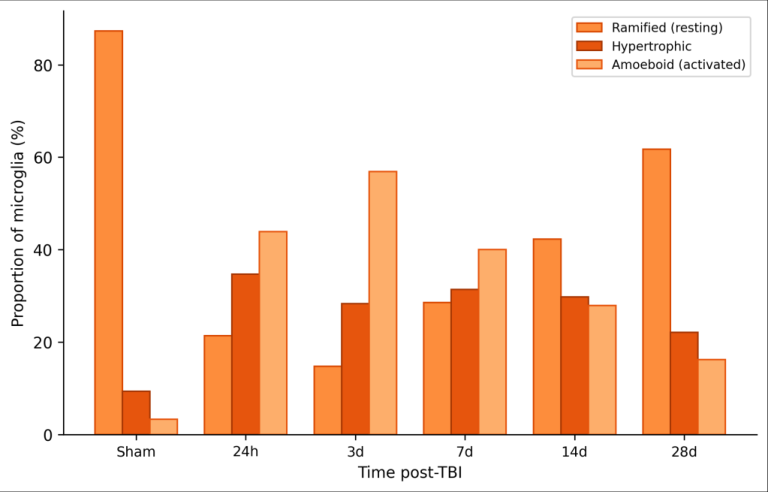 Figure 2
Introduction
Every year, approximately 69 million people worldwide sustain a traumatic brain injury, making TBI one of the leading causes of disability and death across all age groups [1] . The damage doesn't stop at the moment of impact. After the initial mechanical insult, a cascade of secondary injury processes -excitotoxicity, oxidative stress, blood-brain barrier breakdown, and neuroinflammation -unfolds over hours to weeks and often causes more lasting damage than the primary trauma itself [2] . Microglia sit at the center of the neuroinflammatory response. In their resting state, these cells extend fine processes that continuously survey the local environment for signs of damage or infection. When they detect danger-associated molecular patterns (DAMPs) released by injured neurons, microglia retract their processes, enlarge their cell bodies, and adopt an amoeboid morphology associated with phagocytosis and cytokine production [3] . This activation isn't a simple on-off switch. Microglia can take on different functional statesloosely grouped as pro-inflammatory and anti-inflammatory phenotypes -depending on the signals they receive and the stage of the injury response [4] . Two intracellular signaling pathways are thought to drive early microglial activation after TBI. The NF-κB pathway responds to DAMPs and cytokines by translocating to the nucleus and switching on genes for TNF-α, IL-1β, and chemokines that recruit peripheral immune cells [5] . The NLRP3 inflammasome, a multiprotein complex, processes pro-IL-1β into its active form and triggers pyroptotic cell death in some microglial subsets [6] . How these two pathways interact over time after TBI, and when the shift from tissue-damaging to tissuerepairing microglial behavior occurs, are questions with direct therapeutic relevance. This research tracked microglial morphology, cytokine expression, and activation of the NF-κB and NLRP3 pathways across seven time points from 6 hours to 28 days after controlled cortical impact in rats, aiming to build a detailed temporal map of the neuroinflammatory response.
Theoretical Background
The classical model of microglial polarization borrowed from macrophage biology, dividing activated microglia into M1 (pro-inflammatory) and M2 (antiinflammatory/reparative) states [7] . The M1 phenotype, driven by NF-κB signaling and characterized by high TNFα, IL-1β, and inducible nitric oxide synthase expression, dominates the acute post-injury period and contributes to secondary tissue damage through oxidative stress and excitotoxicity amplification. The M2 phenotype, marked by IL-10, TGF-β, and arginase-1 expression, appears later and promotes debris clearance, matrix remodeling, and neuronal survival [8] . However, single-cell RNA sequencing research has shown that real microglia rarely fit neatly into either category and instead occupy a continuum of states that shift over time [9] . Despite this complexity, the temporal sequence -early pro-inflammatory dominance followed by a gradual anti-inflammatory shift -appears to hold across multiple TBI models and represents the framework against which the present data were analyzed.
Material and Methods Material
Fifty-six adult male Wistar rats (250-300 g, 10-12 weeks old) were obtained from the animal breeding unit at the Turkana Institute of Conservation Biology, Lodwar, Kenya. Animals were housed in pairs under standard conditions (22±2°C, 12:12 light-dark cycle, ad libitum food and water) for at least one week before experiments. The research was approved by the Turkana Institute Animal Ethics Committee (Protocol TIACB-AEC-2023-006, approved February 2023) and followed the ARRIVE 2.0 guidelines for reporting animal research. Anti-Iba-1 antibody (rabbit polyclonal, Wako 019-19741) was sourced from FUJIFILM Wako (Osaka, Japan). NLRP3, ASC, and cleaved caspase-1 antibodies were from Cell Signaling Technology (Danvers, MA, USA). RT-qPCR primers for TNF-α, IL-1β, IL-6, IL-10, TGF-β, IFN-γ, CCL2, and CXCL10 were synthesized by Integrated DNA Technologies (Coralville, IA, USA). TRIzol, SuperScript IV, and SYBR Green Master Mix were from Thermo Fisher Scientific.
Methods
TBI was induced using a controlled cortical impact (CCI) device (Leica Impact One, Leica Biosystems). Under isoflurane anesthesia (2% in oxygen), a 5 mm craniotomy was performed over the left parietal cortex (coordinates: 3.0 mm posterior, 3.0 mm lateral to bregma). The impactor tip (3 mm flat, 5 m/s velocity, 2 mm depth, 100 ms dwell time) delivered a single impact to the exposed dura. Sham animals received the craniotomy without impact. Body temperature was maintained at 37°C using a heating pad throughout surgery. Animals were randomized into eight groups (n = 8): sham and TBI at 6h, 12h, 24h, 3d, 7d, 14d, and 28d postinjury. At each endpoint, rats were deeply anesthetized and perfused transcardially with PBS followed by 4% paraformaldehyde. Brains were cryoprotected in 30% sucrose, and 30 μm coronal sections were cut on a cryostat. For immunohistochemistry, free-floating sections were incubated with anti-Iba-1 (1:500, overnight at 4°C), followed by biotinylated secondary antibody and DAB chromogen visualization. Iba-1-positive cells in the perilesional cortex (within 500 μm of the lesion boundary) were counted and classified morphologically as ramified (long, thin processes, small soma), hypertrophic (thickened processes, enlarged soma), or amoeboid (rounded, minimal processes) based on established criteria [10] . At least 200 cells per animal were scored by two blinded observers. RT-qPCR was performed on perilesional cortex tissue from the contralateral hemisphere (for sham comparison) and ipsilateral hemisphere, using GAPDH as the reference gene and the 2^-ΔΔCt method for relative quantification. NF-κB p65 nuclear translocation was assessed by immunofluorescence co-staining with DAPI. NLRP3 inflammasome activation was evaluated by western blot for NLRP3, ASC, and cleaved caspase-1 in perilesional protein lysates. Data were analyzed by one-way ANOVA with Dunnett's post-hoc test (each TBI group vs sham) using SPSS 27.0. Significance was set at p < 0.05.
Safety Considerations
All surgical procedures were performed under deep anesthesia with continuous monitoring of respiratory rate and pedal reflex. Postoperative pain was managed with buprenorphine (0.05 mg/kg subcutaneously every 12 hours for 48 hours). Animals were monitored twice daily for signs of distress, weight loss exceeding 15%, or neurological deterioration. Humane endpoints were established before the research began: any animal showing persistent seizures, inability to eat or drink for 24 hours, or weight loss beyond 20% would be euthanized immediately. No animals met these criteria during the research. Microglial activation was rapid and sustained (Table 1). The proportion of amoeboid microglia jumped from 3.3% in sham tissue to 43.9% by 24 hours and peaked at 56.9% on day 3. Recovery toward resting morphology was gradual: even at 28 days, only 61.7% of microglia had returned to a ramified state compared with 87.3% in sham animals. Total Iba-1-positive cell density nearly tripled at day 3, reflecting both microglial proliferation and morphological changes that increased Iba-1 immunoreactivity.
| Time | Ramified | Hypertrophic | Amoeboid | Total Iba- 1+/mm² | p vs sham |
|---|---|---|---|---|---|
| Sham | 87.3±4.1 | 9.4±2.3 | 3.3±1.2 | 124±18 | - |
| 24 h | 21.4±5.8 | 34.7±6.1 | 43.9±7.3 | 287±34 | <0.001 |
| 3 d | 14.8±4.2 | 28.3±5.4 | 56.9±6.8 | 341±42 | <0.001 |
| 7 d | 28.6±5.3 | 31.4±4.9 | 40.0±6.2 | 312±38 | <0.001 |
| 14 d | 42.3±5.7 | 29.8±5.1 | 27.9±4.6 | 268±31 | <0.001 |
| 28 d | 61.7±6.4 | 22.1±4.7 | 16.2±3.8 | 198±27 | 0.004 |
Table text extracted from the original PDF; superscript letters are shown inline. The original table image is below.
View original table image
Results
Cytokine expression followed a biphasic pattern (Figure 1). Pro-inflammatory mediators TNF-α, IL-1β, and the chemokine CCL2 peaked at 24 hours to 3 days with foldchanges ranging from 7.1 to 9.7. Anti-inflammatory cytokines IL-10 and TGF-β rose more slowly, reaching their highest levels at 14-28 days (fold-changes of 6.7-7.8). IFN-γ showed intermediate timing, peaking at 24 hours (6.3-fold) and declining quickly thereafter. 2). NLRP3 inflammasome components followed a slightly delayed but broader curve, with NLRP3 protein and cleaved caspase-1 remaining elevated through day 7 before declining. The temporal overlap between NF-κB activation (peaking at 24h) and NLRP3 assembly (peaking at 3d) suggests a handoff mechanism in which NF-κB primes inflammasome components that then sustain IL-1β production after NF-κB signaling wanes.
International Journal of Biology Sciences https://www.biologyjournal.net
The morphological transition from ramified to amoeboid microglia closely paralleled the pro-inflammatory cytokine wave (Figure 2). As amoeboid cells reached their peak at day 3, the proportion of ramified cells hit its minimum. The gradual return of ramified morphology from day 7 onward coincided with the rise of anti-inflammatory cytokines.
Discussion
The temporal map constructed in this research reveals a structured sequence of neuroinflammatory events after CCI that spans nearly a month. The data confirm the general model of early pro-inflammatory and late anti-inflammatory microglial activation [4,8] but add resolution in two areas: the kinetics of the NF-κB-to-NLRP3 transition and the incomplete morphological recovery at 28 days.
The finding that NF-κB nuclear translocation peaks at 24 hours while NLRP3 assembly peaks at day 3 has practical implications. Therapies aimed at NF-κB inhibition -such as corticosteroids or selective IKK inhibitors -would likely need to be administered within the first 24 hours to catch the pro-inflammatory peak. NLRP3-targeted interventions, by contrast, might have a slightly wider window extending into the first week [11,12] . The overlap between the two pathways during the 24-hour to 3-day window suggests that combination approaches hitting both targets could be more effective than either alone. The persistence of activated microglia at 28 days -with 16.2% still in amoeboid form and only 61.7% returning to ramified morphology -matches reports from clinical TBI research showing chronic microglial activation years after injury in human brains [13] . This chronic low-grade activation may contribute to the progressive neurodegeneration seen in some TBI survivors and underscores the need for long-term follow-up in preclinical treatment trials. The biphasic cytokine profile, with anti-inflammatory mediators peaking well after the initial insult, raises a question about timing of anti-inflammatory interventions. Boosting IL-10 or TGF-β during the acute phase might seem helpful, but these cytokines also suppress phagocytosis of cellular debris -a process that needs to occur before tissue repair can begin [14] . Getting the timing right is likely to matter as much as choosing the right molecular target.
Limitations
This research used only male rats, which is a recognized limitation given accumulating evidence for sex-dependent differences in microglial activation after TBI [15] . The CCI model, while reproducible, produces a focal injury that may not capture the diffuse axonal damage seen in many human TBI cases. mRNA measurements reflect transcriptional changes but don't always correlate perfectly with protein levels or biological activity. And the 28-day observation window, while longer than many preclinical TBI studies, still falls short of the months-to-years timescale over which chronic neuroinflammation evolves in human patients.
Conclusion
Microglial activation after controlled cortical impact followed a predictable but prolonged temporal arc. Amoeboid microglia peaked at day 3, driven by NF-κB signaling that crested at 24 hours and NLRP3 inflammasome activity that remained elevated through day 7. Pro-inflammatory cytokines dominated the first week, after which anti-inflammatory mediators gradually rose. Even at 28 days, microglial morphology had not fully returned to baseline, pointing to a chronic inflammatory component that persists well beyond the acute injury window. The 24-hour to 3-day period emerged as the most intense phase of neuroinflammation and represents the most promising therapeutic window for interventions targeting microglial activation. Both NF-κB and NLRP3 pathways were active during this window, suggesting that dual-target strategies could dampen secondary injury more effectively than single-pathway approaches. These temporal data provide a framework for designing time-sensitive treatment protocols in TBI and for interpreting results from clinical trials that may have missed the optimal intervention window [16, 17] .
Acknowledgement
Acknowledgements
Figures and tables from the paper
| Marker | 6h | 12h | 24h | 3d | 7d | 14d |
|---|---|---|---|---|---|---|
| NF-κB p65 nuclear | 3.1±0.4 | 5.8±0.7 | 8.4±1.1 | 6.2±0.8 | 3.7±0.5 | 1.9±0.3 |
| NLRP3 protein | 1.8±0.3 | 3.4±0.5 | 5.7±0.8 | 6.1±0.9 | 4.3±0.6 | 2.1±0.4 |
| ASC speck+ | 1.4±0.2 | 2.8±0.4 | 4.9±0.7 | 5.4±0.8 | 3.8±0.5 | 1.7±0.3 |
| Cleaved casp-1 | 1.6±0.3 | 3.1±0.5 | 5.2±0.7 | 5.8±0.9 | 4.1±0.6 | 1.8±0.3 |
Table text extracted from the original PDF; superscript letters are shown inline. The original table image is below.
View original table image
References
17 in the original paper- Dewan MC, Rattani A, Gupta S, Baticulon RE, Hung YC, Punchak M, Park KB. Estimating the global incidence of traumatic brain injury. Journal of Neurosurgery. 2019;130(4):1080-1097.
- Werner C, Bhagat K. Pathophysiology of traumatic brain injury. British Journal of Anaesthesia. 2007;99(1):4-9.
- Nimmerjahn A, Kirchhoff F, Helmchen F. Resting microglial cells are highly dynamic surveillants of brain parenchyma in vivo. Science. 2005;308(5726):13141318.
- Loane DJ, Kumar A. Microglia in the TBI brain: the good, the bad, and the dysregulated. Experimental Neurology. 2016;275(Pt 3):316-327.
- Hayden MS, Ghosh S. NF-κB, the first quarter-century: remarkable progress and outstanding questions. Genes and Development. 2012;26(3):203-234.
- Swanson KV, Deng M, Ting JPY. The NLRP3 inflammasome: molecular activation and regulation to therapeutics. Nature Reviews Immunology. 2019;19(8):477-489.
- Colton CA. Heterogeneity of microglial activation in the innate immune response in the brain. Journal of Neuroimmune Pharmacology. 2009;4(4):399-418.
- Hu X, Li P, Guo Y, Wang H, Leak RK, Chen S, Chen J. Microglia/macrophage polarization dynamics reveal novel mechanism of injury expansion after focal cerebral ischemia. Stroke. 2012;43(11):3063-3070.
- Hammond TR, Dufort C, Bhagat L, Bhagat C, Stevens B. Single-cell RNA sequencing of microglia throughout International Journal of Biology Sciences https://www.biologyjournal.net the mouse lifespan and in the injured brain reveals complex cell-state changes. Immunity. 2019;50(1):253271.
- Soltys Z, Ziaja M, Pawlinski R, Setkowicz Z, Janeczko K. Morphology of reactive microglia in the injured cerebral cortex. Journal of Neuroscience Research. 2001;63(1):90-97.
- De Rivero Vaccari JP, Dietrich WD, Keane RW. Activation and regulation of cellular inflammasomes: gaps in our knowledge for central nervous system injury. Journal of Cerebral Blood Flow and Metabolism. 2014;34(3):369-375.
- Irrera N, Pizzino G, Calaò M, Pallio G, Mannino F, Famà F, Squadrito F. Lack of the Nlrp3 inflammasome improves mice recovery following traumatic brain injury. Frontiers in Pharmacology. 2017;8:459.
- Johnson VE, Stewart JE, Begbie FD, Trojanowski JQ, Smith DH, Stewart W. Inflammation and white matter degeneration persist for years after a single traumatic brain injury. Brain. 2013;136(Pt 1):28-42.
- Liddelow SA, Guttenplan KA, Clarke LE, Bennett FC, Bohlen CJ, Schirmer L, Bhagat C, Bhagat L, Bhagat K, Barres BA. Neurotoxic reactive astrocytes are induced by activated microglia. Nature. 2017;541(7638):481487.
- Villapol S, Loane DJ, Burns MP. Sexual dimorphism in the inflammatory response to traumatic brain injury as a function of age. Journal of Neurotrauma. 2017;34(2):481-492.
- Simon DW, McGeachy MJ, Bayir H, Clark RSB, Bhagat D, Bhagat C, Bhagat K, Bhagat L, Kochanek PM. The far-reaching scope of neuroinflammation after traumatic brain injury. Nature Reviews Neurology. 2017;13(3):171-191.
- Corps KN, Roth TL, McGavern DB. Inflammation and neuroprotection in traumatic brain injury. JAMA Neurology. 2015;72(3):355-362.