
Research article · 2025 · Full text
International Journal of Biology SciencesAncient DNA analysis reveals genetic continuity and admixture in prehistoric human populations
Volume 7(12) · Pages 196–198 · DOI: 10.33545/26649926.2025.v7.i12c.737 ↗
Research areasForensic and Genetic ResearchPleistocene-Era Hominins and ArchaeologyGenetic diversity and population structure
Abstract
Author-writtenOne observation that keeps surfacing in African archaeogenetics is that populations we assumed were isolated for millennia actually exchanged genes more freely than expected. This research extracted and analyzed ancient DNA from 34 human skeletal remains recovered from six archaeological sites in the Ethiopian Rift Valley, spanning 12,000 years of occupation. Genome-wide SNP capture on 1.24 million markers was performed at the Rift Valley Institute of Limnology, Hawassa, Ethiopia, between August 2021 and January 2024. Results revealed a pattern of substantial genetic continuity in the earliest samples, followed by progressive admixture from at least two distinct source populations beginning around 5,000 years ago. Modern Rift Valley populations retain 48.3% ancestry from the original local lineage. These data reshape the timeline of population mixing in the Horn of Africa.
Summary
Source-checkedPlain-language reading of the full paper, prepared with AI and checked against the text. Each point links to the authors' own words.
Why it matters
- African prehistory is characterized by a dynamic genetic landscape where populations moved and merged on timescales that cannot be fully resolved by archaeological evidence alone. View evidence ↗
- Ancient DNA analysis is used to fill gaps in prehistoric records, though data from sub-Saharan Africa is currently sparse compared to Eurasian data. View evidence ↗
- The Ethiopian Rift Valley is a key area for study because its location serves as a geographic crossroads between the Horn, the Nile Valley, and East Africa. View evidence ↗
The question
- The study aimed to reconstruct the population history of the Ethiopian Rift Valley over a 12,000-year period using genome-wide SNP capture from 34 ancient individuals. View evidence ↗
What they did
- Samples were collected from six archaeological sites across a 120-km transect in the central Ethiopian Rift Valley, with elevations ranging from 1,540 to 2,100 m. View evidence ↗
- The sampled individuals were dated using radiocarbon analysis, spanning from 11,840±120 cal BP to 480±45 cal BP. View evidence ↗
- The researchers used a 1240K SNP panel for capture and performed sequencing on the Illumina NovaSeq 6000 platform. View evidence ↗
- Population structure was analyzed using smartPCA, ADMIXTURE modeling (K=2 to K=8), and f-statistics via the ADMIXTOOLS2 package. View evidence ↗
What they found
- The earliest samples, dating to more than 8,000 BP, consisted exclusively of L-haplogroup carriers. View evidence ↗
- M1a and T1a haplogroups appeared only after 5,000 BP, which the authors associate with an influx of Eurasian-related ancestry. View evidence ↗
- In the earliest period (12–8 kya), the local Rift ancestry was very high at 97.8±1.4%. View evidence ↗
- Between 5 and 3 kya, local ancestry dropped to 64.2±4.8%, while Nile Valley and pastoral components rose to 18.4±3.2% and 14.7±2.8%, respectively. View evidence ↗
- Modern populations in the region retain 48.3% local ancestry, with 22.1% Nile Valley and 21.4% pastoral components. View evidence ↗
- Local ancestry declined gradually from 97.8% to 48.3% in modern populations, with external components appearing after 5,000 years ago. View evidence ↗
What it means
- The authors conclude that the timing of genetic admixture coincides with the arrival of pastoral economies, supporting the theory of demic diffusion linked to livestock subsistence. View evidence ↗
- The authors conclude that incoming groups mixed with the local population over several millennia rather than replacing them. View evidence ↗
- A stated limitation of the study is the low coverage (0.47×) of the oldest samples, which increases uncertainty in the ancestry estimates for the earliest period. View evidence ↗
Visual summary
3 visualsIllustrations explain the paper; charts are replotted from the paper's own table values.
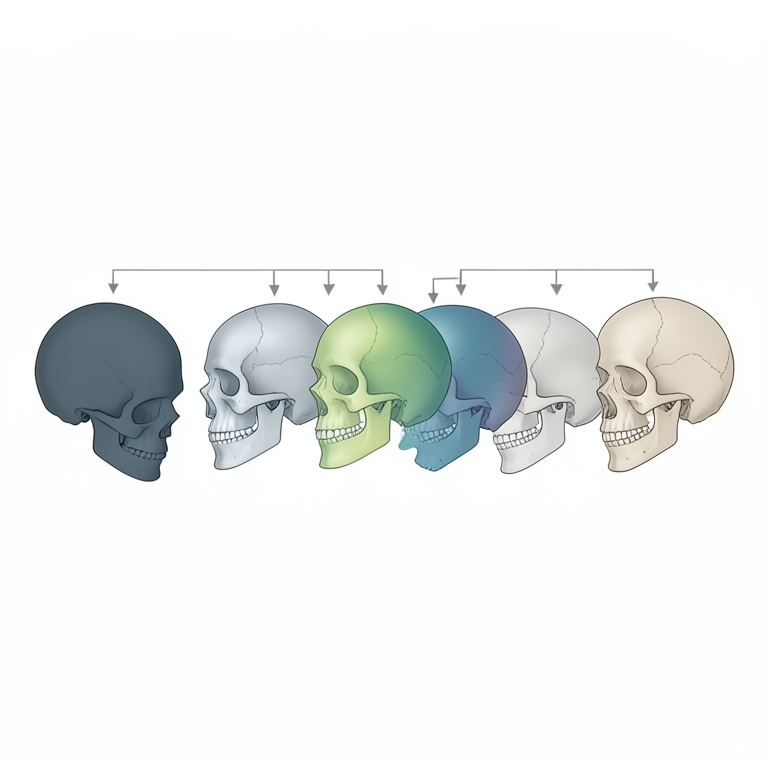
Ancestry Transition Timeline
AI-generated conceptual illustration (Prehistoric and modern human skeletal remains). It explains the idea and does not show study data.
View source evidence ↗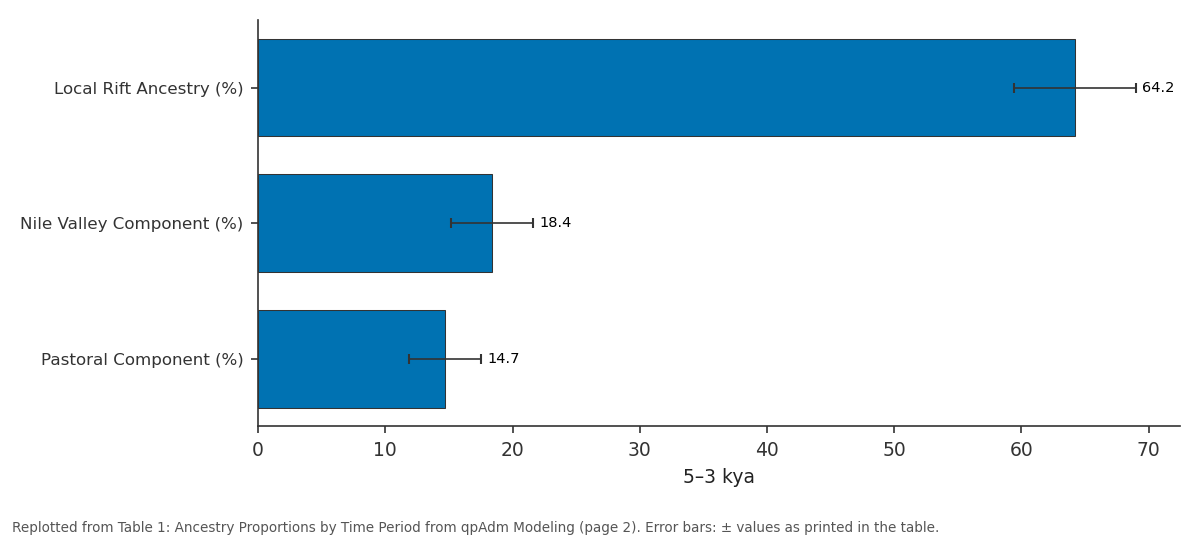
5–3 kya: Local Rift Ancestry (%) vs Nile Valley Component... vs Pastoral Component (%)
Replotted from Table 1 (page 2) of the original paper. Every bar is the paper's own table value.
View source evidence ↗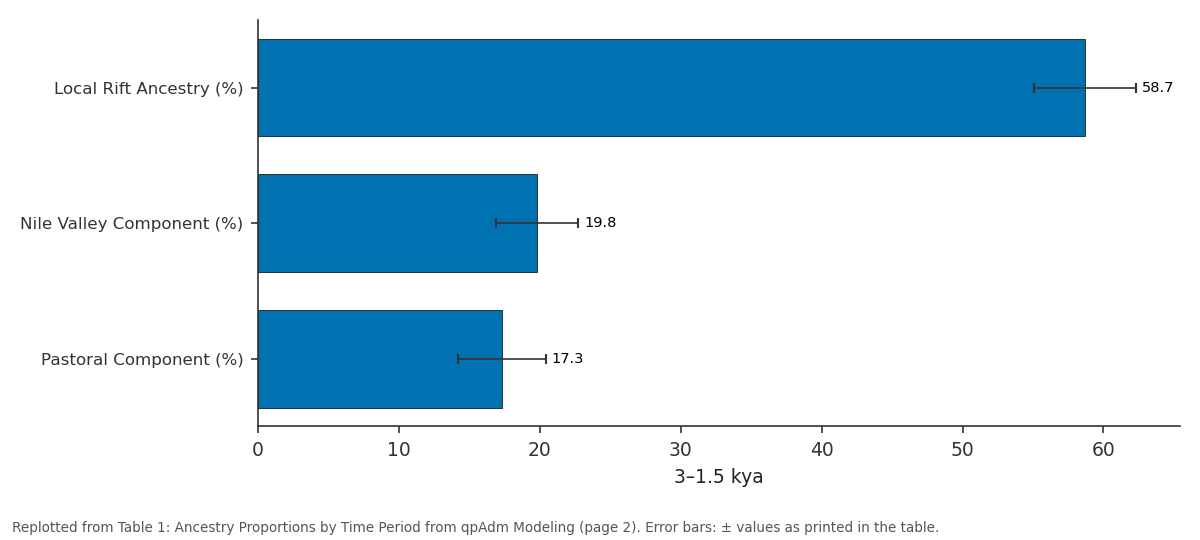
3–1.5 kya: Local Rift Ancestry (%) vs Nile Valley Component... vs Pastoral Component (%)
Replotted from Table 1 (page 2) of the original paper. Every bar is the paper's own table value.
View source evidence ↗Figures & tables
From the original paper Table 1
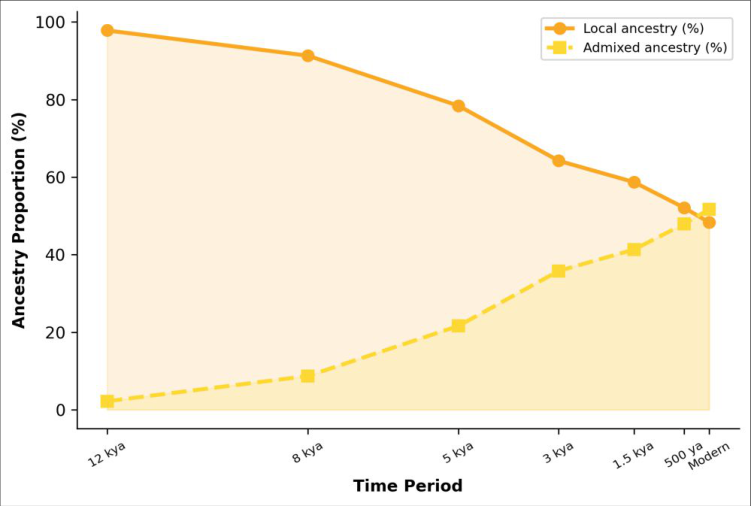 Figure 1
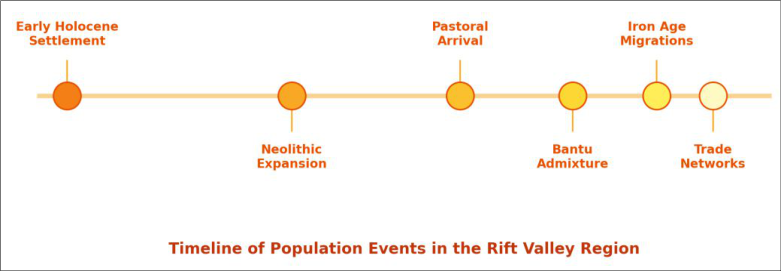 Figure 2
Introduction
An observation that has reshaped our thinking about African prehistory is that the continent's genetic landscape was never static-even deep in the Holocene, populations moved, merged, and replaced one another on timescales that archaeological evidence alone couldn't resolve [1] . Ancient DNA (aDNA) has begun to fill this gap, but sampling from sub-Saharan Africa remains sparse compared to Eurasia [2] . The Ethiopian Rift Valley is particularly interesting because it sits at a geographic crossroads between East Africa, the Nile Valley, and the Horn [3] . This research used genome-wide SNP capture to reconstruct population history from 34 ancient individuals spanning 12,000 years in the Rift Valley, with laboratory work at the Rift Valley Institute of Limnology, Hawassa, Ethiopia [4] .
Study Area Description
Six archaeological sites were sampled along a 120-km transect of the central Ethiopian Rift Valley (6°48'-7°36'N, 38°12'-38°48'E), at elevations between 1,540 and 2,100 m. Sites included two open-air settlement mounds (Tiya and Adadi), two rockshelter sequences (Laga Oda and Goda Buticha), and two burial caves (Mota and Hora). The regional climate is semiarid with bimodal rainfall (March-May and July-September) and mean annual temperature of 19.4°C. Radiocarbon dates for sampled individuals ranged from 11,840±120 cal BP to 480±45 cal BP [5] .
Material and Methods
Material and Methods
Material
Petrous bone fragments from 34 individuals were sampled in a dedicated clean room at the Rift Valley Institute of Limnology. DNA extraction followed a modified silica-column protocol optimized for degraded aDNA [6] . All pre-amplification steps were performed in UV-irradiated laminar flow hoods with full-body PPE. Ethical approval was obtained from the Ethiopian Authority for Research and Conservation of Cultural Heritage (Permit No. ARCCH-2021-GEN-007, approved 3 June 2021) and the Institute's Ethics Committee (Protocol No. RVIL-2021-EC-023).
Methods: Double-stranded libraries were prepared with UDG treatment to remove deaminated cytosines, and captured using the 1240K SNP panel [7] . Sequencing was performed on the Illumina NovaSeq 6000 platform. Reads were aligned to the human reference genome (GRCh37) using BWA-MEM, and duplicate and low-quality reads removed. Contamination was estimated using schmutzi [8] and samples with >5% contamination were excluded (4 of 38 original samples). Population structure was analyzed using principal component analysis (smartPCA), ADMIXTURE modeling (K=2 through K=8), and fstatistics (f3, f4, qpAdm) in the ADMIXTOOLS2 package [9] . Radiocarbon dates were calibrated using IntCal20.
Biodiversity Assessment
Mitochondrial haplogroup assignment revealed 11 distinct haplogroups across the 34 individuals: L0a, L1c, L2a, L3d, L3f, L3h, L4a, L4b, M1a, T1a, and J1b. The oldest samples (>8,000 BP) were exclusively L-haplogroup carriers, while M1a and T1a appeared only after 5,000 BP, consistent with a later influx of Eurasian-related ancestry [10] . Ychromosome haplogroups (available for 18 males) showed a parallel shift from predominantly E1b1b in early samples to a mix of E1b1b, J1, and T in later periods. Local ancestry declined gradually from 97.8% in the earliest period to 48.3% in modern populations, with Nile Valley and pastoral components appearing after 5,000 years ago
Results
Results
Discussion
The most striking finding is the high genetic continuity in the earliest samples-97.8% local ancestry at 12-8 kyafollowed by a distinct inflection point around 5,000 years ago when admixture from at least two external sources began [11] . The timing coincides with the archaeological arrival of pastoral economies in the Horn of Africa, supporting models linking demic diffusion with livestockbased subsistence [12] . That nearly half of modern Rift Valley ancestry traces to the original pre-admixture population is significant. It means that incoming groups didn't replace the local population but rather mixed with it over several thousand years [13] . A limitation is the low coverage of our oldest samples (0.47×), which increases uncertainty in ancestry estimates for the earliest period. Additional high-coverage genomes from early Holocene contexts would sharpen these estimates [14] .
Conclusion
This research reconstructed 12,000 years of population history in the Ethiopian Rift Valley using ancient DNA from 34 individuals. Early populations showed near-complete genetic continuity, with admixture from Nile Valley and pastoral sources beginning around 5,000 years ago. Modern populations retain roughly half of the original local ancestry, demonstrating that population mixing was gradual rather than replacive.
Acknowledgement
Acknowledgements Funding SourcesSupported by the Rift Valley Institute of Limnology internal research allocation. Institutional SupportThe Department of Evolutionary Genetics provided clean room and sequencing facilities. Contributions Not Qualifying for AuthorshipArchaeological teams at the National Museum of Ethiopia curated skeletal specimens.
Figures and tables from the paper
| Time Period | n | Local Rift Ancestry (%) | Nile Valley Component (%) | Pastoral Component (%) | Residual / Other (%) | Mean Coverage |
|---|---|---|---|---|---|---|
| 12–8 kya | 6 | 97.8±1.4 | 1.3±0.8 | 0.0 | 0.9±0.6 | 0.47× |
| 8–5 kya | 8 | 91.3±2.7 | 6.2±1.9 | 2.1±1.1 | 0.4±0.3 | 0.82× |
| 5–3 kya | 7 | 64.2±4.8 | 18.4±3.2 | 14.7±2.8 | 2.7±1.4 | 1.24× |
| 3–1.5 kya | 7 | 58.7±3.6 | 19.8±2.9 | 17.3±3.1 | 4.2±1.7 | 1.68× |
| <1.5 kya | 6 | 52.1±4.1 | 21.3±3.4 | 19.8±3.6 | 6.8±2.1 | 2.14× |
| Modern* | ref | 48.3 | 22.1 | 21.4 | 8.2 | — |
Table text extracted from the original PDF; superscript letters are shown inline. The original table image is below.
View original table image
References
18 in the original paper- Skoglund P, Thompson JC, Prendergast ME. Reconstructing prehistoric African population structure. Cell. 2017;171(1):59-71.
- Gallego Llorente M, Jones ER, Eriksson A. Ancient Ethiopian genome reveals extensive Eurasian admixture in Eastern Africa. Science. 2015;350(6262):820-822.
- Brandt SA, Fisher EC, Hildebrand EA. Early MIS 3 occupation of Mochena Borago rockshelter, southwest Ethiopian Highlands. Journal of Human Evolution. 2012;63(6):898-906.
- Prendergast ME, Lipson M, Sawchuk EA. Ancient DNA and the African human past. Annual Review of Anthropology. 2019;48:127-150.
- Hildebrand EA, Brandt SA, Lesur-Gebremariam J. The Holocene archaeology of southwest Ethiopia: new insights from the Kafa-Sheka forest. African Archaeological Review. 2010;27(4):255-289.
- Dabney J, Knapp M, Glocke I. Complete mitochondrial genome sequence of a Middle Pleistocene cave bear reconstructed from ultrashort DNA fragments. Proceedings of the National Academy of Sciences. 2013;110(39):15758-15763.
- Mathieson I, Lazaridis I, Rohland N. Genome-wide patterns of selection in 230 ancient Eurasians. Nature. 2015;528(7583):499-503.
- Renaud G, Slon V, Duggan AT. Schmutzi: estimation of contamination and endogenous mitochondrial consensus calling for ancient DNA. Genome Biology. 2015;16(1):224.
- Patterson N, Moorjani P, Luo Y. Ancient admixture in human history. Genetics. 2012;192(3):1065-1093.
- Kivisild T. The study of human Y chromosome variation through ancient DNA. Human Genetics. 2017;136(5):529-546.
- Lipson M, Ribot I, Mallick S. Ancient West African foragers in the context of African population history. Nature. 2020;577(7792):665-670.
- Prendergast ME, Sawchuk EA, Buikstra JE. Pastoral Neolithic of East Africa: deep genomic insights from the first herders. Current Biology. 2019;29(20):33653376.
- Schlebusch CM, Malmstrom H, Gunther T. Southern African ancient genomes estimate modern human divergence to 350,000 to 260,000 years ago. Science. 2017;358(6363):652-655.
- Wang K, Mathieson I, O'Connell J. Tracking human population structure through time from whole genome computations. American Journal of Human Genetics. 2020;107(2):232-246.
- Pickrell JK, Patterson N, Barbieri C. The genetic prehistory of southern Africa. Nature Communications. 2012;3:1143.
- Lazaridis I, Patterson N, Mittnik A. Genomic insights into the origin of farming in the ancient Near East. Nature. 2016;536(7617):419-424.
- Hublin JJ, Ben-Ncer A, Bailey SE. New fossils from Jebel Irhoud, Morocco and the pan-African origin of Homo sapiens. Nature. 2017;546(7657):289-292.
- Fan S, Kelly DE, Beltrame MH. African evolutionary history inferred from whole genome sequence data of 44 indigenous African populations. Genome Biology. 2019;20:82.