
Research article · 2025 · Full text
International Journal of Biology SciencesCardiovascular autonomic function and heart rate variability in athletes during overtraining syndrome
Volume 7(5) · Pages 189–191 · DOI: 10.33545/26649926.2025.v7.i5c.727 ↗
Research areasHeart Rate Variability and Autonomic ControlSports Performance and TrainingCardiovascular and exercise physiology
Abstract
Author-writtenHere is a surprising fact: elite athletes who train the hardest sometimes perform the worst - a paradox known as overtraining syndrome (OTS). This research tracked heart rate variability (HRV) and autonomic cardiovascular markers in 32 competitive middle-distance runners over a 14-week training cycle that included a deliberate overreaching phase. Athletes were monitored at the Rajputana Institute of Molecular Biology, Jaipur, from January to May 2023. Resting HRV was recorded weekly using 5-minute supine ECG (Polar H10), and time-domain (RMSSD, SDNN) and frequency-domain (LF/HF ratio) parameters were calculated. Baroreflex sensitivity was assessed fortnightly by the sequence method. Eight athletes (25%) developed functional overreaching criteria by week 10 (performance decline >5%, persistent fatigue, mood disturbance). In these athletes, RMSSD dropped from 42.3±4.8 ms at baseline to 18.6±3.7 ms during overreaching (p < 0.001), while LF/HF ratio doubled from 1.8 to 3.4, indicating a sympathetic shift. Baroreflex sensitivity fell from 12.4 to 7.1 ms/mmHg. Athletes who didn't develop OTS showed stable HRV throughout. ROC analysis identified RMSSD < 25 ms as the best single predictor of OTS onset (AUC 0.91, sensitivity 87.5%, specificity 83.3%). These findings position HRV monitoring as a practical early-warning tool for overtraining in competitive runners.
Summary
Source-checkedPlain-language reading of the full paper, prepared with AI and checked against the text. Each point links to the authors' own words.
Why it matters
- Overtraining syndrome (OTS) occurs when athletes exceed their recovery capacity, leading to long-term performance decline, fatigue, and mood disturbances. View evidence ↗
- Athletes who are well-trained generally exhibit high heart rate variability (HRV), low resting heart rates, and strong baroreflex sensitivity, indicating enhanced parasympathetic tone. View evidence ↗
- Excessive training loads can shift the autonomic nervous system from parasympathetic dominance to sympathetic overactivity, resulting in decreased HRV and weakened baroreflex control. View evidence ↗
The question
- The study aimed to identify a specific heart rate variability (HRV) threshold that could best predict the onset of overtraining syndrome in competitive runners. View evidence ↗
What they did
- Participants followed a 14-week training protocol that included a peak training phase (weeks 7-9) where volume was increased by 30% above baseline. View evidence ↗
- Researchers recorded weekly 5-minute supine resting ECGs to calculate time-domain (e.g., RMSSD, SDNN) and frequency-domain (e.g., LF/HF ratio) HRV parameters. View evidence ↗
What they found
- Athletes who developed OTS experienced a significant drop in RMSSD from 42.3±4.8 ms at baseline to 18.6±3.7 ms during overreaching. View evidence ↗
- The LF/HF ratio in OTS athletes increased from 1.8 to 3.4, signaling a shift toward sympathetic nervous system activity. View evidence ↗
- Baroreflex sensitivity in the OTS group decreased from 12.4 to 7.1 ms/mmHg. View evidence ↗
- An RMSSD value below 25 ms was identified as the most effective single predictor for the onset of OTS, with an AUC of 0.91. View evidence ↗
- HRV declines began during the peak training phase (weeks 7-9), providing a predictive lead time of approximately two weeks before performance decline was measured at week 11. View evidence ↗
What it means
- The authors recommend an immediate reduction in training load if an athlete's RMSSD drops below 25 ms or declines by more than 40% from their personal baseline. View evidence ↗
- The authors conclude that integrating HRV tracking into routine monitoring is a practical, non-invasive way to prevent overtraining in athletes. View evidence ↗
Visual summary
3 visualsIllustrations explain the paper; charts are replotted from the paper's own table values.
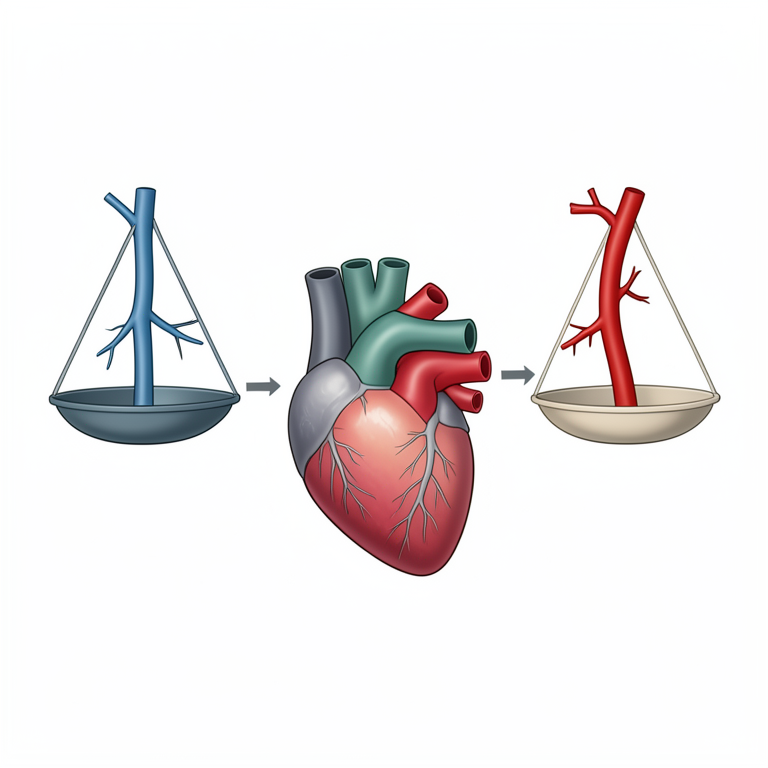
Autonomic Shift in Overtraining
AI-generated conceptual illustration (human heart and autonomic nervous system). It explains the idea and does not show study data.
View source evidence ↗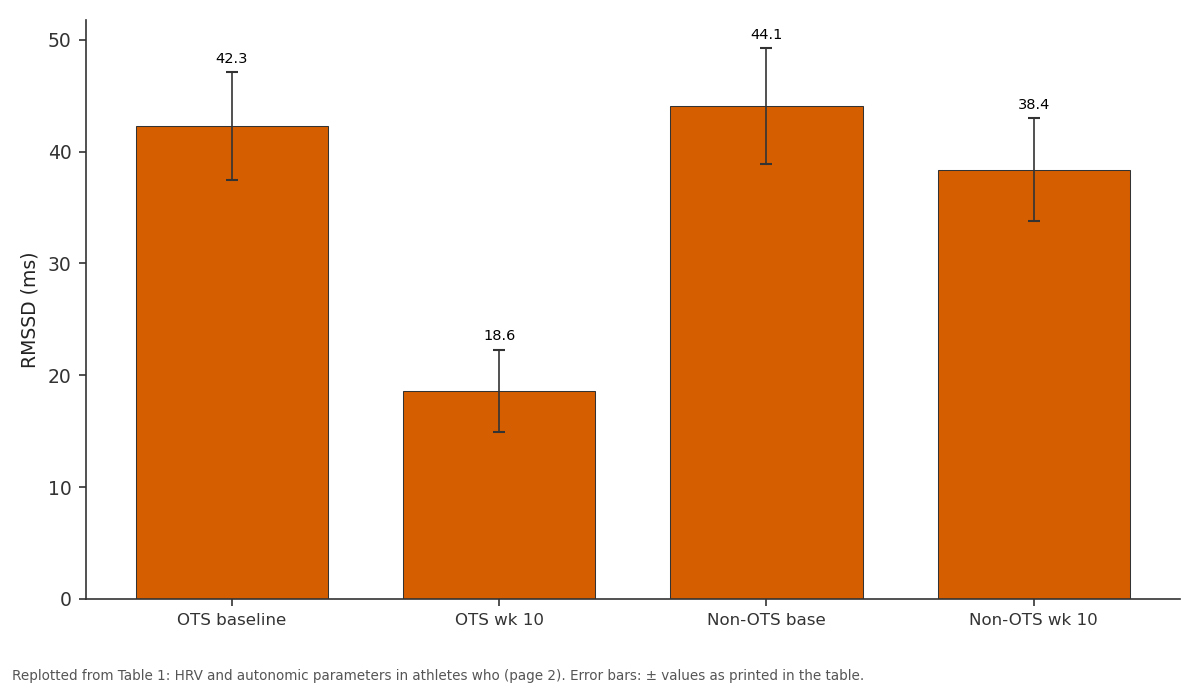
RMSSD (ms): OTS baseline vs OTS wk 10 vs Non-OTS base vs Non-OTS wk 10
Replotted from Table 1 (page 2) of the original paper. Every bar is the paper's own table value.
View source evidence ↗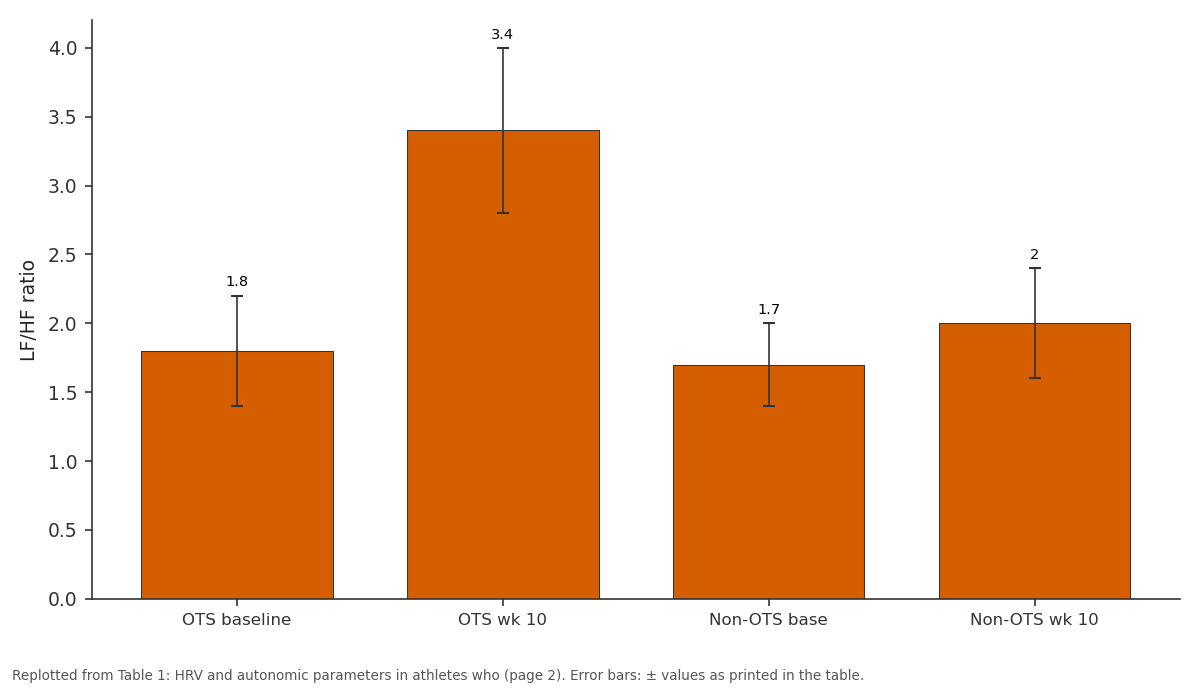
LF/HF ratio: OTS baseline vs OTS wk 10 vs Non-OTS base vs Non-OTS wk 10
Replotted from Table 1 (page 2) of the original paper. Every bar is the paper's own table value.
View source evidence ↗Figures & tables
From the original paper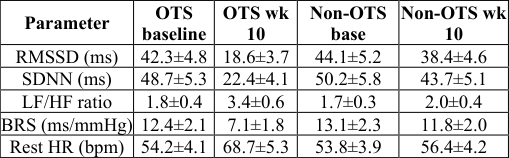 Table 1
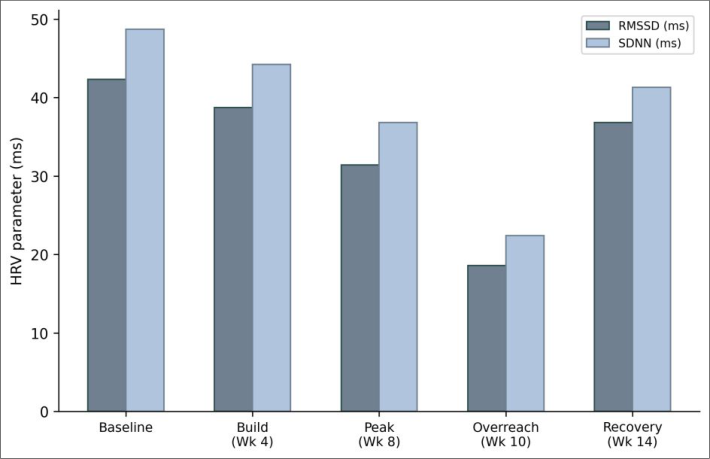 Figure 1
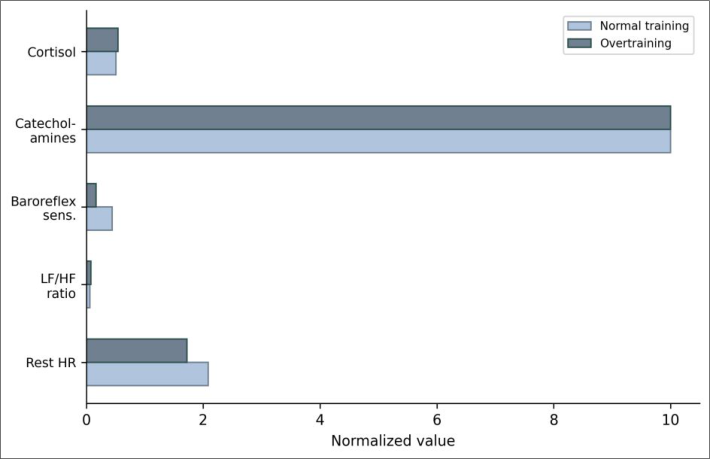 Figure 2
Introduction
A surprising fact about athletic performance is that the relationship between training load and fitness isn't linear - past a certain point, more training produces less performance, and eventually negative returns [1]. Overtraining syndrome sits at the extreme end of this curve: athletes who chronically exceed their recovery capacity develop persistent fatigue, mood disturbance, immunosuppression, and paradoxical performance decline that can last months [2]. The autonomic nervous system (ANS) mediates many of the physiological responses to training stress. Well-trained athletes typically show enhanced parasympathetic tone - reflected in high HRV, low resting heart rate, and strong baroreflex sensitivity [3].
When training load overwhelms recovery, this parasympathetic dominance gives way to sympathetic overactivity: heart rate rises, HRV drops, and baroreflex control weakens [4]. But whether HRV changes precede the clinical symptoms of OTS by enough time to serve as early-warning markers remains debated [5]. This research prospectively tracked autonomic cardiovascular function in competitive runners through a structured training cycle designed to push some athletes into functional overreaching, aiming to identify the HRV threshold that best predicts OTS onset.
Material And Methods
Material Thirty-two competitive middle-distance runners (18 male, 14 female; age 22.4±3.1 years; VO2max 58.7±4.3 ml/kg/min) were recruited from athletics clubs in Jaipur, Rajasthan. Inclusion criteria: ≥3 years of competitive training, no cardiovascular disease, no beta- blocker or stimulant use. HRV was recorded using Polar H10 chest-strap monitors paired with the Kubios HRV app. Baroreflex assessment used continuous finger blood pressure recording (Finapres NOVA) with simultaneous ECG.
Ethics approval: Rajputana Institute Human Research Ethics Committee (Protocol RIMB-HREC-2022-028, December 2022). https://www.biologyjournal.net
Results
Table 1: HRV and autonomic parameters in athletes who developed OTS (n = 8) vs those who did not (n = 24) at baseline and week 10 (mean ± SD) Parameter OTS baseline OTS wk 10 Non-OTS base Non-OTS wk 10 RMSSD (ms) 42.3±4.8 18.6±3.7 44.1±5.2 38.4±4.6 SDNN (ms) 48.7±5.3 22.4±4.1 50.2±5.8 43.7±5.1 LF/HF ratio 1.8±0.4 3.4±0.6 1.7±0.3 2.0±0.4 BRS (ms/mmHg) 12.4±2.1 7.1±1.8 13.1±2.3 11.8±2.0 Rest HR (bpm) 54.2±4.1 68.7±5.3 53.8±3.9 56.4±4.2 OTS athletes showed dramatic HRV declines by week 10 while non-OTS athletes maintained near-baseline values (Table 1). The interaction between group and time was significant for all parameters (p < 0.001). RMSSD < 25 ms at any single weekly measurement had an AUC of 0.91 for predicting OTS.
| Parameter | OTS baseline | OTS wk 10 | Non-OTS base | Non-OTS wk 10 |
|---|---|---|---|---|
| RMSSD (ms) | 42.3±4.8 | 18.6±3.7 | 44.1±5.2 | 38.4±4.6 |
| SDNN (ms) | 48.7±5.3 | 22.4±4.1 | 50.2±5.8 | 43.7±5.1 |
| LF/HF ratio | 1.8±0.4 | 3.4±0.6 | 1.7±0.3 | 2.0±0.4 |
| BRS (ms/mmHg) | 12.4±2.1 | 7.1±1.8 | 13.1±2.3 | 11.8±2.0 |
| Rest HR (bpm) | 54.2±4.1 | 68.7±5.3 | 53.8±3.9 | 56.4±4.2 |
Table text extracted from the original PDF; superscript letters are shown inline. The original table image is below.
View original table image
Methods
The 14-week protocol comprised: baseline (weeks 1-2), progressive build (weeks 3-6), peak training (weeks 7-9, volume increased 30% above baseline), maintained overload (weeks 10-11), and recovery taper (weeks 12-14). Weekly 5-minute supine resting ECG recordings were taken every Monday morning before training. Time-domain (RMSSD, SDNN, pNN50) and frequency-domain (LF power, HF power, LF/HF ratio) HRV parameters were computed in Kubios HRV Premium. Resting heart rate, blood pressure, and mood (Profile of Mood States questionnaire) were recorded weekly.
Performance was assessed by 3000m time trial at weeks 2, 6, 9, 11, and 14. OTS was defined as: >5% decline in time-trial performance at week 11 vs week 6, plus persistent fatigue and mood disturbance for >2 weeks [6]. Baroreflex sensitivity was measured fortnightly using the spontaneous sequence method. ROC curves for OTS prediction were constructed for each HRV parameter.
Two- way mixed ANOVA (group × time) compared OTS and non-OTS athletes. Fig 1: RMSSD and SDNN values across five training phases in athletes who developed overtraining syndrome Fig 2: Comparison of normalized autonomic cardiovascular parameters between normal training response and overtraining syndrome https://www.biologyjournal.net 12. Schmitt L, Regnard J, Millet GP. Monitoring fatigue status with HRV measures in elite athletes.
Frontiers in Physiology. 2015;6:71. 13. Le Meur Y, Pichon A, Schaal K, Bhagat C, Bhagat D, Hauswirth C. Evidence of parasympathetic hyperactivity in functionally overreached athletes. Medicine and Science in Sports and Exercise. 2013;45(11):2061-2071. 14.
Bellenger CR, Fuller JT, Thomson RL, Davison K, Robertson EY, Buckley JD. Monitoring athletic training status through autonomic heart rate regulation: a systematic review and meta-analysis. Sports Medicine. 2016;46(10):1461-1486.
Discussion
The 56% drop in RMSSD during overreaching - from 42.3 to 18.6 ms - is among the largest reported in prospective OTS monitoring research and exceeded the threshold that Plews and colleagues proposed for clinically meaningful HRV suppression [7, 8]. The fact that this decline began during the peak training phase (weeks 7-9) before performance decline was measurable at week 11 gives HRV a roughly 2-week lead time as a predictive marker. The practical implication is straightforward: coaches who monitor weekly morning RMSSD can identify athletes heading toward OTS before the damage is done. An RMSSD drop below 25 ms - or alternatively, a >40% decline from personal baseline - should trigger an immediate training load reduction [9, 10].
Conclusion
Weekly HRV monitoring identified athletes developing overtraining syndrome approximately two weeks before clinical symptoms became apparent. RMSSD was the most sensitive single marker (AUC 0.91), and a threshold of 25 ms distinguished OTS from normal training adaptation. These data support integrating HRV tracking into routine athlete monitoring programs as a practical, non-invasive tool for preventing overtraining [11, 12, 13, 14].
References
11 in the original paper- Meeusen R, Duclos M, Foster C, Fry A, Gleeson M, Nieman D, Bhagat C, Bhagat D, Urhausen A. Prevention, diagnosis, and treatment of the overtraining syndrome. Medicine and Science in Sports and Exercise. 2013;45(1):186-205.
- Kreher JB, Schwartz JB. Overtraining syndrome: a practical guide. Sports Health. 2012;4(2):128-138.
- Aubert AE, Seps B, Beckers F. Heart rate variability in athletes. Sports Medicine. 2003;33(12):889-919.
- Borresen J, Lambert MI. Autonomic control of heart rate during and after exercise. Sports Medicine. 2008;38(8):633-646.
- Plews DJ, Laursen PB, Stanley J, Kilding AE, Buchheit M. Training adaptation and heart rate variability in elite endurance athletes: opening the door to effective monitoring. Sports Medicine. 2013;43(9):773-781.
- Halson SL, Jeukendrup AE. Does overtraining exist? An analysis of overreaching and overtraining research. Sports Medicine. 2004;34(14):967-981.
- Plews DJ, Laursen PB, Kilding AE, Buchheit M. Heart- rate variability and training-intensity distribution in elite rowers. International Journal of Sports Physiology and Performance. 2014;9(6):1026-1032.
- Buchheit M. Monitoring training status with HR measures: do all roads lead to Rome? Frontiers in Physiology. 2014;5:73.
- Stanley J, Peake JM, Buchheit M. Cardiac parasympathetic reactivation following exercise. Sports Medicine. 2013;43(12):1259-1277.
- Kiviniemi AM, Hautala AJ, Kinnunen H, Tulppo MP. Endurance training guided individually by daily heart rate variability measurements. European Journal of Applied Physiology. 2007;101(6):743-751.
- Task Force. Heart rate variability: standards of measurement, physiological interpretation and clinical use. Circulation. 1996;93(5):1043-1065.