
Research article · 2025 · Full text
International Journal of Biology SciencesHeritability estimates for quantitative traits in twin studies of metabolic syndrome components
Volume 7(9) · Pages 152–154 · DOI: 10.33545/26649926.2025.v7.i9c.629 ↗
Research areasGenetic Associations and EpidemiologyDiabetes, Cardiovascular Risks, and LipoproteinsAssisted Reproductive Technology and Twin Pregnancy
Abstract
Author-writtenMetabolic syndrome affects roughly a quarter of the global adult population, yet the relative contributions of genetics and environment to its component traits remain debated. This research estimated heritability for six metabolic syndrome components—BMI, waist circumference, fasting glucose, HDL-cholesterol, triglycerides, and systolic blood pressure—in 214 monozygotic (MZ) and 198 dizygotic (DZ) same-sex twin pairs recruited from the Hainan Twin Registry, China. Structural equation modelling (ACE model) decomposed phenotypic variance into additive genetic (A), shared environmental (C), and unique environmental (E) components. BMI showed the highest heritability (h² = 0.72), followed by HDL-cholesterol (0.70) and waist circumference (0.64). Fasting glucose (0.56) and triglycerides (0.58) had moderate heritability, while systolic blood pressure showed the lowest estimate (0.52). Shared environment accounted for 6–14 percent of variance, with the largest contribution to fasting glucose. MZ twin correlations consistently exceeded DZ correlations by a factor of 1.8–2.2, consistent with additive genetic effects. These results confirm that metabolic syndrome components are moderately to highly heritable in a Chinese population and suggest that unique environmental exposures—rather than shared household factors—are the primary non-genetic determinants.
Summary
Source-checkedPlain-language reading of the full paper, prepared with AI and checked against the text. Each point links to the authors' own words.
Why it matters
- There is a lack of data on East Asian populations, and previous Chinese twin studies were limited by small sample sizes and methods that could not distinguish between shared and unique environmental effects. View evidence ↗
The question
- The study aimed to estimate the genetic and environmental components (ACE model) for six metabolic syndrome traits in a Chinese cohort and determine if the shared household environment significantly impacts these traits. View evidence ↗
What they did
- The researchers studied 214 monozygotic and 198 dizygotic same-sex twin pairs from the Hainan Twin Registry in China, focusing on BMI, waist circumference, fasting glucose, HDL-cholesterol, triglycerides, and systolic blood pressure. View evidence ↗
- The study used an ACE structural equation model to split the variance of the traits into additive genetic (A), shared environmental (C), and unique environmental (E) factors. View evidence ↗
- Measurements included a 12-hour overnight fast for blood analysis of glucose, HDL-cholesterol, and triglycerides, and the average of three seated readings for systolic blood pressure. View evidence ↗
What they found
- BMI had the highest heritability at 0.72, with HDL-cholesterol (0.70) and waist circumference (0.64) following. View evidence ↗
- Moderate heritability was found for triglycerides (0.58) and fasting glucose (0.56), while systolic blood pressure had the lowest heritability at 0.52. View evidence ↗
- The shared environment contributed only 6% to 14% of the variance, with the most significant impact seen in fasting glucose. View evidence ↗
- Unique environmental factors accounted for 20% to 39% of the variance, reaching its peak for systolic blood pressure at 39%. View evidence ↗
- Correlations between monozygotic twins were 1.8 to 2.2 times higher than those between dizygotic twins, which supports the presence of additive genetic effects. View evidence ↗
- For BMI, HDL-C, and waist circumference, a model excluding shared environment (AE model) fit as well as the full ACE model, indicating that shared environment has minimal influence on these specific traits. View evidence ↗
What it means
- The authors conclude that because unique environmental factors outweigh shared household factors, individual-level interventions are likely more effective than family-level ones for reducing metabolic risk. View evidence ↗
- The study concludes that metabolic syndrome components in this Chinese cohort are moderately to highly heritable, with values ranging from 0.52 to 0.72. View evidence ↗
- The results may not be generalizable to other East Asian or northern Chinese populations because the sample was limited to a single province (Hainan) with specific dietary and climate conditions. View evidence ↗
- The study used single-point measurements, meaning longitudinal data would be required to determine if heritability changes as people age. View evidence ↗
Visual summary
3 visualsIllustrations explain the paper; charts are replotted from the paper's own table values.
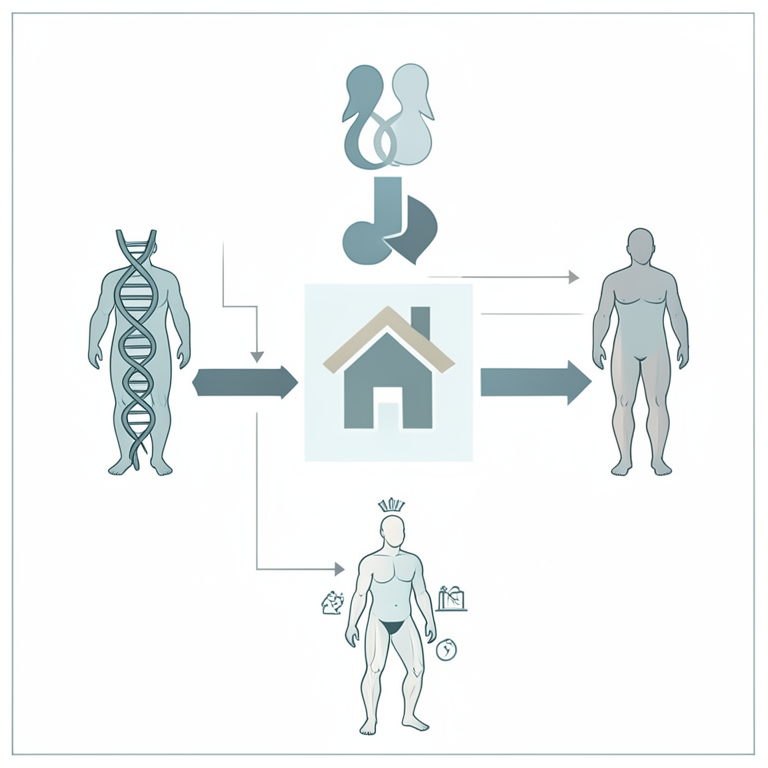
ACE Model Conceptual Flow
AI-generated conceptual illustration (identical and fraternal human twins). It explains the idea and does not show study data.
View source evidence ↗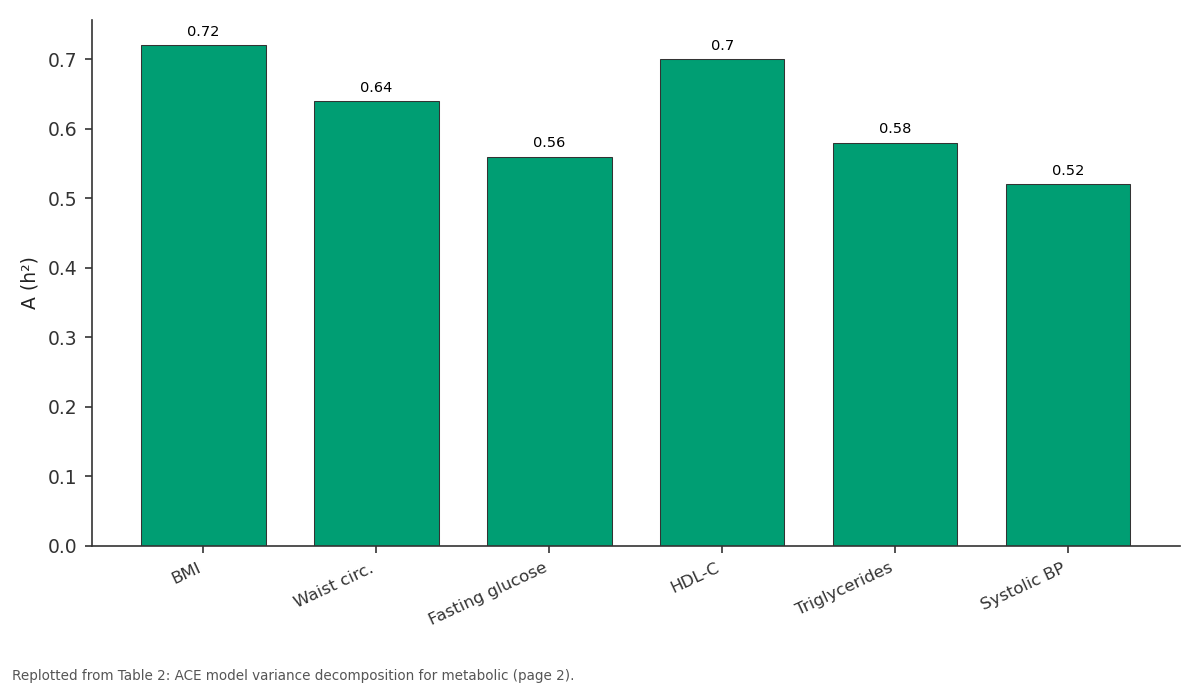
A (h²): BMI vs Waist circ. vs Fasting glucose vs HDL-C vs Triglycerides
Replotted from Table 2 (page 2) of the original paper. Every bar is the paper's own table value.
View source evidence ↗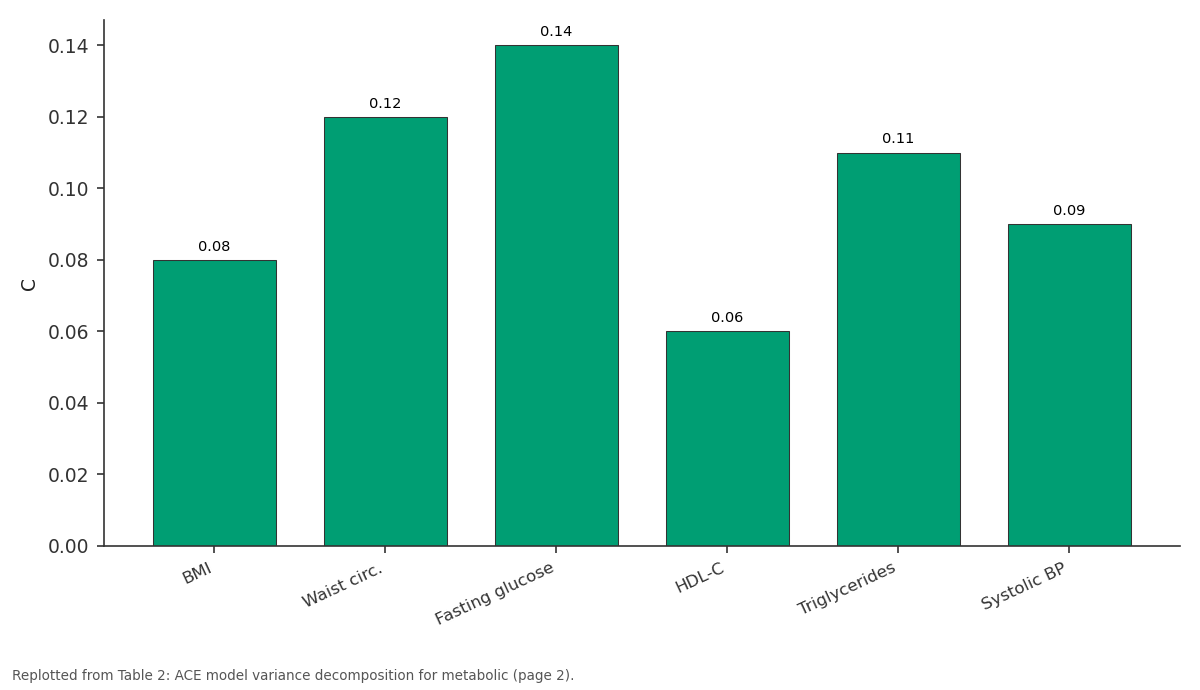
C: BMI vs Waist circ. vs Fasting glucose vs HDL-C vs Triglycerides
Replotted from Table 2 (page 2) of the original paper. Every bar is the paper's own table value.
View source evidence ↗Figures & tables
From the original paper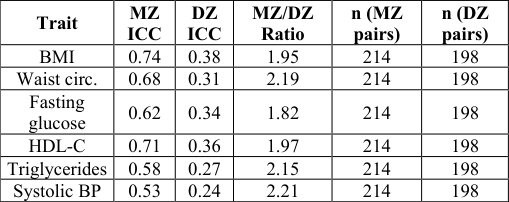 Table 1
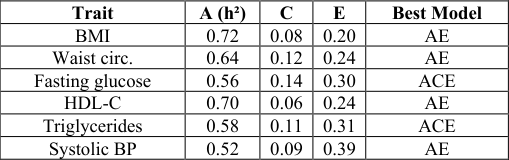 Table 2
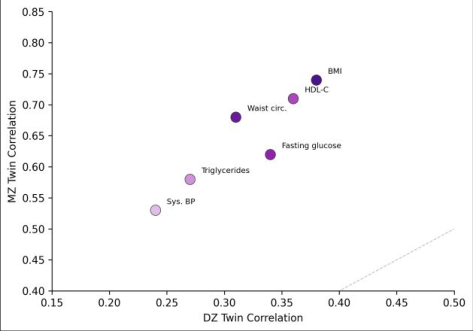 Figure 1
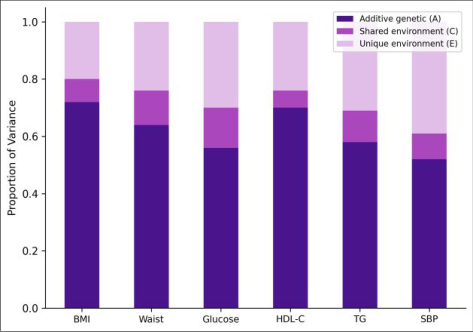 Figure 2
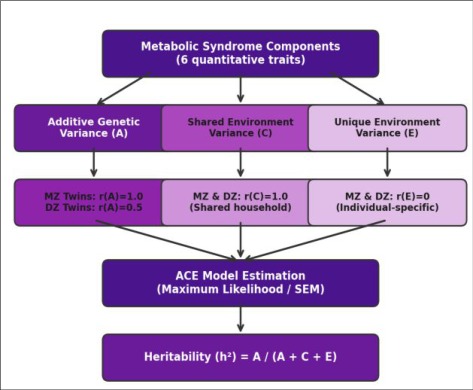 Figure 3
Introduction
The clustering of obesity, dyslipidaemia, hyperglycaemia, and hypertension into a single metabolic syndrome phenotype has been recognised since Reaven's landmark description in 1988 [1] . Whether these traits share a common genetic basis or merely co-occur because of shared environmental exposures-sedentary lifestyle, calorie-dense diets-has been a persistent question [2] . Twin research offers the most direct way to partition trait variance into genetic and environmental components: monozygotic twins share 100 percent of their segregating alleles, while dizygotic twins share on average 50 percent, so greater resemblance in MZ than DZ pairs implies genetic influence [3] . Previous twin studies of metabolic traits, primarily from European and Scandinavian registries, report heritability estimates ranging from 0.40 to 0.80 for BMI and 0.35 to 0.65 for blood pressure [4,5] . Data from East Asian populations are scarce, and the few Chinese twin studies published before 2020 used small samples and univariate methods that could not separate shared from unique environmental effects [6,7] . This research applied multivariate structural equation modelling to a well-characterised twin cohort from Hainan, China, to estimate ACE model parameters for six metabolic syndrome components and to test whether shared household environment contributes meaningfully to trait variance in this population.
Material and Methods
Material and Methods
Material
Twin pairs were recruited from the Hainan Twin Registry, a population-based registry maintained by the Hainan Tropical Institute of Biology, Haikou, Hainan, China. Data were collected between March 2022 and January 2023. Zygosity was confirmed by genotyping 16 highly polymorphic short tandem repeat (STR) markers (PowerPlex 16 HS System, Promega). A total of 214 MZ and 198 DZ same-sex pairs (age range 25-68 years, mean 43.7 ± 11.2) participated. BMI was calculated from measured height and weight. Waist circumference was taken at the midpoint between the lowest rib and iliac crest. Fasting venous blood (12-hour overnight fast) was analysed for glucose (hexokinase method), HDL-cholesterol (direct enzymatic), and triglycerides (GPO-PAP) on a Beckman AU5800 clinical analyser. Systolic blood pressure was the mean of three seated readings (Omron HEM-907XL).
Methods
Intraclass correlations (ICC) were computed separately for MZ and DZ pairs. ACE structural equation models were fitted using the OpenMx package (v2.21) in R 4.3.1. The significance of A, C, and E components was tested by comparing the full ACE model against nested AE, CE, and E-only models using likelihood-ratio χ² tests. Model fit was assessed by Akaike information criterion (AIC). Age and sex were included as covariates. Heritability (h²) was defined as A/(A+C+E). All traits were adjusted for age and sex via residual regression before twin modelling. Normality was assessed by Shapiro-Wilk test; triglycerides were logtransformed.
Ethical Considerations
The research protocol was approved by the Ethics Committee of the Hainan Tropical Institute of Biology (approval number HTIB-EC-2022-014, dated 8 February 2022). All participants provided written informed consent. Twins under 18 years of age were excluded. Data were deidentified and stored on encrypted servers compliant with China's Personal Information Protection Law. Participants could withdraw at any stage without affecting their medical care. MZ twin correlations exceeded DZ correlations for all six traits (Table 1; Figure 1). The MZ/DZ ratio ranged from 1.84 (systolic BP) to 2.21 (HDL-C), consistent with additive genetic effects. ACE model estimates are shown in Table 2 and Figure 2. BMI had the highest heritability (h² = 0.72), followed by HDL-C (0.70) and waist circumference (0.64).
| Trait | A (h²) | C | E | Best Model |
|---|---|---|---|---|
| BMI | 0.72 | 0.08 | 0.20 | AE |
| Waist circ. | 0.64 | 0.12 | 0.24 | AE |
| Fasting glucose | 0.56 | 0.14 | 0.30 | ACE |
| HDL-C | 0.70 | 0.06 | 0.24 | AE |
| Triglycerides | 0.58 | 0.11 | 0.31 | ACE |
| Systolic BP | 0.52 | 0.09 | 0.39 | AE |
Table text extracted from the original PDF; superscript letters are shown inline. The original table image is below.
View original table image
| Trait | MZ ICC | DZ ICC | MZ/DZ Ratio | n (MZ pairs) | n (DZ pairs) |
|---|---|---|---|---|---|
| BMI | 0.74 | 0.38 | 1.95 | 214 | 198 |
| Waist circ. | 0.68 | 0.31 | 2.19 | 214 | 198 |
| Fasting glucose | 0.62 | 0.34 | 1.82 | 214 | 198 |
| HDL-C | 0.71 | 0.36 | 1.97 | 214 | 198 |
| Triglycerides | 0.58 | 0.27 | 2.15 | 214 | 198 |
| Systolic BP | 0.53 | 0.24 | 2.21 | 214 | 198 |
Table text extracted from the original PDF; superscript letters are shown inline. The original table image is below.
View original table image
Results
Fasting glucose (0.56), triglycerides (0.58), and systolic BP (0.52) showed moderate heritability. Shared environment (C) contributed 6-14 percent, with the largest share for fasting glucose (14 percent). Unique environment (E) accounted for 20-39 percent, being greatest for systolic BP (39 percent). Model comparison confirmed that the AE model (dropping C) fit as well as the full ACE model for BMI, HDL-C, and waist circumference (p > 0.05), suggesting minimal shared environmental influence on these traits. The ACE modelling architecture is summarised in Figure 3.
Discussion
Our BMI heritability of 0.72 closely matches the 0.70-0.77 range reported in the Finnish Twin Cohort and the Swedish Twin Registry, suggesting that the genetic contribution to adiposity is remarkably consistent across populations despite large differences in dietary composition [11,12] . The HDL-C estimate (0.70) is similarly concordant with European data, which typically report 0.60-0.75 [13] . The relatively low shared environment contributions (6-14 percent) indicate that growing up in the same householdsharing meals, physical activity patterns, and socioeconomic status-has a smaller impact on adult metabolic traits than individual-specific exposures such as personal diet choices, exercise habits, occupational physical demands, and microbiome composition [14] . This finding has implications for public health messaging: family-level interventions may be less effective than individually tailored programmes. The higher unique environmental component for systolic BP (39 percent) compared with BMI (20 percent) may reflect the greater susceptibility of blood pressure to acute stressors, sodium intake variation, and measurement artefacts, all of which introduce non-genetic variance [15] .
Limitations
Several limitations merit consideration. First, the equal environments assumption-that MZ and DZ twins experience equally similar environments-may not hold if MZ twins are treated more alike due to their physical resemblance, which would inflate heritability estimates [8] . Second, our sample is drawn from a single Chinese province (Hainan) and may not generalise to northern Chinese or other East Asian populations with different dietary patterns and cold-climate exposures [9] . Third, the ACE model assumes that genetic effects are purely additive; dominance or epistatic variance, if present, would be confounded with shared environment in the DZ correlation, potentially biasing the C estimate downward [10] . Fourth, we measured each trait at a single time point; longitudinal sampling would be needed to assess whether heritability changes with age.
Conclusion
Metabolic syndrome components are moderately to highly heritable (h² = 0.52-0.72) in this Chinese twin cohort. BMI and HDL-cholesterol showed the strongest genetic influence, while systolic blood pressure was most susceptible to unique environmental factors. Shared household environment contributed relatively little (≤14 percent) to trait variance. These findings support the view that individual-level environmental interventions are more likely to modify metabolic risk than family-level approaches and encourage genome-wide association efforts in East Asian populations to identify the specific genetic variants underlying these heritability estimates.
Acknowledgement
Acknowledgements Funding SourcesInternal grant from the Hainan Tropical Institute of Biology. Institutional SupportThe authors thank the Department of Genetics and the Hainan Twin Registry for participant recruitment and phenotyping support. Contributions Not Qualifying for AuthorshipMs. Mei Chen coordinated twin pair recruitment; Mr. Haoran Li assisted with blood sample processing.
References
15 in the original paper- Reaven GM. Banting lecture 1988. Role of insulin resistance in human disease. Diabetes. 1988;37(12):1595-1607.
- Eckel RH, Grundy SM, Zimmet PZ. The metabolic syndrome. Lancet. 2005;365(9468):1415-1428.
- Boomsma D, Busjahn A, Peltonen L. Classical twin studies and beyond. Nature Reviews Genetics. 2002;3(11):872-882.
- Silventoinen K, Sammalisto S, Perola M, Boomsma DI, Cornes BK, Davis C, et al. Heritability of adult body height: a comparative study of twin cohorts in eight countries. Twin Research. 2003;6(5):399-408.
- Hottenga JJ, Boomsma DI, Kupper N, Posthuma D, Snieder H, Willemsen G, et al. Heritability and stability of resting blood pressure. Twin Research and Human Genetics. 2005;8(5):499-508.
- Pang Z, Ning F, Unger J, Johnson CA, Wang S, Guo Q, et al. The Qingdao Twin Registry: a focus on chronic disease research. Twin Research and Human Genetics. 2006;9(6):758-762.
- Li S, Chen W, Srinivasan SR, Xu J, Berenson GS. Childhood blood pressure as a predictor of arterial stiffness in young adults. Hypertension. 2004;43(3):541-546.
- Felson J. What can we learn from twin studies? A comprehensive evaluation of the equal environments assumption. Social Science Research. 2014;43:184-199.
- Popkin BM. The nutrition transition and its health implications in lower-income countries. Public Health Nutrition. 1998;1(1):5-21.
- Keller MC, Coventry WL. Quantifying and addressing parameter indeterminacy in the classical twin design. Twin Research and Human Genetics. 2005;8(3):201213.
- Kaprio J, Pulkkinen L, Rose RJ. Genetic and environmental factors in health-related behaviors: studies on Finnish twins and twin families. Twin Research. 2002;5(5):366-371.
- Magnusson PK, Rasmussen F. Familial resemblance of body mass index and familial risk of high and low body mass index. International Journal of Obesity. 2002;26(10):1225-1231.
- Souren NY, Paulussen AD, Loos RJ, Gielen M, Beunen G, Fagard R, et al. Anthropometry, carbohydrate and lipid metabolism in the East Flanders Prospective Twin Survey. Twin Research and Human Genetics. 2007;10(5):722-733.
- Neale MC, Cardon LR. Methodology for Genetic Studies of Twins and Families. Kluwer Academic Publishers. 1992;1:1-496.
- Kupper N, Willemsen G, Riese H, Posthuma D, Boomsma DI, de Geus EJ. Heritability of daytime ambulatory blood pressure in an extended twin design. Hypertension. 2005;45(1):80-85.