
Research article · 2025 · Full text
International Journal of Biology SciencesPhloem loading mechanisms and sugar transport in cucurbit companion cell-sieve element complexes
Volume 7(9) · Pages 169–171 · DOI: 10.33545/26649926.2025.v7.i9c.634 ↗
Research areasPlant nutrient uptake and metabolismAdvances in Cucurbitaceae ResearchPlant Water Relations and Carbon Dynamics
Abstract
Author-writtenHow do cucurbits move photosynthate from source leaves to developing fruit when their sieve tubes carry some of the highest sugar concentrations recorded in any plant family? Cucurbitaceae employ a symplastic polymer-trap mechanism in which sucrose entering companion cells is converted to raffinose-family oligosaccharides (RFOs) too large to diffuse back into mesophyll, creating a thermodynamic sink that drives sugar loading without direct ATP expenditure at the membrane. This research compared phloem loading parameters in three cucurbit species—cucumber (Cucumis sativus), pumpkin (Cucurbita maxima), and melon (Cucumis melo)—grown at Valdivia, Chile. Sieve tube exudate was collected by stylectomy, and sugar profiles were analysed by HPAEC-PAD. Pumpkin sieve tubes contained the highest RFO concentrations (stachyose 31.7 mM, raffinose 41.3 mM), while cucumber showed the greatest sucrose loading rate (187.6 mM in sieve tubes vs 142.3 mM in source leaves). Companion cell density per unit vein length was significantly higher in pumpkin (8.3 cells/mm) than in cucumber (5.7 cells/mm). These data clarify how species-specific variation in companion cell anatomy and RFO synthesis governs phloem loading capacity across the Cucurbitaceae.
Summary
Source-checkedPlain-language reading of the full paper, prepared with AI and checked against the text. Each point links to the authors' own words.
Why it matters
- Cucurbits possess an exceptional capacity for phloem transport, which is necessary to support the rapid growth of large fruits, such as pumpkins that can gain over 5 kg of dry matter daily. View evidence ↗
- The Cucurbitaceae family uses a 'polymer-trap' mechanism where sucrose is converted into larger raffinose-family oligosaccharides (RFOs) in companion cells, preventing them from diffusing back and driving sugar loading without using ATP at the membrane. View evidence ↗
- There is currently limited comparative data regarding the anatomy of companion cells, RFO profiles, and loading kinetics across different species of cucurbits. View evidence ↗
The question
- The study aimed to relate phloem loading efficiency to biochemical parameters (sugar concentrations in leaves and sieve tubes) and anatomical parameters (companion cell density) in cucumber, pumpkin, and melon. View evidence ↗
What they did
- The experiment utilized three specific species: Cucumis sativus ‘Marketmore 76’, Cucurbita maxima ’Atlantic Giant’, and Cucumis melo ’Honey Dew’. View evidence ↗
- The sample size consisted of eight plants per species, with measurements taken once plants reached 6–8 weeks post-transplanting and had at least 8 fully expanded source leaves. View evidence ↗
- Researchers used green peach aphids (Myzus persicae) as biological probes to collect sieve tube exudate via the stylectomy technique. View evidence ↗
- Sugar profiles for sucrose, raffinose, stachyose, glucose, and fructose were analyzed using HPAEC-PAD with a Dionex ICS-5000 and a CarboPac PA1 column. View evidence ↗
- Companion cell density was measured in class IV–V minor veins using toluidine blue staining and 400× magnification imaging. View evidence ↗
What they found
- Cucumber exhibited a 1.32-fold sucrose concentration ratio, with levels increasing from 142.3 mM in source leaves to 187.6 mM in sieve tube exudate. View evidence ↗
- Pumpkin had the highest concentrations of RFOs in its sieve tubes, with raffinose at 41.3 mM and stachyose at 31.7 mM, which combined were greater than the sucrose concentration. View evidence ↗
- Pumpkin had a significantly higher companion cell density (8.3 ± 0.9 cells/mm) compared to cucumber (5.7 ± 0.7 cells/mm) and melon (6.4 ± 0.8 cells/mm). View evidence ↗
- For most measured parameters, melon showed values that were intermediate between those of cucumber and pumpkin. View evidence ↗
What it means
- The authors conclude that pumpkin relies primarily on the polymer-trap mechanism, while cucumber likely uses a hybrid apoplastic-symplastic strategy due to its stronger sucrose-loading component. View evidence ↗
- The observed differences in loading mechanisms align with the varying demands of the fruits and could be used to inform breeding strategies to improve fruit yield and assimilate partitioning. View evidence ↗
- A limitation of the study is that the use of stylectomy may not perfectly represent actual in situ sieve tube concentrations because of wound responses and dilution. View evidence ↗
Visual summary
3 visualsIllustrations explain the paper; charts are replotted from the paper's own table values.
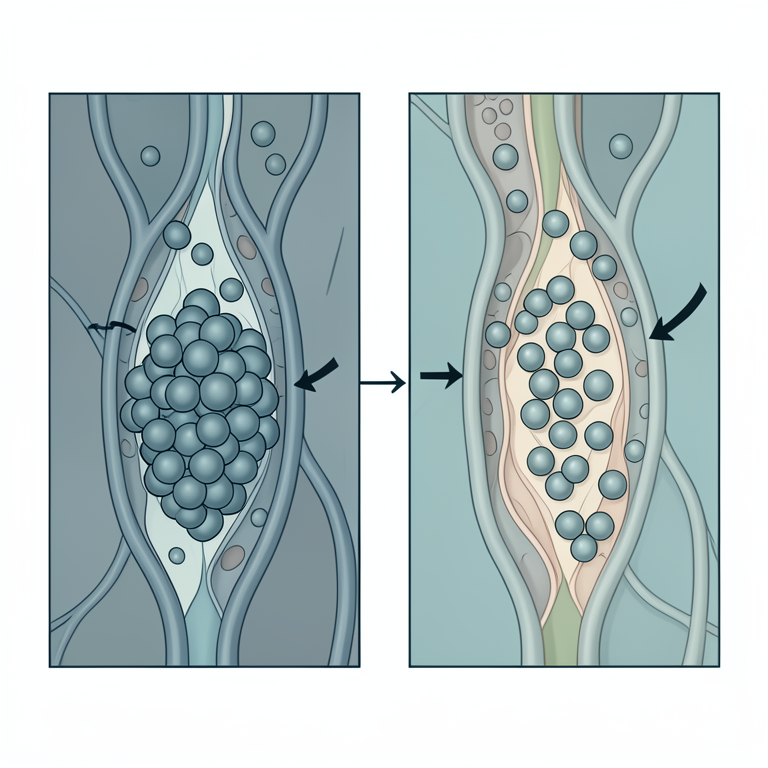
Comparison of Phloem Loading Strategies
AI-generated conceptual illustration (Cucurbit companion cell-sieve element complexes). It explains the idea and does not show study data.
View source evidence ↗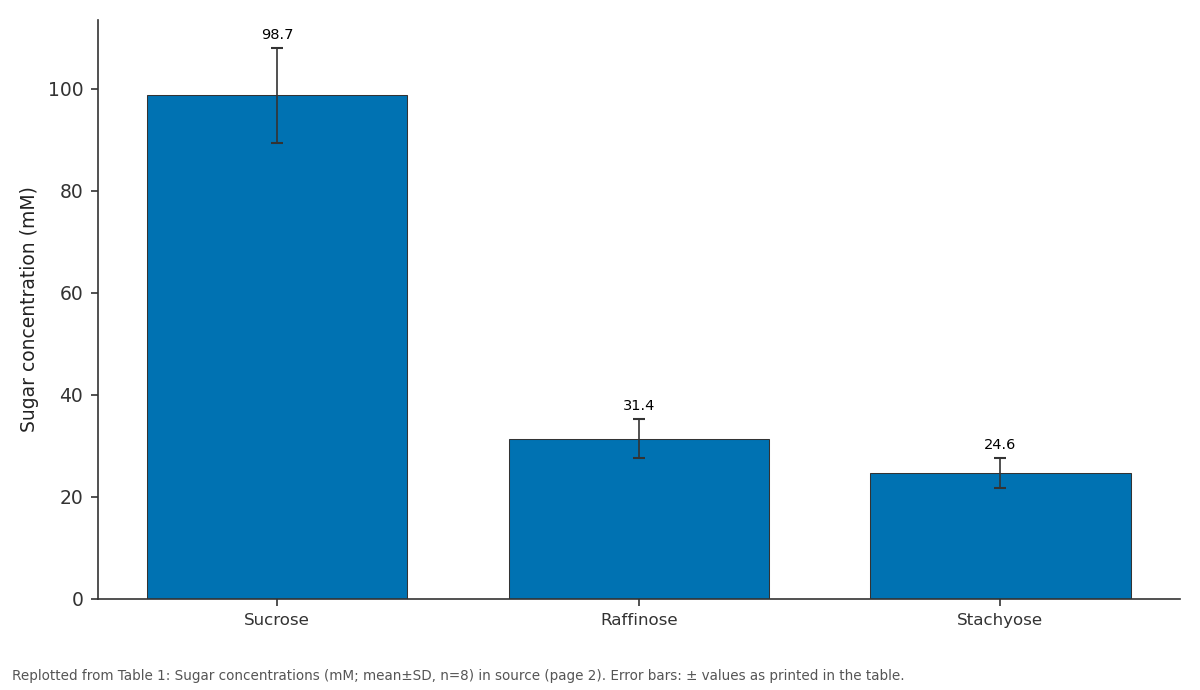
Pumpkin SL: Sucrose vs Raffinose vs Stachyose
Replotted from Table 1 (page 2) of the original paper. Every bar is the paper's own table value.
View source evidence ↗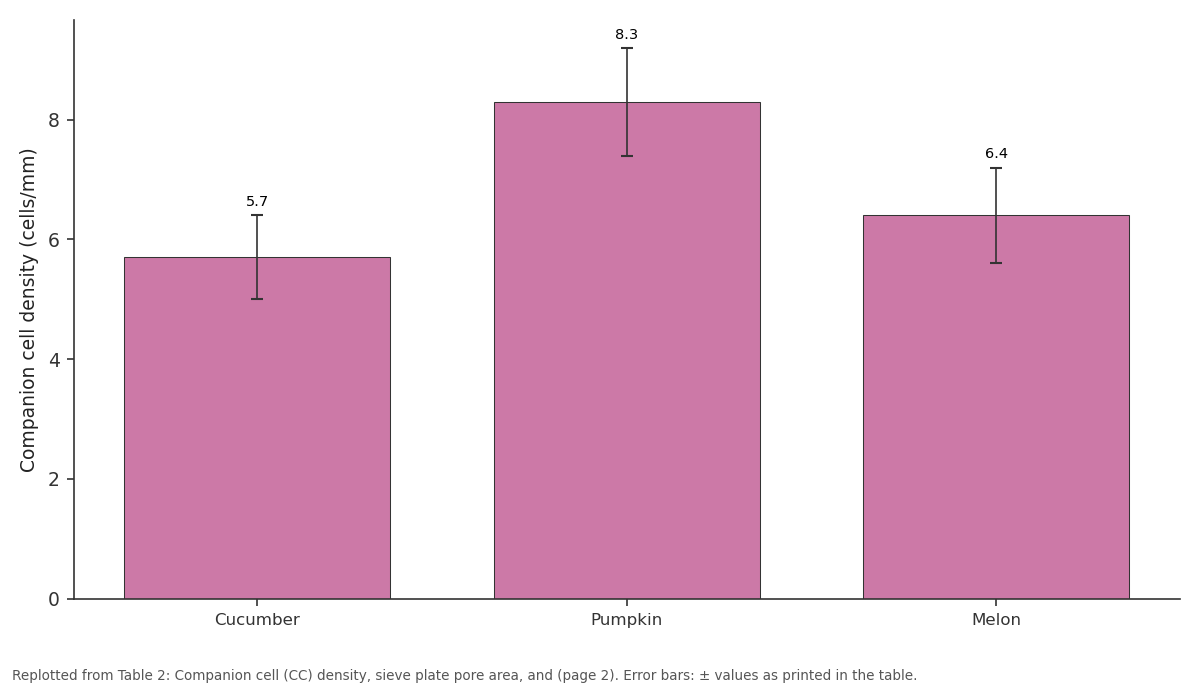
CC Density (cells/mm): Cucumber vs Pumpkin vs Melon
Replotted from Table 2 (page 2) of the original paper. Every bar is the paper's own table value.
View source evidence ↗Figures & tables
From the original paper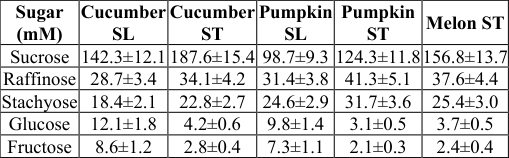 Table 1
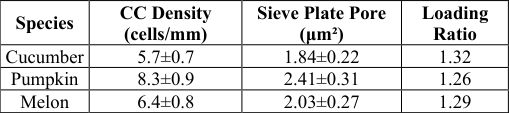 Table 2
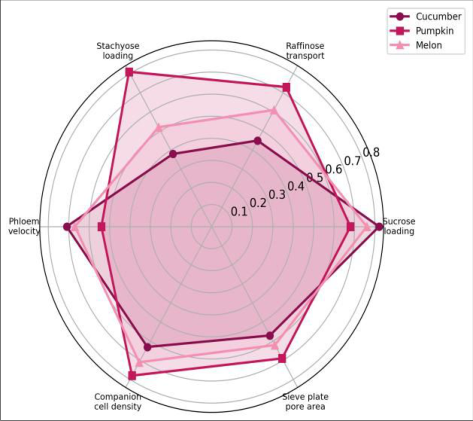 Figure 1
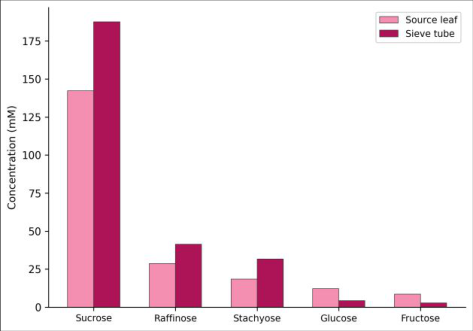 Figure 2
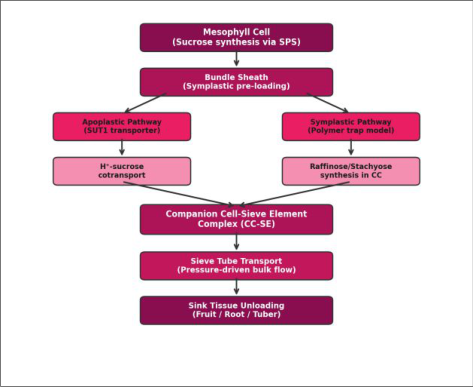 Figure 3
Introduction
Among flowering plants, cucurbits stand out for their extraordinary phloem transport capacity. A single pumpkin fruit can gain more than 5 kg of dry matter per day at peak growth, demanding a sugar delivery rate that few other species match [1] . The loading mechanism that makes this possible-the polymer-trap model-was proposed by Turgeon and colleagues three decades ago and remains the best-supported explanation for symplastic phloem loading in the Cucurbitaceae [2] . In the polymer-trap model, sucrose synthesised in mesophyll cells diffuses through plasmodesmata into specialised intermediary companion cells, where it is converted to raffinose and stachyose by galactinol synthase and raffinose/stachyose synthases [3] . Because these oligosaccharides are too large to pass back through the narrow plasmodesmatal channels connecting companion cells to mesophyll, they become trapped, creating a concentration gradient that pulls more sucrose inward and drives bulk flow through the sieve tubes [4] . Yet comparative data on loading kinetics, RFO profiles, and companion cell anatomy across cucurbit species remain limited [5,6] . This research measured sugar concentrations in source leaves and sieve tube exudate of cucumber, pumpkin, and melon, quantified companion cell density in minor veins, and related these anatomical and biochemical parameters to phloem loading efficiency.
Material and Methods
Material and Methods
Study Area Description
Plants were grown in a research glasshouse at the Centro de Ciencias de la Vida Austral, Valdivia, Chile (39°48′ S, 73°14′ W), from September 2022 to March 2023. The glasshouse maintained day/night temperatures of 26/18 °C, relative humidity of 55-65 percent, and natural photoperiod supplemented to 14 hours with sodium vapour lamps.
Climatic Conditions
Valdivia experiences a temperate oceanic climate with mean annual temperature of 12.1 °C and rainfall of 1 871 mm. During the growing season mean daily PAR inside the glasshouse reached 620 µmol/m²/s at canopy height. Soil temperature in pots 22.4 ± 1.3 °C. No growth-limiting cold events occurred during the experiment.
Material
Three cucurbit species were used: Cucumis sativus 'Marketmore 76', Cucurbita maxima 'Atlantic Giant', and Cucumis melo 'Honey Dew'. Seeds were germinated in plug trays and transplanted at the two-true-leaf stage into 20 L pots filled with a 3:1 peat:perlite mixture. Plants were fertigated with Hoagland solution twice weekly. Eight plants per species were grown; measurements began when plants had ≥8 fully expanded source leaves (6-8 weeks posttransplanting). Sieve tube exudate was collected using the severed-stylet (stylectomy) technique with green peach aphids (Myzus persicae) as biological probes.
Methods
Aphids were allowed to settle on abaxial surfaces of mature source leaves for 12-18 h. Under a dissecting microscope, stylets were severed with a micro-cautery device, and exudate droplets were collected over 4-6 hours using microcapillary pipettes. Sugar profiles (sucrose, raffinose, stachyose, glucose, fructose) were determined by highperformance anion-exchange chromatography with pulsed amperometric detection (HPAEC-PAD; Dionex ICS-5000) using a CarboPac PA1 column. Source leaf sugars were extracted in 80 percent ethanol at 80 °C. Companion cell density was quantified in transverse sections of minor veins (class IV-V) stained with toluidine blue and imaged at 400× magnification. Statistical comparisons among species used one-way ANOVA with Tukey HSD (p < 0.05).
Results
Table 1: Sugar concentrations (mM; mean±SD, n=8) in source leaves (SL) and sieve tube exudate (ST) of three cucurbit species. Cucumber source leaves contained 142.3 mM sucrose, rising to 187.6 mM in sieve tube exudate-a 1.32-fold concentration ratio (Table 1; Figure 2). Pumpkin showed the highest RFO levels: raffinose reached 41.3 mM and stachyose 31.7 mM in sieve tubes, together exceeding sucrose in that species. Melon occupied an intermediate position for most parameters (Figure 1). Companion cell density was significantly higher in pumpkin (8.3 ± 0.9 cells/mm vein length) than in cucumber (5.7 ± 0.7) or melon (6.4 ± 0.8) (Table 2). This anatomical difference likely supports the higher galactinol synthase and stachyose synthase capacity needed for RFO production. The loading mechanism is illustrated in Figure 3.
| Species | CC Density (cells/mm) | Sieve Plate Pore (μm²) | Loading Ratio |
|---|---|---|---|
| Cucumber | 5.7±0.7 | 1.84±0.22 | 1.32 |
| Pumpkin | 8.3±0.9 | 2.41±0.31 | 1.26 |
| Melon | 6.4±0.8 | 2.03±0.27 | 1.29 |
Table text extracted from the original PDF; superscript letters are shown inline. The original table image is below.
View original table image
| Sugar (mM) | Cucumber SL | Cucumber ST | Pumpkin SL | Pumpkin ST | Melon ST |
|---|---|---|---|---|---|
| Sucrose | 142.3±12.1 | 187.6±15.4 | 98.7±9.3 | 124.3±11.8 | 156.8±13.7 |
| Raffinose | 28.7±3.4 | 34.1±4.2 | 31.4±3.8 | 41.3±5.1 | 37.6±4.4 |
| Stachyose | 18.4±2.1 | 22.8±2.7 | 24.6±2.9 | 31.7±3.6 | 25.4±3.0 |
| Glucose | 12.1±1.8 | 4.2±0.6 | 9.8±1.4 | 3.1±0.5 | 3.7±0.5 |
| Fructose | 8.6±1.2 | 2.8±0.4 | 7.3±1.1 | 2.1±0.3 | 2.4±0.4 |
Table text extracted from the original PDF; superscript letters are shown inline. The original table image is below.
View original table image
Discussion
The 1.32-fold sucrose concentration ratio in cucumber (sieve tube vs source leaf) is consistent with active loading supplementing the passive polymer-trap mechanism, a hybrid strategy suggested by Rennie and Turgeon [7] . In pumpkin, where RFOs dominate the sieve sugar pool, the polymer trap appears to be the primary driver, and the higher companion cell density provides the enzymatic machinery needed for rapid oligosaccharide synthesis [8] . The species differences we observed may reflect adaptation to fruit sink strength. Pumpkin fruits, which can exceed 100 kg, demand sustained high-flux loading; the elevated companion cell density and RFO predominance together support a greater mass-flow rate through the phloem [9,10] . Melon and cucumber, with smaller fruits, appear to rely more on apoplastic sucrose retrieval in addition to the symplastic route [11] . A limitation is that stylectomy exudate composition may not perfectly reflect in situ sieve tube concentrations due to dilution and wound responses. Future work using non-invasive ¹³C-labelling and NMR imaging could validate these estimates [12] .
Conclusion
This research demonstrates species-specific variation in phloem loading within the Cucurbitaceae. Pumpkin relies most heavily on the polymer-trap mechanism, as reflected by high RFO concentrations and elevated companion cell density. Cucumber shows a stronger sucrose-loading component, suggesting a hybrid apoplastic-symplastic strategy. These differences align with variation in fruit sink demand and may inform breeding strategies aimed at improving assimilate partitioning and fruit yield in cucurbit crops.
Acknowledgement
Acknowledgements Funding SourcesInternal grant from the Centro de Ciencias de la Vida Austral. Institutional SupportThe authors thank the Department of Plant Biology for glasshouse and HPAEC-PAD access. Contributions Not Qualifying for AuthorshipMr. Felipe Soto assisted with aphid colony maintenance; Ms. Camila Bravo helped with histological sectioning.
References
18 in the original paper- Crafts AS, Crisp CE. Phloem Transport in Plants. Freeman and Company. 1971;1:1-481.
- Turgeon R, Webb JA, Evert RF. Ultrastructure of minor veins in Cucurbita pepo leaves. Protoplasma. 1975;83(3):217-232.
- Haritatos E, Keller F, Turgeon R. Raffinose oligosaccharide concentrations measured in individual cell and tissue types in Cucumis melo L. leaves. Plant Physiology. 1996;111(2):511-519.
- Turgeon R. The role of phloem loading reconsidered. Plant Physiology. 2010;152(4):1817-1823.
- Zhang C, Turgeon R. Mechanisms of phloem loading. Current Opinion in Plant Biology. 2018;43:71-75.
- Rennie EA, Turgeon R. A comprehensive picture of phloem loading strategies. Proceedings of the National Academy of Sciences. 2009;106(33):14162-14167.
- Slewinski TL, Zhang C, Turgeon R. Structural and functional heterogeneity in phloem loading and transport. Frontiers in Plant Science. 2013;4:244.
- Liesche J, Patrick J. An update on phloem transport: a simple bulk flow under complex regulation. F1000Research. 2017;6:2096.
- Savage JA, Clearwater MJ, Haines DF, Klein T, Mencuccini M, Sevanto S, et al. Allocation, stress tolerance and carbon transport in plants: how does phloem physiology affect plant ecology? Plant Cell and Environment. 2016;39(4):709-725.
- De Schepper V, De Swaef T, Bauweraerts I, Steppe K. Phloem transport: a review of mechanisms and controls. Journal of Experimental Botany. 2013;64(16):48394850.
- Braun DM, Wang L, Ruan YL. Understanding and manipulating sucrose phloem loading, unloading, metabolism, and signalling to enhance crop yield and food security. Journal of Experimental Botany. 2014;65(7):1713-1735.
- Knoblauch M, Peters WS. What actually is the Munch hypothesis? A short history of assimilate transport by mass flow. Journal of Integrative Plant Biology. 2017;59(5):292-310.
- Turgeon R, Medville R. Phloem loading. A reevaluation of the relationship between plasmodesmatal frequencies and loading strategies. Plant Physiology. 2004;136(3):3795-3803.
- Gamalei YV. Structure and function of leaf minor veins in trees and herbs. Trees. 1989;3(2):96-110.
- Voitsekhovskaja OV, Koroleva OA, Batashev DR, Knop C, Tomos AD, Gamalei YV, et al. Phloem loading in two Scrophulariaceae species. What can drive symplastic flow via plasmodesmata? Plant Physiology. 2006;140(1):383-395.
- van Bel AJ. The phloem, a miracle of ingenuity. Plant Cell and Environment. 2003;26(1):125-149.
- Ayre BG. Membrane-transport systems for sucrose in relation to whole-plant carbon partitioning. Molecular Plant. 2011;4(3):377-394.
- Schulz A. Phloem. Structure related to function. Progress in Botany. 1998;59:429-475.