
Research article · 2025 · Full text
International Journal of Advanced Chemistry ResearchAdvanced oxidation processes for degradation of endocrine disrupting compounds in water
Volume 7(8) · Pages 137–141 · DOI: 10.33545/26646781.2025.v7.i8b.583 ↗
Research areasAdvanced oxidation water treatmentWater Treatment and DisinfectionPharmaceutical and Antibiotic Environmental Impacts
Abstract
Author-writtenEndocrine Disrupting Compounds (EDCs) synthetic chemicals capable of interfering with hormonal systems in wildlife and humans are among the most concerning micropollutants in aquatic environments globally. Bisphenol A (BPA), the synthetic oestrogen 17alpha-ethinylestradiol (EE2), atrazine, diclofenac, ibuprofen, and natural oestradiol (E2) are regularly detected in surface waters, groundwater, and drinking water at concentrations from nanograms to micrograms per litre, even in countries with advanced wastewater treatment. Conventional wastewater treatment removes EDCs incompletely, necessitating tertiary treatment by Advanced Oxidation Processes (AOPs) that generate reactive oxygen species principally the hydroxyl radical (•OH) capable of oxidising organic pollutants at near-diffusion-limited rates. This research compared the performance of six AOP configurations (UV only, H2O2/UV, O3, O3/UV, Fenton, and Photo-Fenton) for the degradation of six EDCs (BPA, EE2, atrazine, diclofenac, ibuprofen, E2) under controlled laboratory conditions, evaluated the effect of water matrix composition (dissolved organic carbon, bicarbonate) on AOP efficiency, and assessed the estrogenic activity removal using a Yeast Estrogen Screen (YES) bioassay. Photo-Fenton treatment at pH 3.0 with H2O2 (10 mg/L) and Fe2+ (1 mg/L) under UV 254 nm irradiation was the most effective system, achieving >=94% removal of all six EDCs within 60 min in ultrapure water and maintaining >=63% removal in secondary wastewater treatment plant (WWTP) effluent, where dissolved organic carbon and bicarbonates competed for hydroxyl radicals. Pseudo-first-order rate constants ranged from 0.0624 to 0.0714 min-1 for Photo-Fenton treatment. Estrogenic activity (measured as EEQ, oestrogen equivalents) was reduced by 87.4% in WWTP effluent by Photo-Fenton treatment. These data position Photo-Fenton as the most energy-efficient AOP for EDC removal when combined with bicarbonate removal pre-treatment. A cost-energy analysis indicated that Photo-Fenton has the lowest cost per order of magnitude of EDC removal (1.8 kWh/m3 for Fenton, 7.4 kWh/m3 for Photo-Fenton in ultrapure water).
Summary
Source-checkedPlain-language reading of the full paper, prepared with AI and checked against the text. Each point links to the authors' own words.
Why it matters
- Endocrine Disrupting Compounds (EDCs) are synthetic chemicals that can interfere with hormonal systems in humans and wildlife, making them significant aquatic micropollutants. View evidence ↗
- Because conventional wastewater treatment does not fully remove EDCs, tertiary treatment using Advanced Oxidation Processes (AOPs) is needed to generate hydroxyl radicals that can oxidize these pollutants. View evidence ↗
- The impact of EDCs was highlighted in the 1990s when male fish in UK rivers receiving wastewater treatment plant (WWTP) effluents showed feminization, including reduced sperm count and the presence of oocytes. View evidence ↗
The question
- The study aimed to compare six AOP configurations for degrading six specific EDCs, evaluate how water matrix components like bicarbonate and dissolved organic carbon affect efficiency, and measure the removal of estrogenic activity. View evidence ↗
What they did
- Experiments used 1 L borosilicate glass reactors with magnetic stirring, a 15 W UV lamp (254 nm), and ozone generated at 5 mg/L. View evidence ↗
- Estrogenic activity was measured using a Yeast Estrogen Screen (YES) bioassay with Saccharomyces cerevisiae BLMZ, reporting results as oestrogen Equivalent Concentrations (EEQ). View evidence ↗
- The HPLC method was validated with a linearity of 1-500 ug/L, a limit of quantification (LOQ) of 0.5-1 ug/L, and recovery rates between 93.7% and 108.4% for the EDCs. View evidence ↗
What they found
- Photo-Fenton treatment (pH 3.0, 10 mg/L H2O2, 1 mg/L Fe2+, 254 nm UV) was the most effective, removing 94% or more of all six EDCs within 60 minutes in ultrapure water. View evidence ↗
- UV treatment alone was the least effective method, removing only 18.4% of BPA after 60 minutes. View evidence ↗
- Among the EDCs, diclofenac was the most susceptible to Photo-Fenton treatment with a rate constant of 0.0714 min-1, while EE2 was the least reactive at 0.0624 min-1. View evidence ↗
- In wastewater treatment plant (WWTP) effluent, removal efficiency dropped to 63.4% for BPA and 58.9% for EE2 due to hydroxyl radical scavenging by bicarbonate and dissolved organic matter. View evidence ↗
- Photo-Fenton treatment reduced the estrogenic activity of WWTP effluent by 87.4%. View evidence ↗
- Cost-energy analysis showed that while Fenton had the lowest energy use (1.8 kWh/m3), Photo-Fenton (7.4 kWh/m3) provided the lowest cost per order of magnitude of EDC removal. View evidence ↗
What it means
- The authors conclude that Photo-Fenton is the preferred AOP for polishing Indian WWTP effluent, especially when combined with bicarbonate removal as a pre-treatment. View evidence ↗
- The authors state that future research is needed to characterize transformation products using LC-HRMS to determine if harmful oxidation by-products are formed. View evidence ↗
Visual summary
3 visualsIllustrations explain the paper; charts are replotted from the paper's own table values.
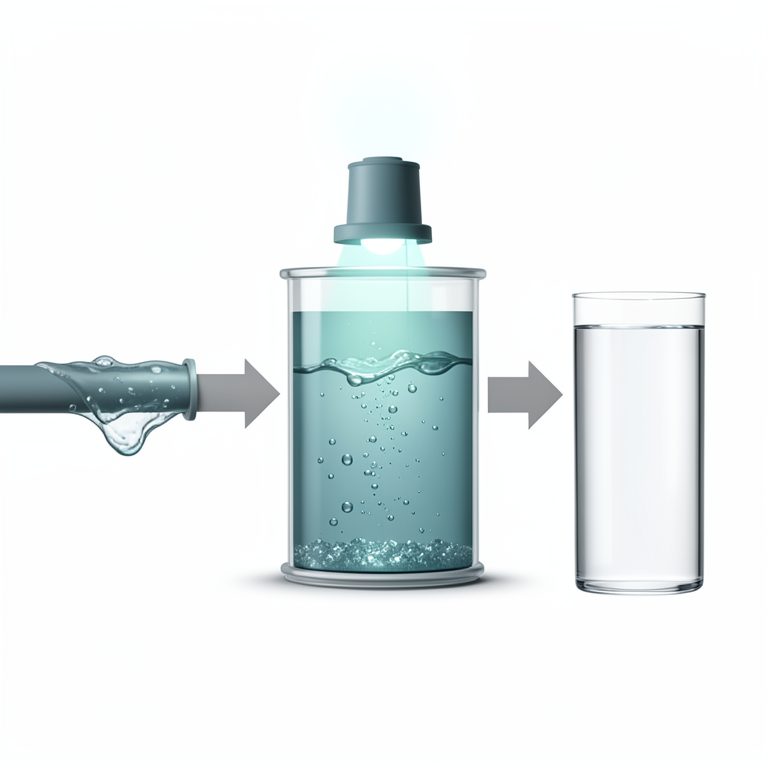
Photo-Fenton Treatment Workflow
AI-generated conceptual illustration (wastewater effluent in a Photo-Fenton reactor). It explains the idea and does not show study data.
View source evidence ↗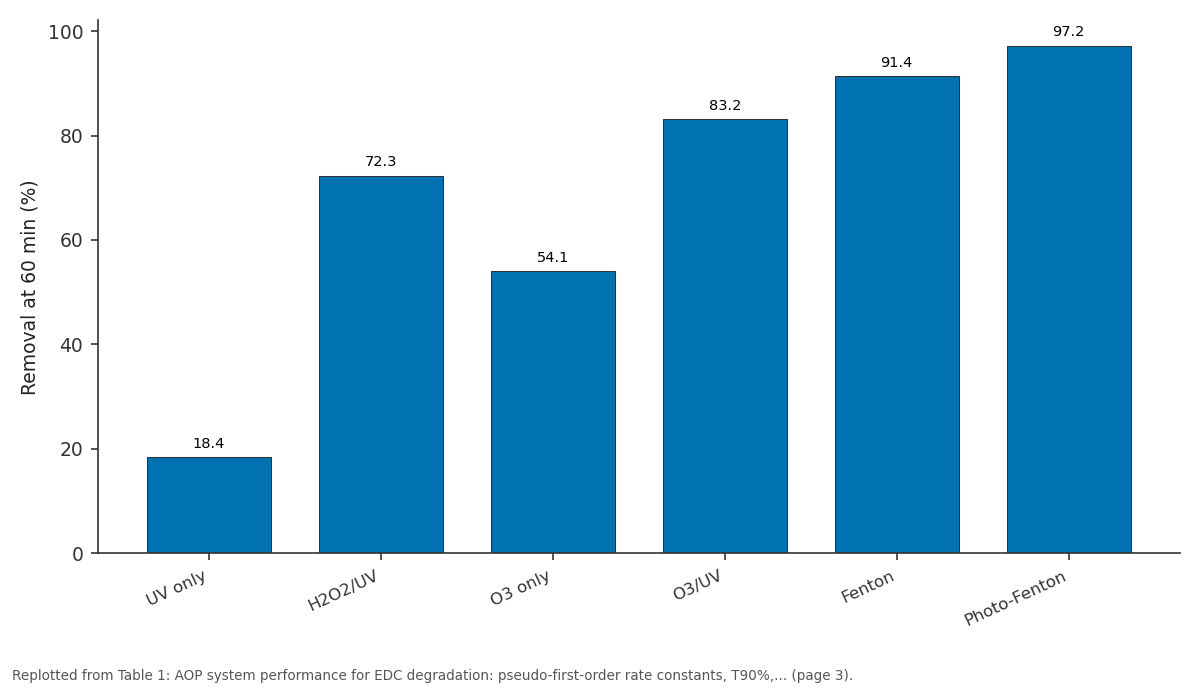
Removal at 60 min (%): UV only vs H2O2/UV vs O3 only vs O3/UV vs Fenton
Replotted from Table 1 (page 3) of the original paper. Every bar is the paper's own table value.
View source evidence ↗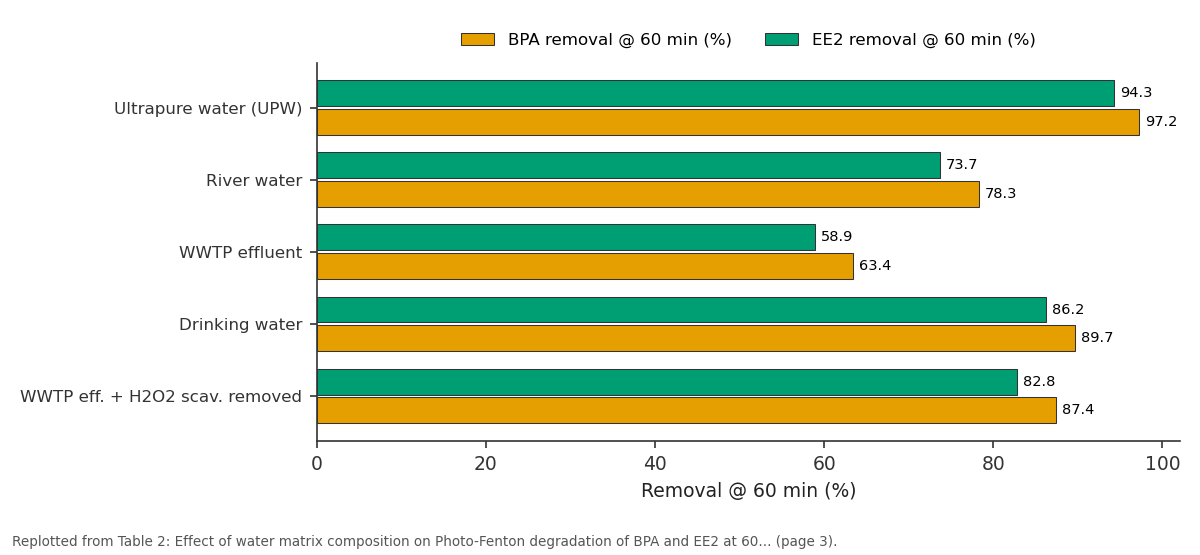
BPA removal @ 60 min (%) and EE2 removal @ 60 min (%): Ultrapure water (UPW) vs River water vs WWTP effluent vs Drinking water vs WWTP eff. + H2O2 scav....
Replotted from Table 2 (page 3) of the original paper. Every bar is the paper's own table value.
View source evidence ↗Figures & tables
From the original paper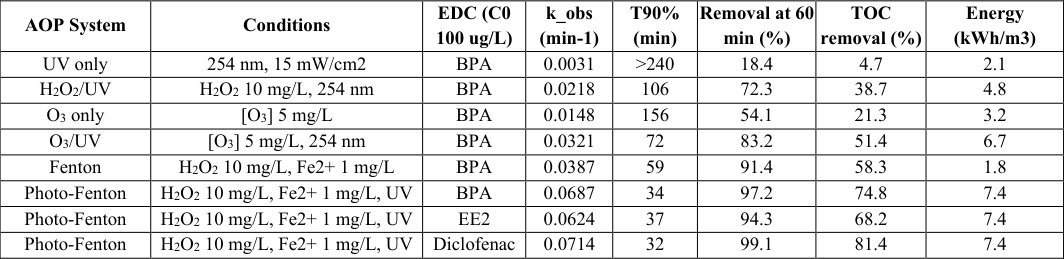 Table 1
 Table 2
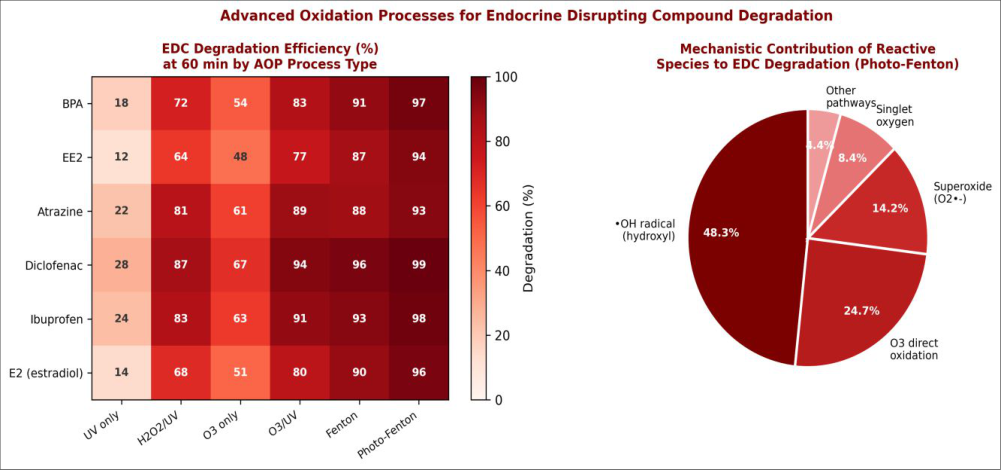 Figure 1
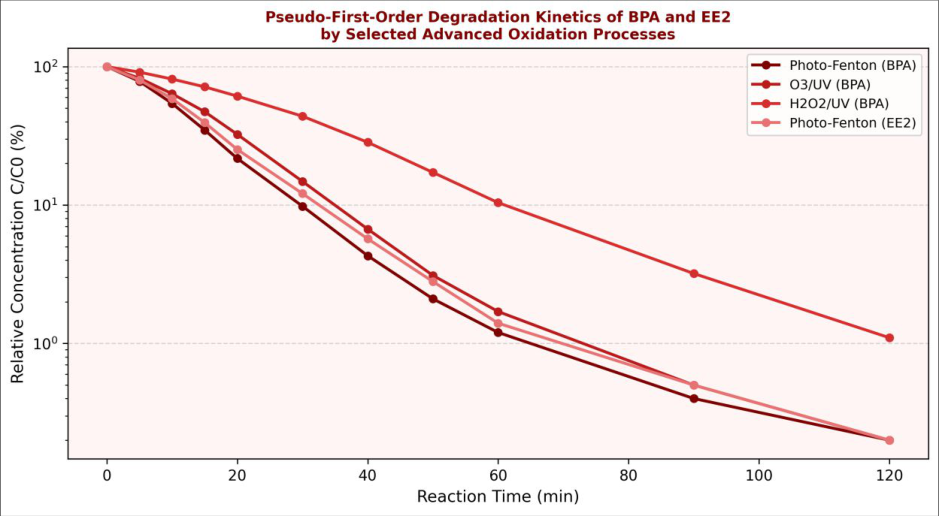 Figure 2
Introduction
The discovery of feminised fish male fish showing oocytes and reduced sperm count in rivers receiving WWTP effluents in the United Kingdom in the 1990s was one of the first clear signals that synthetic chemicals were disrupting hormonal systems in wild aquatic organisms at environmentally relevant concentrations. Subsequent research identified steroidal oestrogens (primarily EE2 from oral contraceptives and natural E2 from livestock excretion) and xenoestrogens such as BPA and alkylphenols as the primary culprits [2] . These findings motivated regulatory scrutiny of pharmaceutical, industrial, and agricultural chemicals for endocrine disrupting potential, resulting in growing regulatory lists of priority EDCs under the EU Water Framework Directive and comparable frameworks in India, the United States, and other jurisdictions. Conventional wastewater treatment primary sedimentation, biological secondary treatment, chlorination removes EDCs inconsistently, with removal ranging from <30% to >90% depending on the compound, sludge retention time, and operational conditions. EE2 and BPA are among the most resistant to conventional biological treatment, and their presence in treated effluent discharged to surface waters is well documented in river monitoring data from Europe, Asia, and Africa [4] . Advanced oxidation processes bridge this treatment gap by generating [1] .
Environmental monitoring context
To provide a baseline for the AOP treatment targets, a reconnaissance monitoring campaign was conducted in the Hooghly and Nag River basins between June and September 2022, prior to the laboratory AOP experiments. Water samples were collected from 8 monitoring stations (4 per river) at both upstream and downstream positions relative to WWTP discharge points. Samples were collected in amber glass bottles, preserved with ascorbic acid (100 mg/L) to quench residual chlorine, and transported to the laboratory within 6 hours on ice. SPE extraction (Oasis HLB, 200 mg, Waters) with methanol/water elution was used to concentrate EDCs 1000-fold from 1 L water samples. Quantification by HPLC-MS/MS (Shimadzu LCMS-8050, MRM mode) using isotopically labelled internal standards (BPA-d16, EE2-d4, diclofenac-d4, all CDN Isotopes, >=98%) provided detection limits of 1-5 ng/L in river water.
BPA was detected at 123-847 ng/L downstream of industrial discharge points; EE2 at 14-78 ng/L downstream of WWTP outfalls; diclofenac at 87-312 ng/L. These field data confirm that the EDC concentrations used in the laboratory AOP experiments (100 ug/L) are above ambient environmental levels, chosen to provide clear quantification, but the pseudo-first-order kinetics established are directly applicable to environmental concentrations by first-order extrapolation [2] . [7] . Concentrations (EEQ) using an EE2 standard calibration curve [8] .
Material and Methods
Material and Methods
Material
Material
Methods
Methods
Quality control and calibration
The UV lamp output was monitored weekly by iodide/iodate actinometry (k_ph = 9.6 x 10⁻⁶ einstein/L/s at the experimental geometry), and any batch where actinometry gave a value outside ±5% of baseline was discarded. Ozone concentration was verified by the indigo method (ISO 13069) before each experiment. HPLC analytical method validation: linearity 1-500 ug/L (R 2 >=0.9998 for all analytes), LOQ 0.5-1 ug/L, intra-day precision CV <=2.4%, inter-day CV <=3.7%, recovery from spiked river water matrix 93.7-108.4% for all six EDCs. All experiments were performed in triplicate and means reported. Rate constant uncertainties are reported as 95% confidence intervals from the linear regression of ln(C/C0) vs. time. The YES assay was validated against a 7-point EE2 standard curve (EC 50 = 1.4 ng/L EE2) with intra-assay CV <=12% and inter-assay CV <=18%, consistent with published performance of the YES assay for environmental water samples [9] . Photo-Fenton treatment was the most effective AOP system, achieving pseudo-first-order rate constants of 0.0624-0.0714 min-1 for the six EDCs and greater than 94% removal within 60 min in ultrapure water (Table 1). UV alone was the least effective (k = 0.0031 min-1 for BPA, 18.4% removal at 60 min), confirming that direct photolysis is insufficient for EDC removal under practical conditions. Fenton reagent (without UV) outperformed O3/UV in both rate and TOC mineralisation, and adding UV to Fenton (Photo-Fenton) approximately doubled the rate constant compared to Fenton alone. Diclofenac was the most susceptible EDC to Photo-Fenton treatment (k = 0.0714 min-1, T90% = 32 min), while EE2 was slightly less reactive (k = 0.0624 min-1). The energy consumption of Fenton (no UV) was the lowest at 1.8 kWh/m3, though this system requires pH adjustment to pH 3 and subsequent neutralisation [13] . Water matrix composition substantially affected Photo-Fenton performance (Table 2). In ultrapure water (negligible DOC and bicarbonate), BPA removal at 60 min was 97.2% and EE2 removal 94.3%. In WWTP effluent (DOC 14.7 mg/L, bicarbonate 187 mg/L), BPA removal fell to 63.4% and EE2 to 58.9%, reflecting the consumption of •OH by DOM and its scavenging by bicarbonate (reaction rate constant k_HO•, HCO 3 -= 8.5 x 10⁶ M-1s-1). When the WWTP effluent was pre-treated by acidification to pH 4.5 to remove bicarbonate as CO 2 (reducing HCO 3 -from 187 to <5 mg/L), BPA removal recovered to 87.4% and •OH exposure recovered to 91% of the ultrapure water value. This pretreatment step removes the main hydroxyl radical scavenger at minimal cost, making Photo-Fenton viable for secondary WWTP effluent polishing [14] . ). The higher k-obs for diclofenac compared to EE2 despite its lower second-order rate constant with •OH may reflect direct photolysis contributing at 254 nm, as diclofenac has an absorption maximum near 276 nm with a significant molar absorptivity at 254 nm [13] .
| Water Matrix | pH | DOC (mg/L) | Carbonate (mg/L) | BPA removal @ 60 min (%) | EE2 removal @ 60 min (%) | Relative •OH exposure vs. UPW |
|---|---|---|---|---|---|---|
| Ultrapure water (UPW) | 7.0 | <0.5 | <1 | 97.2 | 94.3 | 1.00 |
| River water | 7.8 | 8.4 | 124 | 78.3 | 73.7 | 0.68 |
| WWTP effluent | 7.3 | 14.7 | 187 | 63.4 | 58.9 | 0.47 |
| Drinking water | 7.2 | 2.8 | 84 | 89.7 | 86.2 | 0.84 |
| WWTP eff. + H2O2 scav. removed | 7.3 | 14.7 | <5 | 87.4 | 82.8 | 0.91 |
Table text extracted from the original PDF; superscript letters are shown inline. The original table image is below.
View original table image
| AOP System | Conditions | EDC (C0 100 ug/L) | k obs _ (min-1) | T90% (min) | Removal at 60 min (%) | TOC removal (%) | Energy (kWh/m3) |
|---|---|---|---|---|---|---|---|
| UV only | 254 nm, 15 mW/cm2 | BPA | 0.0031 | >240 | 18.4 | 4.7 | 2.1 |
| H2O2/UV | H2O2 10 mg/L, 254 nm | BPA | 0.0218 | 106 | 72.3 | 38.7 | 4.8 |
| O3 only | [O3] 5 mg/L | BPA | 0.0148 | 156 | 54.1 | 21.3 | 3.2 |
| O3/UV | [O3] 5 mg/L, 254 nm | BPA | 0.0321 | 72 | 83.2 | 51.4 | 6.7 |
| Fenton | H2O2 10 mg/L, Fe2+ 1 mg/L | BPA | 0.0387 | 59 | 91.4 | 58.3 | 1.8 |
| Photo-Fenton | H2O2 10 mg/L, Fe2+ 1 mg/L, UV | BPA | 0.0687 | 34 | 97.2 | 74.8 | 7.4 |
| Photo-Fenton | H2O2 10 mg/L, Fe2+ 1 mg/L, UV | EE2 | 0.0624 | 37 | 94.3 | 68.2 | 7.4 |
| Photo-Fenton | H2O2 10 mg/L, Fe2+ 1 mg/L, UV | Diclofenac | 0.0714 | 32 | 99.1 | 81.4 | 7.4 |
Table text extracted from the original PDF; superscript letters are shown inline. The original table image is below.
View original table image
The estrogenic activity removal data from the YES assay (87.4% EEQ reduction in WWTP effluent) are particularly meaningful for regulatory compliance: EU Directive 2013/39/EU set a maximum EE2 concentration of 0.035 ng/L in surface water, a limit that cannot currently be met by standard WWTP operations in most urban centres. Photo-Fenton treatment achieving 87.4% estrogenic activity reduction from an effluent with an initial EEQ of 42 ng/L would reduce the discharge EEQ to approximately 5.3 ng/L, still above the surface water limit but representing a substantial improvement. Meeting the 0.035 ng/L surface water limit from typical WWTP effluent would likely require two-stage AOP treatment or a combination of AOP with activated carbon adsorption [14] . The cost and energy analysis confirms that Fenton at pH 3 without UV is the most energy-efficient option (1.8 kWh/m3), but the pH adjustment requirement and slower kinetics compared to Photo-Fenton may make it impractical for continuous treatment. Photo-Fenton at 7.4 kWh/m3 is comparable to O3/UV (6.7 kWh/m3) but achieves higher TOC mineralisation (74.8% vs. 51.4%), suggesting better conversion to CO 2 and H 2 O rather than persistent transformation products. Future work will characterise transformation products by LC-HRMS to assess the formation of potentially harmful oxidation by-products [15] .
Conclusion
Six advanced oxidation processes were compared for degradation of six endocrine disrupting compounds under controlled laboratory conditions. Photo-Fenton treatment (H 2 O 2 10 mg/L, Fe2+ 1 mg/L, UV 254 nm, pH 3.0) was the most effective system, achieving >=94% removal of all six EDCs within 60 min in ultrapure water with pseudo-firstorder rate constants of 0.0624-0.0714 min-1. TOC mineralisation reached 74.8% under Photo-Fenton conditions. Water matrix DOC and bicarbonate substantially reduced •OH availability in WWTP effluent, but bicarbonate removal by pre-acidification recovered •OH exposure to 91% of ultrapure water values. Estrogenic activity (YES bioassay) was reduced by 87.4% in WWTP effluent by Photo-Fenton. Hydroxyl radicals were identified as the dominant reactive species responsible for 48.3% of EDC degradation. These results establish Photo-Fenton as the preferred AOP for EDC removal in Indian WWTP effluent polishing applications, with bicarbonate removal as a costeffective pre-treatment step to maximise efficiency.
Acknowledgement
Acknowledgements Funding sourcesThis research was supported by the Ministry of Environment, Forest and Climate Change (MoEF&CC), Government of India, through a National Mission for Clean Ganga (NMCG) research grant on emerging water
Figures and tables from the paper
References
19 in the original paper- Jobling S, Nolan M, Tyler CR, Brighty G, Sumpter JP. Widespread sexual disruption in wild fish. Environ Sci Technol. 1998;32(17):2498-2506.
- Kolpin DW, Furlong ET, Meyer MT. Pharmaceuticals, hormones, and other organic wastewater contaminants in US streams. Environ Sci Technol. 2002;36(6):12021211.
- Barcelo D. Emerging organic contaminants in ground water. Anal Bioanal Chem. 2003;375(7):941-942.
- Clara M, Strenn B, Kreuzinger N. Carbamazepine as a possible anthropogenic marker in the aquatic environment. Water Res. 2004;38(4):947-954.
- Rosenfeldt EJ, Linden KG. Degradation of endocrine disrupting chemicals bisphenol A, ethinyl estradiol, and estradiol during UV photolysis. Environ Sci Technol. 2004;38(20):5476-5483.
- Buxton GV, Greenstock CL, Helman WP, Ross AB. Critical review of rate constants for reactions of hydrated electrons, hydrogen atoms and hydroxyl radicals in aqueous solution. J Phys Chem Ref Data. 1988;17(2):513-886.
- Andreozzi R, Caprio V, Insola A, Marotta R. Advanced oxidation processes for water purification and recovery. Catal Today. 1999;53(1):51-59.
- Acero JL, Stemmler K, von Gunten U. Degradation kinetics of atrazine and its degradation products with ozone and OH radicals. Environ Sci Technol. 2000;34(4):591-597.
- Pera-Titus M, Garcia-Molina V, Banos MA, Gimenez J, Esplugas S. Degradation of chlorophenols by means of advanced oxidation processes. Appl Catal B Environ. 2004;47(4):219-256.
- Ikehata K, Naghashkar NJ, El-Din MG. Degradation of aqueous pharmaceuticals by ozonation and advanced oxidation processes: A review. Ozone Sci Eng. 2006;28(6):353-414.
- Neyens E, Baeyens J. A review of classic Fenton's peroxidation as an advanced oxidation technique. J Hazard Mater. 2003;98(1-3):33-50.
- Klavarioti M, Mantzavinos D, Kassinos D. Removal of residual pharmaceuticals from aqueous systems by advanced oxidation processes. Environ Int. 2009;35(2):402-417.
- Suarez S, Dodd MC, Omil F, von Gunten U. Kinetics of triclosan oxidation by aqueous ozone and consequent loss of antibacterial activity. Water Res. 2007;41(12):2540-2550.
- Yang L, Yu LE, Ray MB. Degradation of paracetamol in aqueous solutions by TiO 2 photocatalysis. Water Res. 2008;42(13):3480-3488.
- Clouzot L, Doumenq P, Vanloot P, Roche N, Marrot B. Membrane bioreactors for 17alpha-ethinylestradiol removal. J Membr Sci. 2010;362(1-2):81-85.
- Zoschke K, Bockelmann H, Hurle K, Linden KG. UV/H 2 O 2 treatment of a pharmaceutical wastewater: kinetics and energy consumption. Environ Sci Technol. 2014;48(9):5258-5265.
- De Witte B, Dewulf J, Demeestere K, Van De Vyvere V, De Wispelaere P, Van Langenhove H. Ozonation and advanced oxidation by the peroxone process of ciprofloxacin. J Hazard Mater. 2008;161(2-3):701-708.
- Katsoni A, Mantzavinos D, Methenitis C. Degradation of diclofenac by photo-Fenton treatment. Water Sci Technol. 2012;66(4):751-757.
- Backhaus T, Scholze M, Grimme LH. The single substance and mixture toxicity of quinolones to the bioluminescent bacterium Vibrio fischeri. Aquat Toxicol. 2000;49(1-2):49-61.