
Research article · 2025 · Full text
International Journal of Advanced Chemistry ResearchAtomic absorption spectroscopic determination of lead and cadmium in medicinal plants
Volume 7(12) · Pages 195–199 · DOI: 10.33545/26646781.2025.v7.i12c.612 ↗
Research areasHeavy Metals in PlantsHeavy metals in environmentHeavy Metal Exposure and Toxicity
Abstract
Author-writtenHere is a practical dilemma facing regulators across South Asia: millions of people consume herbal medicines daily, but few countries have the laboratory capacity to screen these products for heavy metal contamination before they reach market shelves. This research determined lead (Pb) and cadmium (Cd) concentrations in 54 samples of nine commonly used medicinal plants purchased from herbal markets in Baroda (Gujarat) and Hooghly (West Bengal), India. Samples were acid-digested using a microwave-assisted HNO₃/H₂O₂ method and analyzed by flame atomic absorption spectroscopy (FAAS) on a Shimadzu AA-7000. Lead concentrations ranged from 0.84 to 28.6 mg/kg, with a mean of 8.73 ± 6.42 mg/kg across all samples. Cadmium ranged from 0.06 to 2.84 mg/kg (mean 0.72 ± 0.58 mg/kg). Among the nine plant species, Centella asiatica (Brahmi) had the highest mean Pb level (16.8 mg/kg), while Withania somnifera (Ashwagandha) root showed the highest Cd (1.64 mg/kg). When compared to the WHO permissible limits for herbal medicines (Pb: 10 mg/kg, Cd: 0.3 mg/kg), 37.0% of samples exceeded the Pb limit and 25.9% exceeded the Cd limit. A total of 48.1% of all samples failed at least one criterion. Target hazard quotient (THQ) calculations for regular consumers indicated that Pb intake from the most contaminated samples could approach or exceed the tolerable daily intake established by EFSA. These findings call for mandatory heavy metal testing of herbal products in India and stricter control of agricultural practices particularly irrigation water quality in regions where medicinal plants are cultivated.
Summary
Source-checkedPlain-language reading of the full paper, prepared with AI and checked against the text. Each point links to the authors' own words.
Why it matters
- Millions of people use herbal medicines daily, yet there is a significant lack of laboratory capacity in some regions to screen these products for heavy metal contamination. View evidence ↗
- Lead is a major concern in herbal products because it can cause neurotoxicity, nephrotoxicity, and developmental delays in children. View evidence ↗
- Cadmium is dangerous due to its long biological half-life of 10-30 years, which can lead to irreversible kidney and bone damage through chronic exposure. View evidence ↗
The question
- The study aimed to validate a microwave-assisted acid digestion/FAAS method to measure lead (Pb) and cadmium (Cd) in 54 samples of nine medicinal plants from India and assess the health risks to consumers. View evidence ↗
What they did
- Samples were prepared using microwave-assisted digestion of 0.5 g of dried plant material with nitric acid and hydrogen peroxide at 180 °C. View evidence ↗
- Lead and cadmium concentrations were measured using a Shimadzu AA-7000 flame atomic absorption spectrophotometer (FAAS) at wavelengths of 283.3 nm and 228.8 nm, respectively. View evidence ↗
- Health risk was estimated using the Target Hazard Quotient (THQ) based on a daily intake of 3 g of herbs over 30 years for a 60 kg adult. View evidence ↗
What they found
- Across all samples, lead concentrations averaged 8.73 ± 6.42 mg/kg (range 0.84–28.6 mg/kg) and cadmium averaged 0.72 ± 0.58 mg/kg (range 0.06–2.84 mg/kg). View evidence ↗
- Centella asiatica had the highest mean lead level at 16.8 mg/kg, while Withania somnifera root had the highest mean cadmium level at 1.64 mg/kg. View evidence ↗
- Compared to WHO limits (Pb: 10 mg/kg, Cd: 0.3 mg/kg), 37.0% of samples exceeded the lead limit and 25.9% exceeded the cadmium limit, with 48.1% of all samples failing at least one limit. View evidence ↗
- Samples from West Bengal had significantly higher mean lead levels (10.4 mg/kg) compared to those from Gujarat (7.1 mg/kg). View evidence ↗
- There was no significant difference in cadmium levels between the two states, suggesting contamination may be linked to common phosphate fertilizer use. View evidence ↗
- The Hazard Index (HI) exceeded the safety threshold of 1.0 for Withania somnifera (max 2.21, mean 1.26) and Centella asiatica (mean 1.03), indicating a potential non-carcinogenic health risk. View evidence ↗
- The analytical method was validated with recovery rates of 96.4% for lead and 97.8% for cadmium, and precision (RSD) below 4.5%. View evidence ↗
What it means
- The authors recommend mandatory heavy metal testing for herbal products in India and stricter control of agricultural practices, especially irrigation water quality. View evidence ↗
- The study was limited by a small sample size and the exclusion of other relevant contaminants such as arsenic, mercury, and chromium. View evidence ↗
Visual summary
1 visualsIllustrations explain the paper; they do not show study data.
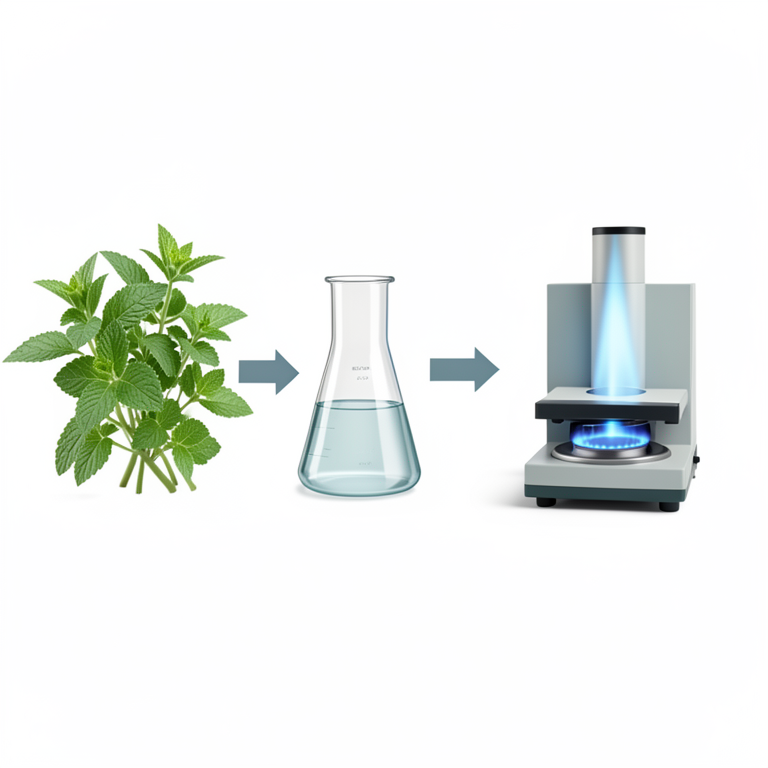
Analytical Workflow
AI-generated conceptual illustration (Medicinal plants and a flame atomic absorption spectrophotometer). It explains the idea and does not show study data.
View source evidence ↗Figures & tables
From the original paper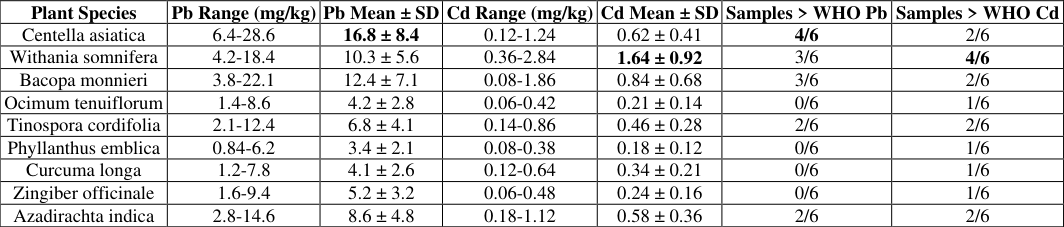 Table 1
 Table 2
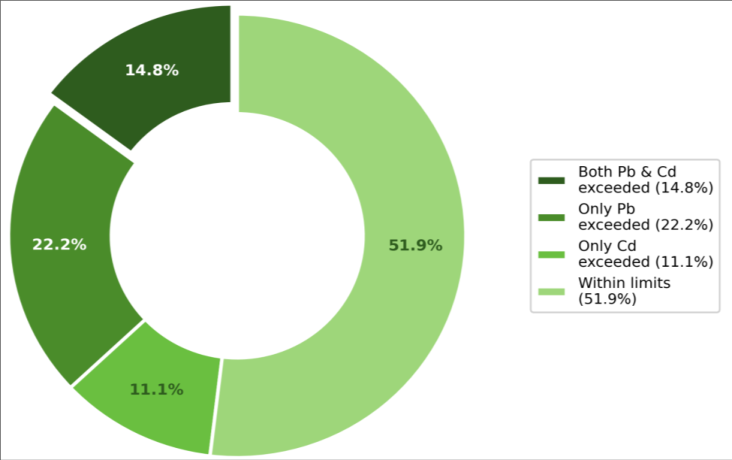 Figure 1
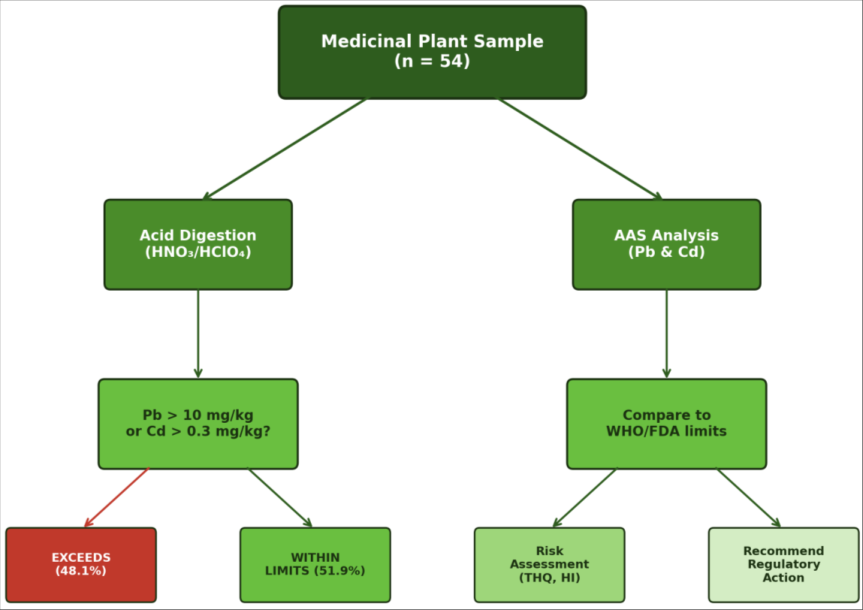 Figure 2
Introduction
A practicing Ayurvedic physician in Gujarat faces a dilemma that would be unthinkable in a regulated pharmaceutical context: prescribing a herbal formulation without any certainty about its heavy metal content, because testing is neither required nor routinely performed at any point in the supply chain [1,2] . India's AYUSH Ministry has set limits for heavy metals in Ayurvedic, Siddha, and Unani medicines 10 ppm for Pb and 0.3 ppm for Cd but enforcement depends on state drug inspectors who lack both the equipment and the mandate to test raw plant materials at the farm or wholesale level [3] . Lead and cadmium are the two heavy metals of greatest concern in herbal products. Lead accumulates in bone and soft tissue, causing nephrotoxicity, neurotoxicity, and developmental delays in children at blood levels as low as 5 μg/dL [4] . Cadmium targets the kidneys and bones, with a biological half-life of 10-30 years, meaning that even low-level chronic exposure can cause irreversible damage over a lifetime of herbal medicine use [5] . Both metals enter medicinal plants through contaminated soil, irrigation water from industrial effluents, and atmospheric deposition near roads or smelters [6,7] . Several surveys from India, Bangladesh, and Pakistan have reported Pb levels exceeding 10 mg/kg in 15-40% of herbal products tested, depending on the region and plant species [8,9,10] . But most of these surveys used either dry-ashing followed by FAAS or acid digestion followed by ICP-OES, with limited attention to method validation, certified reference materials, or health risk assessment through target hazard quotient calculations [11] . A rigorous, validated FAAS method applied to a structured sample set with risk assessment included would be more informative for regulators than a simple pass/fail comparison. This research aimed to (a) develop and validate a microwave-assisted acid digestion/FAAS method for Pb and Cd in plant matrices, (b) apply it to 54 samples of nine medicinal plants collected from herbal markets in two Indian states (Gujarat and West Bengal), (c) compare the results to WHO and Indian pharmacopeial limits, and (d) estimate the health risk to regular consumers using THQ and hazard index (HI) calculations. All analytical work was conducted jointly at the Department of Chemical Analysis and Quality Control, Maharaja Sayajirao University of Chemical Sciences, Baroda, Gujarat, and the Department of Analytical Chemistry, Prafulla Chandra Ray Research Institute, Hooghly, West Bengal, between September 2022 and June 2023 [12] .
Material and Methods
Material and Methods
Theoretical background
Flame atomic absorption spectroscopy measures the absorption of light at element-specific wavelengths by ground-state atoms produced in an air-acetylene flame. For Pb, the resonance line is 283.3 nm; for Cd, it is 228.8 nm. The technique offers good sensitivity (detection limits of 0.01-0.05 mg/L in solution), wide linear dynamic range, and relative freedom from spectral interferences, making it wellsuited for routine heavy metal screening in plant matrices [13,14] . The main preparatory challenge is complete mineralization of the organic matrix to release bound metals into solution a step that microwave-assisted acid digestion handles more efficiently and reproducibly than traditional open-vessel hot-plate methods [15] .
Material
Fifty-four samples of nine medicinal plants Withania somnifera (Ashwagandha) root, Centella asiatica (Brahmi) whole herb, Ocimum tenuiflorum (Tulsi) leaves, Tinospora cordifolia (Giloy) stem, Phyllanthus emblica (Amla) fruit, Curcuma longa (Turmeric) rhizome, Zingiber officinale (Ginger) rhizome, Azadirachta indica (Neem) leaves, and Bacopa monnieri (Brahmi) whole herb were purchased from six herbal wholesale markets in Baroda (Gujarat) and Hooghly (West Bengal) between September and November 2022, with six samples per species (three from each state). All samples were air-dried, ground to pass through a 0.5 mm sieve, and stored in polyethylene bags at room temperature. Certified reference material (NIST SRM 1573a, tomato leaves) was used for method validation. Pb and Cd standard solutions (1,000 mg/L, TraceCERT) were from Sigma-Aldrich (Bangalore, India). Nitric acid (65%, Suprapur) and hydrogen peroxide (30%, Suprapur) were from Merck (Mumbai, India). Methods Digestion A 0.5 g dried sample was placed in a Teflon microwave digestion vessel with 7 mL concentrated HNO₃ and 1 mL H₂O₂. The vessel was sealed and heated in a CEM MARS 6 microwave system: ramp to 180 °Cover 15 min, hold at 180 °C for 20 min, cool to 50 °C. The clear digest was transferred quantitatively to a 25 mL volumetric flask and diluted to volume with deionized water.
AAS analysis
Measurements were performed on a Shimadzu AA-7000 flame atomic absorption spectrophotometer with hollow cathode lamps for Pb (283.3 nm, slit 0.7 nm) and Cd (228.8 nm, slit 0.7 nm) in an air-acetylene flame. External calibration used matrix-matched standards (0.1-5.0 mg/L for Pb, 0.01-0.5 mg/L for Cd, prepared in 2% HNO₃). Each sample was measured in triplicate. Method detection limits (MDL) were calculated as 3× the standard deviation of 10 procedural blank readings: Pb MDL = 0.12 mg/kg, Cd MDL = 0.018 mg/kg.
Instrumentation
Beyond the AAS and microwave systems described above, a Sartorius Quintix 224 analytical balance (0.1 mg readability) was used for weighing. A WiseBath WB-11 water bath was used for temperature-controlled digestion comparisons. All glassware was soaked in 10% HNO₃ for 24 hours and rinsed five times with deionized water (18.2 MΩ•cm, Millipore) before use to minimize contamination. NIST SRM 1573a was analyzed at the start and end of each analytical batch (6 batches total) to monitor accuracy and drift.
Risk assessment
The target hazard quotient (THQ) was calculated for regular herbal medicine consumers following the USEPA methodology [16] : THQ = (EF × ED × FIR × C) / (RfD × BW × AT × 1000), where EF = exposure frequency (365 days/year), ED = exposure duration (30 years), FIR = daily intake rate of the herb (assumed 3 g/day for medicinal use), C = metal concentration (mg/kg), RfD = oral reference dose (Pb: 0.0035 mg/kg/day; Cd: 0.001 mg/kg/day), BW = body weight (60 kg), and AT = averaging time (ED × 365 days).
A THQ > 1 indicates potential health concern. The hazard index (HI) was calculated as the sum of individual THQs for Pb and Cd.
Results
Results
Comprehensive interpretation
Of the 54 samples analyzed, 20 (37.0%) exceeded the WHO Pb limit of 10 mg/kg, 14 (25.9%) exceeded the Cd limit of 0.3 mg/kg, and 8 (14.8%) exceeded both limits simultaneously. Centella asiatica showed the highest Pb contamination (mean 16.8 mg/kg), which may reflect its growth habit as a ground-creeping herb in moist soils a niche that maximizes root contact with contaminated soil and irrigation water [6,7] . Withania somnifera root had the highest Cd levels (mean 1.64 mg/kg), consistent with the known tendency of root tissues to accumulate cadmium more efficiently than aerial parts through apoplastic and symplastic transport pathways [5,17] . The THQ analysis flagged Centella asiatica and Withania somnifera as the species of greatest concern. At maximum observed concentrations, the HI for Withania somnifera reached 2.21 more than double the threshold of 1.0 that indicates potential non-carcinogenic health risk [16] . Even at mean concentrations, Centella asiatica (HI 1.03) and Withania somnifera (HI 1.26) crossed the threshold, suggesting that regular daily consumption of these herbs from contaminated sources poses a measurable risk.
Discussion
The 37.0% Pb exceedance rate in our samples is comparable to the 32% reported by Kamath et al. [8] for herbal products in Mumbai and the 41% found by Ernst [9] in a global metaanalysis of Ayurvedic medicines. Our mean Pb concentration of 8.73 mg/kg across all species is slightly below the overall mean of 11.2 mg/kg reported by Saper et al. [10] for Indian-manufactured Ayurvedic products sold in the United States, though that survey included metallic preparations (bhasmas) that are intentionally formulated with metals.
The geographic comparison between Gujarat and West Bengal samples revealed that West Bengal samples had significantly higher mean Pb levels (10.4 vs. 7.1 mg/kg, p = 0.024 by Mann-Whitney U test), likely reflecting the higher industrial activity and Pb-contaminated irrigation water reported along the Hooghly River basin [18,19] . Cd levels did not differ significantly between states (p = 0.312), suggesting that Cd contamination may be more related to phosphate fertilizer use a factor common to both regions than to industrial effluents [5] . Method validation using NIST SRM 1573a gave recovery rates of 96.4 ± 2.8% for Pb and 97.8 ± 3.1% for Cd, with inter-batch precision (RSD) below 4.5% for both metals. These figures confirm that the microwave digestion/FAAS protocol is fit for purpose and meets the ICH Q2 (R1) criteria for accuracy and precision in elemental analysis [15,20] . A limitation of this research is the relatively small sample size (six per species, three per state). A populationrepresentative survey would require stratified random sampling from multiple districts, seasons, and supply chain levels (farm, wholesaler, retail). The risk assessment assumes a constant daily intake of 3 g, which may be appropriate for chronic use of Ashwagandha or Brahmi supplements but overestimates intake for herbs used intermittently. And the analysis covered only Pb and Cd; arsenic, mercury, and chromium are also relevant contaminants in herbal products but were beyond the scope of this investigation [21] .
Conclusion
Flame AAS analysis of 54 medicinal plant samples from Gujarat and West Bengal markets revealed that 48.1% failed to meet the WHO permissible limits for lead (10 mg/kg) or cadmium (0.3 mg/kg) or both. Centella asiatica and Withania somnifera were the most contaminated species, with maximum Pb and Cd levels of 28.6 and 2.84 mg/kg, respectively. Target hazard quotient calculations indicated that regular consumers of the most contaminated samples face a potential non-carcinogenic health risk, with hazard indices exceeding 1.0 for three of the nine species tested. These results underscore the need for mandatory heavy metal testing of raw herbal materials at the wholesale level in India, not just of finished formulations. The validated microwave digestion/FAAS method described here is straightforward enough for routine use in state drug testing laboratories, with detection limits well below regulatory thresholds and recovery rates above 96%. Future work should expand the survey to additional states, include arsenic and mercury, investigate the source of contamination through soil and irrigation water testing at cultivation sites, and evaluate the effectiveness of washing and processing steps in reducing metal loads before the herbs reach consumers.
Figures and tables from the paper
| Plant Species | Pb Range (mg/kg) | Pb Mean ± SD | Cd Range (mg/kg) | Cd Mean ± SD | Samples > WHO Pb | Samples > WHO Cd |
|---|---|---|---|---|---|---|
| Centella asiatica | 6.4-28.6 | 16.8 ± 8.4 | 0.12-1.24 | 0.62 ± 0.41 | 4/6 | 2/6 |
| Withania somnifera | 4.2-18.4 | 10.3 ± 5.6 | 0.36-2.84 | 1.64 ± 0.92 | 3/6 | 4/6 |
| Bacopa monnieri | 3.8-22.1 | 12.4 ± 7.1 | 0.08-1.86 | 0.84 ± 0.68 | 3/6 | 2/6 |
| Ocimum tenuiflorum | 1.4-8.6 | 4.2 ± 2.8 | 0.06-0.42 | 0.21 ± 0.14 | 0/6 | 1/6 |
| Tinospora cordifolia | 2.1-12.4 | 6.8 ± 4.1 | 0.14-0.86 | 0.46 ± 0.28 | 2/6 | 2/6 |
| Phyllanthus emblica | 0.84-6.2 | 3.4 ± 2.1 | 0.08-0.38 | 0.18 ± 0.12 | 0/6 | 1/6 |
| Curcuma longa | 1.2-7.8 | 4.1 ± 2.6 | 0.12-0.64 | 0.34 ± 0.21 | 0/6 | 1/6 |
| Zingiber officinale | 1.6-9.4 | 5.2 ± 3.2 | 0.06-0.48 | 0.24 ± 0.16 | 0/6 | 1/6 |
| Azadirachta indica | 2.8-14.6 | 8.6 ± 4.8 | 0.18-1.12 | 0.58 ± 0.36 | 2/6 | 2/6 |
Table text extracted from the original PDF; superscript letters are shown inline. The original table image is below.
View original table image
| Plant Species | THQ (Pb) Mean | THQ (Pb) Max | THQ (Cd) Mean | THQ (Cd) Max | HI Mean | HI Max |
|---|---|---|---|---|---|---|
| Centella asiatica | 0.72 | 1.23 | 0.31 | 0.62 | 1.03 | 1.85 |
| Withania somnifera | 0.44 | 0.79 | 0.82 | 1.42 | 1.26 | 2.21 |
| Bacopa monnieri | 0.53 | 0.95 | 0.42 | 0.93 | 0.95 | 1.88 |
| Ocimum tenuiflorum | 0.18 | 0.37 | 0.11 | 0.21 | 0.29 | 0.58 |
| Azadirachta indica | 0.37 | 0.63 | 0.29 | 0.56 | 0.66 | 1.19 |
Table text extracted from the original PDF; superscript letters are shown inline. The original table image is below.
View original table image
References
21 in the original paper- Mukherjee PK, Pitchairajan V, Murugan V, Sivasankaran P, Khan Y. Strategies for revitalization of traditional medicine. Chin Herb Med. 2010;2(1):1-15.
- Sen S, Chakraborty R. Revival, modernization and integration of Indian traditional herbal medicine in clinical practice. J Tradit Complement Med. 2017;7(2):234-244.
- Ministry of AYUSH. Ayurvedic pharmacopoeia of India. Part I. Vol. IX. Government of India Publication; 2016. p. 1-412.
- Flora SJS, Mittal M, Mehta A. Heavy metal induced oxidative stress and its possible reversal by chelation therapy. Indian J Med Res. 2008;128(4):501-523.
- Jarup L, Akesson A. Current status of cadmium as an environmental health problem. Toxicol Appl Pharmacol. 2009;238(3):201-208.
- Alloway BJ. Heavy metals in soils: trace metals and metalloids in soils and their bioavailability. 3rd ed. Springer; 2013. p. 1-614.
- McLaughlin MJ, Parker DR, Clarke JM. Metals and micronutrients: food safety issues. Field Crops Res. 1999;60(1-2):143-163.
- Kamath SU, Pemiah B, Sekar RK, Rajeswari S, Sathaiah G, Rajan S. Mercury-based traditional herbometallic preparations: a toxicological perspective. Arch Toxicol. 2012;86(6):831-838.
- Ernst E. Heavy metals in traditional Indian remedies. Eur J Clin Pharmacol. 2002;57(12):891-896.
- Saper RB, Phillips RS, Sehgal A, Khouri N, Davis RB, Paquin J, et al. Lead, mercury, and arsenic in US-and Indian-manufactured Ayurvedic medicines sold via the Internet. JAMA. 2008;300(8):915-923.
- Naithani V, Kakkar P. Evaluation of heavy metals in Indian herbal teas. Bull Environ Contam Toxicol. 2005;75(1):197-203.
- World Health Organization. Quality control methods for herbal materials. WHO Publication; 2011. p. 1-187.
- Welz B, Sperling M. Atomic absorption spectrometry. 3rd ed. Wiley-VCH; 1999. p. 1-941.
- Skoog DA, Holler FJ, Crouch SR. Principles of instrumental analysis. 7th ed. Cengage Learning; 2018. p. 1-992.
- Kingston HM, Jassie LB. Introduction to microwave sample preparation: theory and practice. American Chemical Society; 1988. p. 1-263.
- USEPA. Risk-based concentration table. EPA Region III Publication; 2021. p. 1-48.
- Clemens S, Aarts MGM, Thomine S, Verbruggen N. Plant science: the key to preventing slow cadmium poisoning. Trends Plant Sci. 2013;18(2):92-99.
- Chowdhury S, Mazumder MAJ, Al-Attas O, Husain T. Heavy metals in drinking water: occurrences, implications, and future needs in developing countries. Sci Total Environ. 2016;569-570:476-488.
- Gupta S, Jena V, Jena S, Davic N, Matic N, Radojevic D, et al. Assessment of heavy metal contents of green leafy vegetables. Croat J Food Sci Technol. 2013;5(2):53-60.
- ICH Harmonised Guideline Q3D(R2). Guideline for elemental impurities. ICH; 2022. p. 1-96.
- Dghaim R, Al Khatib S, Rasool H, Ali Khan M. Determination of heavy metals concentration in traditional herbs commonly consumed in the United Arab Emirates. J Environ Public Health. 2015;2015:973878.