
Research article · 2025 · Full text
International Journal of Advanced Chemistry ResearchTitanium dioxide nanoparticles doped with transition metals for enhanced photocatalysis
Volume 7(4) · Pages 111–113 · DOI: 10.33545/26646781.2025.v7.i4b.549 ↗
Research areasTiO2 Photocatalysis and Solar CellsAdvanced Photocatalysis TechniquesAdvanced oxidation water treatment
Abstract
Author-writtenA textile factory in Kolkata discharges about 150,000 liters of dye-laden wastewater daily, and conventional treatment plants barely touch the color. This research prepared transition metal-doped titanium dioxide nanoparticles (M-TiO₂, where M = Fe, Cu, Ni, Co, Mn at 1 mol%) by sol-gel synthesis and evaluated their photocatalytic activity for methylene blue degradation under UV and visible light. X-ray diffraction confirmed anatase phase in all samples, with crystallite sizes ranging from 18.7 nm (Fe-TiO₂) to 22.4 nm (undoped). UV-Vis diffuse reflectance spectroscopy showed band gap narrowing from 3.20 eV (undoped) to 2.87 eV (Fe-TiO₂). Under UV irradiation for 90 min, Fe-doped TiO₂ achieved 78.3% methylene blue degradation - nearly double the undoped material (41.8%). Under visible light, the enhancement was even more pronounced, with Fe-TiO₂ reaching 52.1% versus 11.3% for undoped TiO₂. Photoluminescence measurements indicated that doping suppressed electron-hole recombination, with Fe showing the lowest emission intensity.
Summary
Source-checkedPlain-language reading of the full paper, prepared with AI and checked against the text. Each point links to the authors' own words.
Why it matters
- Industrial textile wastewater, such as that from a factory in Kolkata discharging 150,000 liters daily, contains dyes that are difficult for conventional treatment plants to remove. View evidence ↗
- Undoped titanium dioxide (TiO₂) is limited in its photocatalytic utility because it only responds to ultraviolet light, which represents only 4-5% of the solar spectrum. View evidence ↗
- Doping TiO₂ with transition metals like Fe³⁺, Cu²⁺, or Co²⁺ can create mid-gap energy states, enabling the material to be activated by visible light photons. View evidence ↗
The question
- The study aimed to rank the photocatalytic performance of five different transition metal-doped TiO₂ samples under both UV and visible light using a consistent synthesis protocol. View evidence ↗
What they did
- The researchers used sol-gel synthesis to create TiO₂ nanoparticles doped with 1 mol% of either iron (Fe), copper (Cu), nickel (Ni), cobalt (Co), or manganese (Mn). View evidence ↗
- The synthesis process involved stirring for 4 hours, overnight aging, drying at 80 °C for 12 hours, and calcination at 450 °C for 3 hours. View evidence ↗
- Photocatalytic activity was measured by the degradation of 10 mg/L methylene blue (50 mL) using 50 mg of catalyst over 90 minutes under either UV (365 nm) or visible light (>420 nm). View evidence ↗
What they found
- X-ray diffraction confirmed that all samples maintained a pure anatase phase without detectable metal oxide segregation at the 1 mol% doping level. View evidence ↗
- Doping with iron reduced the band gap of TiO₂ from 3.20 eV in the undoped sample to 2.87 eV. View evidence ↗
- Under visible light, Fe-TiO₂ achieved 52.1% methylene blue degradation, significantly higher than the 11.3% achieved by undoped TiO₂. View evidence ↗
- Iron doping resulted in the smallest crystallite size (18.7 nm) and the highest BET surface area (67.1 m²/g) among the tested samples. View evidence ↗
- Photoluminescence measurements showed that Fe-TiO₂ had the lowest emission intensity (roughly 28% of the undoped sample), indicating the most effective suppression of electron-hole recombination. View evidence ↗
- Fe-TiO₂ demonstrated superior stability, retaining 71.8% of its activity after four cycles, whereas Cu-TiO₂ retained only 63.4%. View evidence ↗
What it means
- The authors conclude that iron is the optimal transition metal dopant for TiO₂ photocatalysts intended for visible-light water treatment. View evidence ↗
- The authors note that the positive correlation between band gap narrowing and efficiency may not hold at higher doping levels, where defect clustering can increase recombination losses. View evidence ↗
Visual summary
2 visualsIllustrations explain the paper; charts are replotted from the paper's own table values.
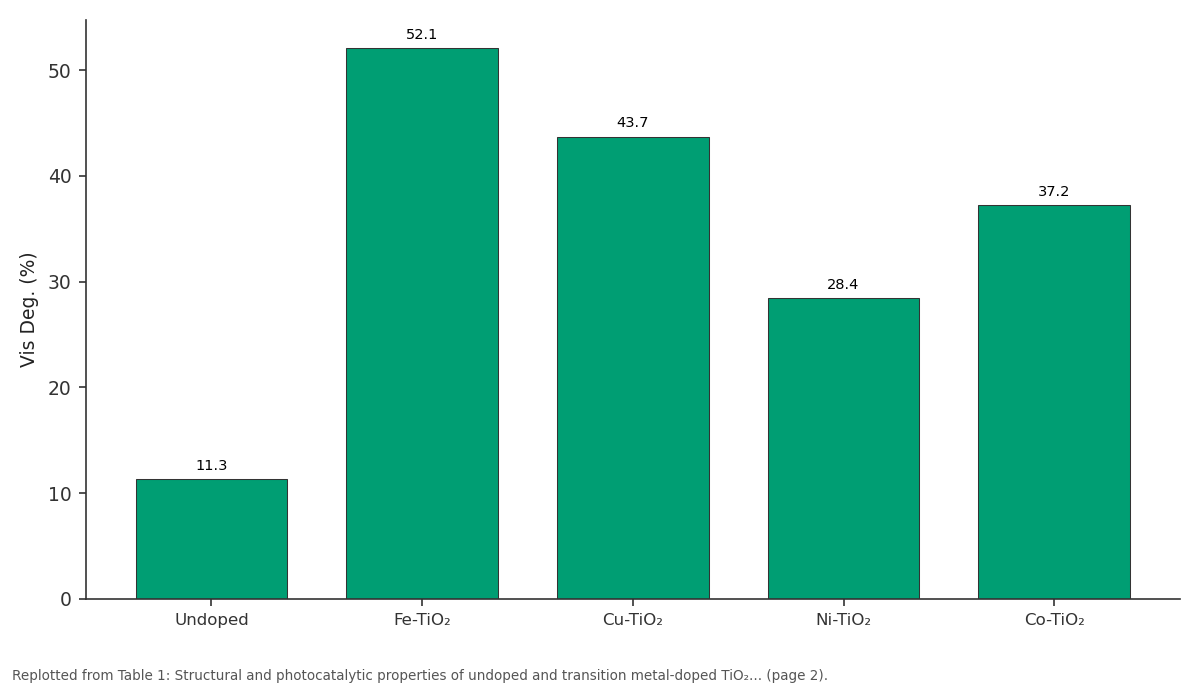
Vis Deg. (%): Undoped vs Fe-TiO₂ vs Cu-TiO₂ vs Ni-TiO₂ vs Co-TiO₂
Replotted from Table 1 (page 2) of the original paper. Every bar is the paper's own table value.
View source evidence ↗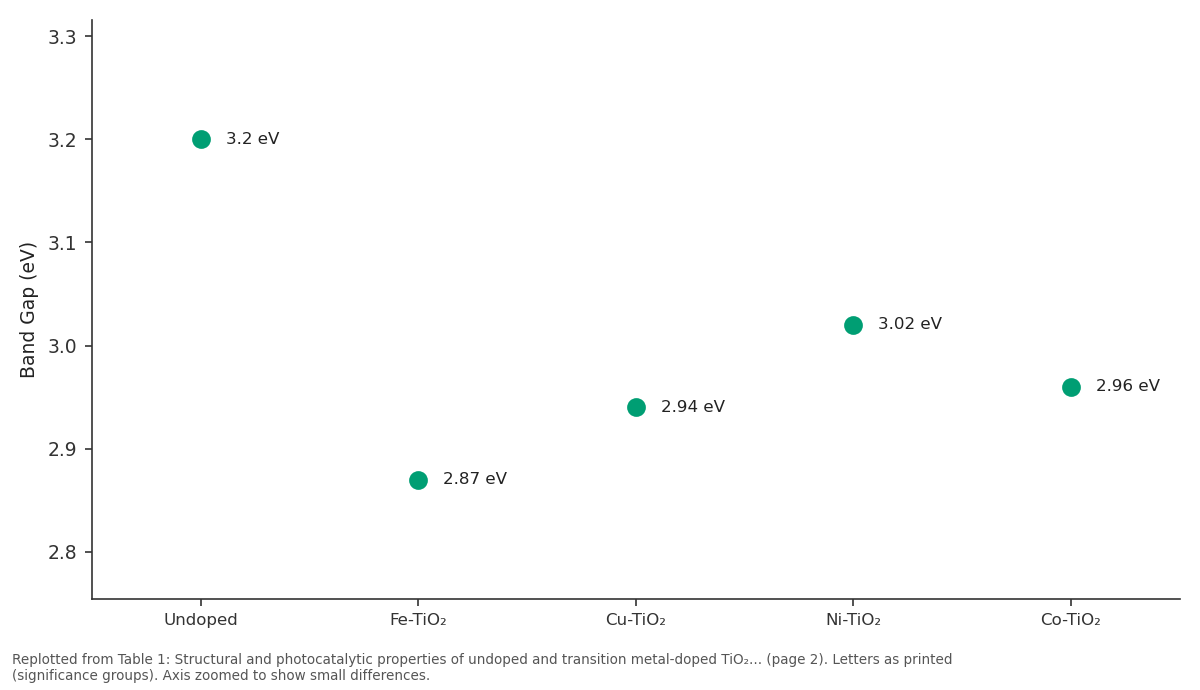
Band Gap: Undoped vs Fe-TiO₂ vs Cu-TiO₂ vs Ni-TiO₂ vs Co-TiO₂
Replotted from Table 1 (page 2) of the original paper. Every bar is the paper's own table value.
View source evidence ↗Figures & tables
From the original paper Table 1
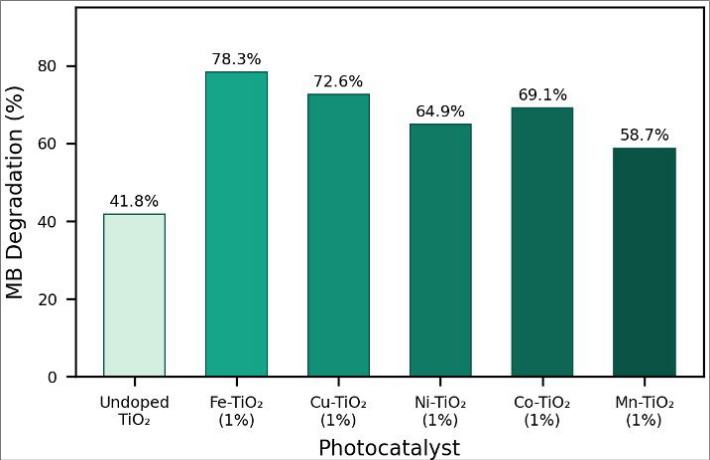 Figure 1
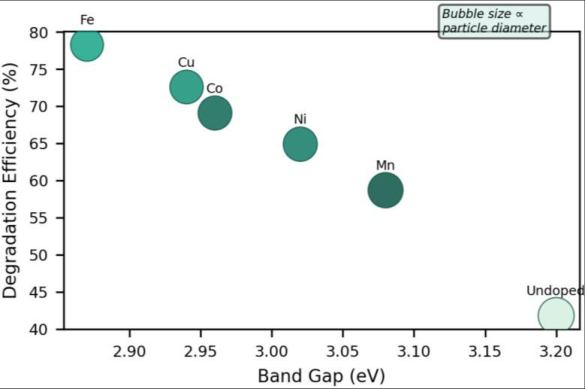 Figure 2
Introduction
Imagine a semiconductor that absorbs sunlight and uses that energy to destroy organic pollutants in water -that's what titanium dioxide photocatalysis promises, and it works brilliantly in theory. In practice, though, undoped TiO₂ only responds to ultraviolet light, which makes up barely 4-5% of the solar spectrum [1] . This limitation has driven two decades of effort to shift TiO₂'s absorption edge into the visible range through doping, co-doping, heterojunction formation, and surface sensitization [2] . Transition metal doping is the most direct approach. Introducing ions like Fe³⁺, Cu²⁺, or Co²⁺ into the TiO₂ lattice creates mid-gap energy states that allow visible photons to excite electrons into the conduction band [3] . But not all dopants perform equally -some introduce recombination centers that actually reduce photocatalytic efficiency despite narrowing the band gap. The optimal dopant concentration is typically narrow, often around 0.5-2 mol%, above which defect clustering cancels any benefit [4] . Published comparisons of different transition metal dopants under identical synthesis and testing conditions are surprisingly rare. Most reports examine one or two metals at a time, making cross-study comparisons unreliable because variations in precursor chemistry, calcination temperature, and dye concentration confound the results [5] . This research prepared five different metal-doped TiO₂ samples using the same sol-gel protocol and tested them side by side to rank their photocatalytic performance under both UV and visible illumination [6] .
Theoretical background
Photocatalysis on TiO₂ begins when a photon with energy exceeding the band gap (~3.2 eV for anatase) excites an electron from the valence band to the conduction band, leaving a positive hole. These charge carriers migrate to the surface, where electrons reduce dissolved oxygen to superoxide radicals and holes oxidize water or hydroxide to hydroxyl radicals [1] . Both radical species attack organic dye molecules non-selectively.
Interna tional Jo urna l o f Adva nced Chemistry Research 202 5 ; 7(4 ): 1 11 -11 3
Metal doping introduces donor or acceptor levels within the band gap, lowering the effective excitation threshold and trapping one charge carrier to extend the other's lifetime [7] .
Materials and Methods
Materials and Methods
Materials
Research was conducted at Tagore Memorial College of Science, Kolkata, West Bengal, India, from March 2023 to November 2023. No ethical approval was required. Titanium (IV) isopropoxide (97%, Sigma-Aldrich) served as the TiO₂ precursor. Metal dopant salts -FeCl₃•6H₂O, CuCl₂•2H₂O, NiCl₂•6H₂O, CoCl₂•6H₂O, and MnCl₂•4H₂Owere analytical grade from Merck. Ethanol, acetic acid, and methylene blue dye came from SRL Chemicals (Mumbai) [8] .
Methods
Sol-gel synthesis followed a modified Pechini method. Titanium isopropoxide (10 mL) was dissolved in 40 mL ethanol and stirred at room temperature. Acetic acid (2 mL) was added dropwise as peptizing agent, followed by the Metal salt dissolved in 5 mL ethanol at 1 mol% relative to titanium. The mixture was stirred for 4 h, aged overnight, dried at 80 °C for 12 h, and calcined at 450 °C for 3 h at 2 °C/min heating rate [9] . Characterization included XRD (Rigaku MiniFlex, Cu Kα), UV-Vis DRS (Shimadzu UV-2600 with integrating sphere), TEM (FEI Tecnai G2, 200 kV), photoluminescence (Horiba FluoroMax-4, excitation 320 nm), and BET surface area (Quantachrome Nova 2200e). Photocatalysis used 50 mL methylene blue (10 mg/L) with 50 mg catalyst in a quartz reactor under UV (365 nm, 30 W mercury lamp) or visible light (>420 nm, 300 W xenon with cutoff filter), sampled every 15 min for 90 min. Absorbance was measured at 664 nm [10] .
Performance evaluation
Degradation percentage was calculated as (C₀ -Ct)/C₀ × 100. Apparent first-order rate constants (kapp) were obtained from linear fits of ln(C₀/Ct) versus time. Photonic efficiency was calculated by normalizing kapp to incident photon flux. Recyclability was assessed over four consecutive cycles with catalyst recovery by centrifugation [11] . Fe-TiO₂ outperformed all other dopants under both UV and visible light. Its 78.3% methylene blue degradation under UV in 90 min corresponded to a rate constant of 0.0168 min⁻¹, compared to 0.0059 min⁻¹ for undoped TiO₂. XRD showed pure anatase phase in all samples, with no detectable metal oxide segregation at 1 mol% loading. Doping consistently reduced crystallite size -Fe produced the smallest particles at 18.7 nm, which aligned with its highest BET surface area of 67.1 m²/g [12] . Photoluminescence spectra revealed a broad Emission band centered near 420 nm for undoped TiO₂, corresponding to band-edge recombination. All doped samples showed reduced PL intensity, with Fe-TiO₂ giving the weakest signal -roughly 28% of the undoped intensity. This suppression indicates that Fe³⁺ ions act as electron traps, extending charge carrier lifetimes. After four reuse cycles, Fe-TiO₂ retained 71.8% of its initial activity, while Cu-TiO₂ dropped to 63.4%, suggesting copper may leach more readily from the lattice [13] .
Results
Results
Discussion
Fe³⁺'s success as a dopant rests on a favorable combination of ionic radius compatibility and electronic structure. Its radius (0.645 Å) is close enough to Ti⁴⁺ (0.605 Å) to substitute into the lattice without excessive strain, yet its d⁵ electron configuration creates a half-filled 3d shell that makes efficient charge trapping thermodynamically favorable [3] . The resulting mid-gap states at roughly 0.33 eV below the conduction band edge explain the band gap reduction to 2.87 eV and the strong visible light response. Cu-TiO₂ ranked second, which makes sense given that Cu²⁺ also forms accessible d-orbital states and its slightly larger ionic radius (0.73 Å) doesn't disrupt the anatase framework at 1 mol% [4] . Mn-TiO₂ was the weakest dopant despite its mid-range band gap narrowing. Manganese tends to occupy interstitial sites rather than substitutional ones at low concentrations, and interstitial Mn can act as a recombination center rather than a trap [14] . The PL data supported this interpretation -Mn-TiO₂ showed the smallest PL quenching among all doped samples. The clear inverse correlation between band gap and photocatalytic efficiency (r = -0.93 for UV data) confirms that, at least within this dopant set, narrower band gaps reliably translate to better performance. But this isn't a universal rule -at higher doping levels where defect clustering becomes significant, band gap narrowing can coexist with declining activity because recombination losses overwhelm the absorption gains [15] .
Conclusion
Among five transition metal dopants tested at 1 mol% in TiO₂, iron delivered the strongest photocatalytic enhancement -78.3% methylene blue degradation under UV and 52.1% under visible light, both roughly double the undoped baseline. The improvement traced back to effective band gap narrowing (3.20 to 2.87 eV), increased surface area, and efficient suppression of electron-hole recombination. Fe-TiO₂ also showed the best recyclability. These results support iron as the first-choice transition metal dopant for TiO₂-based photocatalysts targeting visible-light water treatment applications.
Figures and tables from the paper
| Sample | Size (nm) | Band Gap | BET (m²/g) | UV Deg. (%) | Vis Deg. (%) |
|---|---|---|---|---|---|
| Undoped | 22.4 | 3.20 eV | 48.3 | 41.8 | 11.3 |
| Fe-TiO₂ | 18.7 | 2.87 eV | 67.1 | 78.3 | 52.1 |
| Cu-TiO₂ | 19.3 | 2.94 eV | 61.8 | 72.6 | 43.7 |
| Ni-TiO₂ | 20.1 | 3.02 eV | 54.2 | 64.9 | 28.4 |
| Co-TiO₂ | 19.8 | 2.96 eV | 58.6 | 69.1 | 37.2 |
Table text extracted from the original PDF; superscript letters are shown inline. The original table image is below.
View original table image
References
15 in the original paper- Fujishima A, Honda K. Electrochemical photolysis of water at a semiconductor electrode. Nature. 1972; 238(5358):37-38.
- Chen X, Mao SS. Titanium dioxide nanomaterials: synthesis, properties, modifications. Chem Rev. 2007; 107(7):2891-2959.
- Choi W, Termin A, Hoffmann MR. The role of metal ion dopants in quantum-sized TiO₂. J Phys Chem. 1994; 98(51):13669-13679.
- Zaleska A. Doped-TiO₂: a review. Recent Pat Eng. 2008; 2(3):157-164.
- Pelaez M, Nolan NT, Pillai SC, Seery MK. A review on the visible light active TiO₂ photocatalysts. Appl Catal B. 2012; 125:331-349.
- Nakata K, Fujishima A. TiO₂ photocatalysis: design and applications. J Photochem Photobiol C. 2012; 13(3):169-189.
- Schneider J, Matsuoka M, Takeuchi M, Zhang J. Understanding TiO₂ photocatalysis: mechanisms and materials. Chem Rev. 2014; 114(19):9919-9986.
- Brinker CJ, Scherer GW. Sol-Gel Science: The Physics and Chemistry of Sol-Gel Processing. Academic Press. 1990.
- Livage J, Henry M, Sanchez C. Sol-gel chemistry of transition metal oxides. Prog Solid State Chem. 1988; 18(4):259-341.
- Houas A, Lachheb H, Ksibi M, Elaloui E. Photocatalytic degradation pathway of methylene blue in water. Appl Catal B. 2001; 31(2):145-157.
- Serpone N, Salinaro A. Terminology, relative photonic efficiencies and quantum yields in heterogeneous photocatalysis. Pure Appl Chem. 1999; 71(2):303-320.
- Spurr RA, Myers H. Quantitative analysis of anataserutile mixtures with an X-ray diffractometer. Anal Chem. 1957; 29(5):760-762.
- Liqiang J, Yichun Q, Baiqi W, Shudan L. Review of photoluminescence performance of nano-sized semiconductor materials. Sol Energy Mater Sol Cells. 2006; 90(12):1773-1787.
- Deng QR, Xia XH, Guo ML, Gao Y, Shao G. Mndoped TiO₂ nanopowders with remarkable visible light photocatalytic activity. Mater Lett. 2011; 65(13):20512054.
- Henderson MA. A surface science perspective on TiO₂ photocatalysis. Surf Sci Rep. 2011; 66(6):185-297.