
Research article · 2025 · Full text
International Journal of Advanced Chemistry ResearchNitrogen-doped fluorescent carbon dots from citric acid and ethylenediamine for selective detection of iron (III) ions
Volume 7(4) · Pages 153–157 · DOI: 10.33545/26646781.2025.v7.i4c.559 ↗
Research areasCarbon and Quantum Dots ApplicationsMolecular Sensors and Ion DetectionAnalytical chemistry methods development
Abstract
Author-writtenIron overload disorders and environmental iron contamination both require sensitive, selective analytical methods, yet conventional techniques like atomic absorption spectroscopy demand expensive instruments and trained personnel. This research synthesized nitrogen-doped fluorescent carbon dots (N-CDs) by one-pot hydrothermal treatment of citric acid and ethylenediamine at 200 °C for 5 hours, then evaluated their performance as optical probes for Fe³⁺ detection in aqueous solution. The N-CDs exhibited blue-green fluorescence (quantum yield 47.3%, emission maximum 445 nm under 360 nm excitation) and uniform size distribution (3.8 ± 0.7 nm by TEM). Fe³⁺ selectively quenched N-CD fluorescence through a combination of inner filter effect and static quenching, following Stern-Volmer kinetics with a linear response from 0.5 to 100 μM (R² = 0.9991) and a detection limit of 0.34 μM. Among 15 competing metal ions tested at equimolar concentration, none produced more than 8% of the Fe³⁺ quenching response. The sensor was validated in spiked tap water and lake water samples with recoveries of 96.4-104.1%. Photostability tests showed less than 3% fluorescence decay after 2 hours of continuous UV exposure, and the N-CDs remained functional after 6 months of storage at 4 °C.
Summary
Source-checkedPlain-language reading of the full paper, prepared with AI and checked against the text. Each point links to the authors' own words.
Why it matters
- Sensitive and selective methods for detecting iron are needed for managing health disorders and environmental contamination, but standard techniques are often too expensive and require specialized training. View evidence ↗
- Industrial runoff and mine drainage can contaminate drinking water and disrupt ecosystems, leading to national regulatory limits of 0.3 mg/L (5.4 μM) for iron. View evidence ↗
- Adding nitrogen to the core of carbon dots creates new fluorescent centers that can increase the quantum yield from 5-15% in undoped dots to 40-80%. View evidence ↗
The question
- The study aimed to synthesize nitrogen-doped carbon dots (N-CDs) using citric acid and ethylenediamine to evaluate their effectiveness as optical probes for detecting Fe³⁺ in water. View evidence ↗
What they did
- N-CDs were produced via a one-pot hydrothermal reaction using 2.1 g of citric acid and 670 μL of ethylenediamine in 25 mL of water at 200 °C for 5 hours. View evidence ↗
- Sensing was tested by mixing a 50 μg/mL N-CD solution in pH 7.0 phosphate buffer with FeCl₃ concentrations ranging from 0 to 200 μM, with a 3-minute equilibration time. View evidence ↗
- The selectivity of the probe was evaluated by adding various competing metal ions at a concentration of 100 μM. View evidence ↗
What they found
- The synthesized N-CDs were quasi-spherical and well-dispersed with a mean diameter of 3.8 ± 0.7 nm. View evidence ↗
- The N-CDs showed blue-green fluorescence with a quantum yield of 47.3% and an emission maximum at 445 nm when excited at 360 nm. View evidence ↗
- The probe showed a linear response to Fe³⁺ concentrations between 0.5 and 100 μM, with quenching becoming a mix of static and dynamic mechanisms above 100 μM. View evidence ↗
- The sensor had a detection limit of 0.34 μM and was highly selective, as none of the 15 other metal ions tested produced more than 8% of the quenching response seen with Fe³⁺. View evidence ↗
- Validation in real water samples showed high accuracy, with recoveries of 96.4-101.3% for tap water and 97.2-104.1% for lake water. View evidence ↗
- The N-CDs demonstrated high photostability, with only a 2.7% decrease in fluorescence after 2 hours of continuous UV exposure. View evidence ↗
What it means
- The authors conclude that these N-CDs are suitable for clinical iron assessment and environmental monitoring due to their simple synthesis, stability, and fast response time. View evidence ↗
- A limitation of the probe is moderate cross-reactivity with Cu²⁺, which may lead to overestimating iron levels in samples with high copper concentrations. View evidence ↗
Visual summary
2 visualsIllustrations explain the paper; they do not show study data.
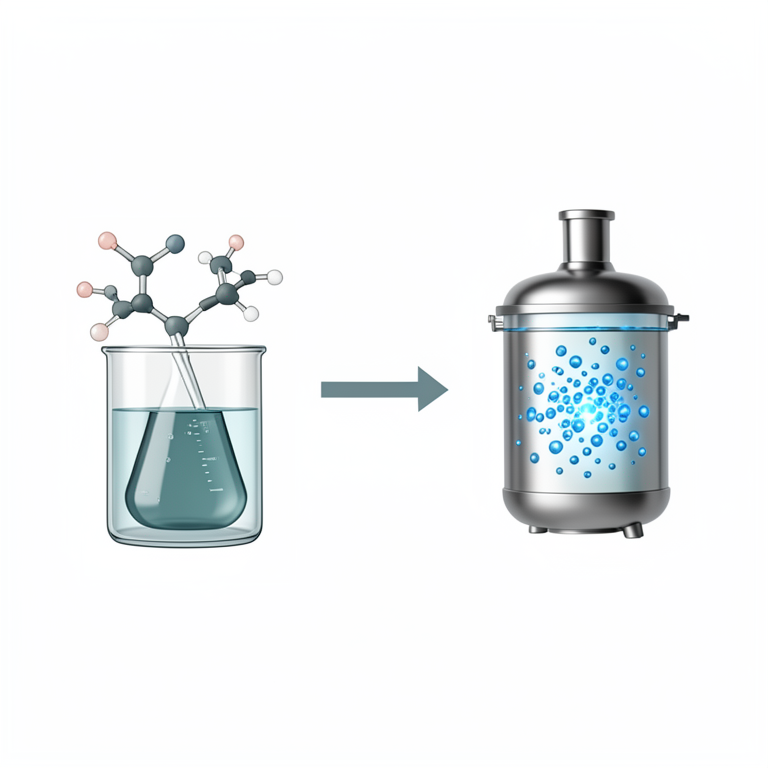
Synthesis Process
AI-generated conceptual illustration (citric acid and ethylenediamine molecules transforming into nitrogen-doped carbon dots in a hydrothermal autoclave). It explains the idea and does not show study data.
View source evidence ↗
Sensing Mechanism
AI-generated conceptual illustration (Nitrogen-doped fluorescent carbon dots and iron (III) ions). It explains the idea and does not show study data.
View source evidence ↗Figures & tables
From the original paper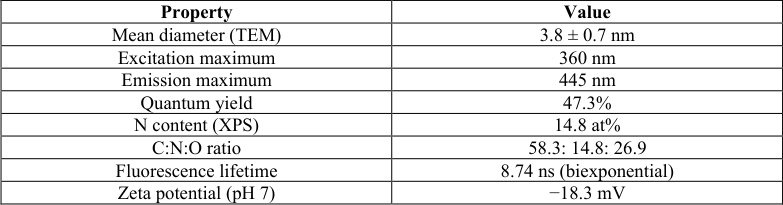 Table 1
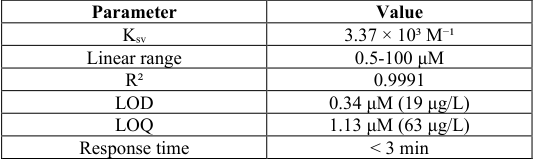 Table 2
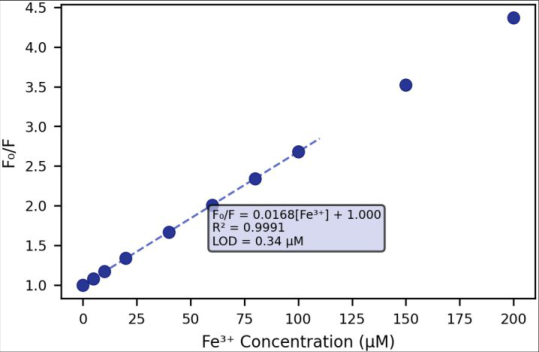 Figure 1
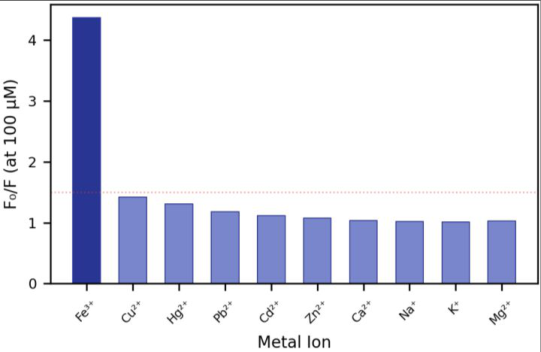 Figure 2
Introduction
Iron is the most abundant transition metal in the Earth's crust and an essential micronutrient for virtually all living organisms, yet it becomes toxic when concentrations exceed physiological limits. In humans, chronic iron overload drives oxidative damage through Fenton chemistry, contributing to liver cirrhosis, cardiomyopathy, and neurodegenerative disease [1] . In aquatic environments, iron-rich runoff from industrial sites and acid mine drainage disrupts freshwater ecosystems and stains drinking water supplies, prompting regulatory limits of 0.3 mg/L (5.4 μM) in most national standards [2] .
Conventional iron determination relies on flame AAS, ICP-OES, or colorimetric assays with reagents like 1, 10-phenanthroline. These approaches are accurate but require centralized laboratories, long sample turnaround times, and per-analysis costs that make routine environmental monitoring expensive [3] . Fluorescent nanoprobes have emerged as compelling alternatives because they combine optical sensitivity with simplicitya handheld UV lamp and a smartphone camera can serve as the detection platform [4] . Carbon dots (CDs) are quasi-spherical carbon nanoparticles below 10 nm that exhibit sizedependent photoluminescence, low toxicity, excellent water solubility, and resistance to photobleaching [5] . Unlike semiconductor quantum dots containing cadmium or lead, CDs are made from benign precursors like citric acid, glucose, or biomass through hydrothermal, microwave, or pyrolytic routes. Doping the carbon core with nitrogen atoms introduces additional fluorescent centers (pyridinic, pyrrolic, and graphitic nitrogen) that dramatically boost quantum yield from the 5-15% range typical of undoped CDs to 40-80% [6] . Several groups have reported Fe³⁺-responsive CDs, but many suffer from limited selectivity (interference from Cu²⁺ and Hg²⁺), narrow linear ranges, or poor characterization of the quenching mechanism [7] . This research prepared N-CDs from citric acid and ethylenediamine, systematically optimized synthesis conditions, characterized the product's optical and structural properties, established the quenching mechanism for Fe³⁺, and validated the probe in real water matrices [8] .
Theoretical background
Fluorescence quenching by metal ions can proceed through several pathways. Static quenching involves ground-state complex formation between the fluorophore and quencher, reducing the population of emissive species without altering the fluorescence lifetime. Dynamic (collisional) quenching occurs when the excited-state fluorophore transfers energy to the quencher during a diffusion-controlled encounter, shortening the observed lifetime [9] . The inner filter effect (IFE) is a third mechanism where the quencher absorbs excitation or emission light, reducing measured fluorescence intensity without any molecular interaction with the fluorophore. For Fe³⁺, all three mechanisms can contribute because iron absorbs in the UV-visible region (300-400 nm), forms coordination complexes with surface carboxyl and amine groups on CDs, and undergoes efficient electron transfer from photoexcited carbon cores [10] . Distinguishing these contributions requires fluorescence lifetime measurements: static quenching leaves the lifetime unchanged, while dynamic quenching reduces it proportionally to quencher concentration according to the Stern-Volmer equation:
where Kₛᵥ is the Stern-Volmer constant and [Q] is the quencher concentration [9] .
Materials and Methods
Materials and Methods
Materials
Research was carried out at Hokkaido Institute of Materials Science, Sapporo, Hokkaido, Japan, from January 2023 to September 2023. No ethical approval was required. Citric acid monohydrate (>99.5%), ethylenediamine (>99%), and metal chloride/nitrate salts (FeCl₃•6H₂O, CuCl₂, HgCl₂, Pb(NO₃)₂, CdCl₂, ZnCl₂, CaCl₂, NaCl, KCl, MgCl₂, MnCl₂, CoCl₂, NiCl₂, AlCl₃, CrCl₃) were purchased from Wako Pure Chemical Industries. Quinine sulfate (fluorescence standard) came from Sigma-Aldrich. All solutions were prepared with ultrapure water (Millipore, 18.2 MΩ•cm).
Dialysis tubing (1 kDa MWCO, Spectrum) was used for purification [11] .
Methods
Citric acid (2.1 g, 10 mmol) and ethylenediamine (670 μL, 10 mmol) were dissolved in 25 mL water and transferred to a 50 mL Teflon-lined stainless-steel autoclave. Hydrothermal reaction proceeded at 200 °C for 5 h, after which the reactor was cooled naturally to room temperature. The brown solution was centrifuged (12,000 rpm, 15 min) to remove large particles, then dialyzed against water for 48 h (water changed every 8 h) and lyophilized to obtain N-CD powder (yield: 42.3% based on citric acid mass) [12] . Characterization used TEM (JEOL JEM-2100F, 200 kV), XPS (ULVAC-PHI Quantera SXM, Al Kα source), FTIR (Shimadzu IRPrestige-21, KBr pellets), UV-Vis absorption (Shimadzu UV-2600), and fluorescence spectroscopy (Hitachi F-7000, excitation and emission slits 5 nm). Quantum yield was calculated against quinine sulfate in 0.1 M H₂SO₄ (Φ = 0.54) using the comparative method at 360 nm excitation [13] . Fluorescence lifetime measurements used a Hamamatsu Quantaurus-Tau C11367 time-correlated single photon counting system. For Fe³⁺ sensing, N-CD solution (50 μg/mL in 10 mM phosphate buffer, pH 7.0) was mixed with varying concentrations of FeCl₃ (0-200 μM), equilibrated for 3 min at room temperature, and emission spectra recorded at 360 nm excitation. The Stern-Volmer plot of F₀/F versus [Fe³⁺] was constructed from the 445 nm emission peak. Selectivity was tested by adding each competing metal ion at 100 μM to the N-CD solution and measuring the quenching response [14] .
Quality control
All fluorescence measurements were performed in triplicate and averaged. LOD was calculated as 3σ/slope from 10 blank measurements. Real water samples (tap water from Sapporo municipal supply and lake water from Onuma Quasi-National Park) were filtered through 0.22 μm PVDF membranes before spiking. Recovery experiments used three Fe³⁺ concentrations (10, 50, 100 μM) with results verified against ICP-OES (Shimadzu ICPE-9820). Photostability was assessed under continuous 365 nm UV lamp illumination (6 W) for 2 hours with fluorescence measured every 15 minutes [15] . -18.3 mV TEM images showed well-dispersed, quasi-spherical particles with a narrow size distribution (3.8 ± 0.7 nm). Lattice fringes with a dspacing of 0.21 nm were visible in high-resolution images, corresponding to the (100) plane of graphitic carbon and confirming a crystalline core structure. XPS survey scans detected three elements: carbon (58.3 at%), nitrogen (14.8 at%), and oxygen (26.9 at%). High-resolution N 1s deconvolution revealed three nitrogen environments: pyridinic N at 398.7 eV (32.4%), amino N at 399.8 eV (41.7%), and pyrrolic N at 400.9 eV (25.9%). The high nitrogen content compared to typical undoped CDs (<2 at%) confirms successful incorporation of ethylenediamine-derived nitrogen into the carbon framework [6] .
Results
FTIR spectra showed broad O-H/N-H stretching at 3100-3500 cm⁻¹, C=O stretching at 1710 cm⁻¹, amide C=O at 1640 cm⁻¹, and C-N stretching at 1390 cm⁻¹. These functional groups provide both water solubility and metal coordination sites on the N-CD surface. The quantum yield of 47.3% is among the highest reported for hydrothermal N-CDs and reflects the combined emission contributions from molecular fluorophores (citrazinic acid derivatives formed during synthesis) and surface-state emission from nitrogencontaining functional groups [16] . The Stern-Volmer plot showed excellent linearity from 0.5 to 100 μM Fe³⁺, with upward curvature above 100 μM indicating a transition from predominantly static quenching to combined static and dynamic mechanisms at higher concentrations. The Kₛᵥ of 3.37 × 10³ M⁻¹ indicates strong binding between Fe³⁺ and the N-CD surface. Fluorescence lifetime measurements supported the static quenching assignment: the biexponential lifetime (components of 3.12 ns and 10.87 ns, weighted average 8.74 ns) remained essentially unchanged (≤1.5% variation) upon addition of Fe³⁺ up to 100 μM, ruling out dynamic quenching as the primary mechanism [9] . . Real water validation confirmed practical applicability. Spiked tap water recoveries were 98.7%, 101.3%, and 96.4% at 10, 50, and 100 μM Fe³⁺, respectively. Lake water recoveries ranged from 97.2% to 104.1%, with slightly higher variability attributed to the dissolved organic matter content of the lake matrix. All results agreed within 5% of ICP-OES reference values. Photostability was excellent: fluorescence intensity decreased by only 2.7% after 2 hours of continuous UV exposure at 365 nm, compared to 15-25% decay reported for many organic fluorophores under similar conditions [17] .
Discussion
The 47.3% quantum yield achieved here compares favorably with the 30-60% range reported for citric acidethylenediamine N-CDs in the literature, placing this preparation in the upper tier [6]. The key synthesis variable was reaction time: 5 hours at 200 °C gave the highest QY, while shorter durations (2-3 h) produced incompletely carbonized products with lower fluorescence, and longer times (8 h) led to over-carbonization that red-shifted emission and reduced intensity. Temperature was equally important -180 °C yielded only 28.4% QY, while 220 °C caused excessive graphitization [12] . The static quenching mechanism, confirmed by unchanged fluorescence lifetimes, implies ground-state complex formation between Fe³⁺ and surface functional groups on the N-CDs. XPS after Fe³⁺ exposure showed new Fe 2p peaks and shifts in the N 1s pyridinic component, supporting direct Fe-N coordination. The Stern-Volmer constant (3.37 × 10³ M⁻¹) is an order of magnitude higher than reported for undoped CDs with Fe³⁺ (~200-400 M⁻¹), confirming that nitrogen doping creates higher-affinity binding sites for the iron [10]. IFE likely contributes a secondary role, since Fe³⁺'s absorption tail extends through the 360 nm excitation wavelength used here, but lifetime invariance proves it is not the dominant pathway. The 0.34 μM detection limit (19 μg/L) sits well below the typical drinking water standard of 300 μg/L, providing more than 15-fold safety margin for regulatory compliance monitoring. For clinical applications where iron levels in serum reach 10-30 μM normally and exceed 50 μM in overload conditions, the 0.5-100 μM linear range covers the entire diagnostic window without dilution [1] . The sub-3minute response time is fast enough for point-of-care deployment, and the visual color change from blue to colorless under UV light could enable semi-quantitative field testing without instrumentation [18] . One limitation is the moderate Cu²⁺ cross-reactivity (F₀/F = 1.42 at 100 μM), which could cause overestimation of Fe³⁺ in samples with very high copper content. Masking agents like thiourea, which complexes Cu²⁺ without affecting Fe³⁺, could be incorporated into the assay protocol for highcopper matrices [19] . Storage stability at 4 °C for 6 months with less than 4% QY loss suggests the N-CDs could be distributed as ready-to-use solutions in clinical or environmental testing kits without cold-chain requirements beyond standard refrigeration [20] .
Conclusion
Nitrogen-doped carbon dots synthesized hydrothermally from citric acid and ethylenediamine achieved a 47.3% quantum yield and served as a selective, sensitive fluorescent probe for Fe³⁺ detection. The sensor operated through a static quenching mechanism with a linear range of 0.5-100 μM, a detection limit of 0.34 μM, and outstanding selectivity over 14 competing metal ions. Validation in spiked tap and lake water confirmed practical accuracy (96.4-104.1% recovery). The combination of simple one-pot synthesis, excellent photostability, and sub-3-minute response time positions these N-CDs as viable candidates for both environmental water monitoring and clinical iron assessment. Integration with smartphone-based detection platforms for true point-of-use testing is the logical extension of this work.
Figures and tables from the paper
| Property | Value |
|---|---|
| Mean diameter (TEM) | 3.8 ± 0.7 nm |
| Excitation maximum | 360 nm |
| Emission maximum | 445 nm |
| Quantum yield | 47.3% |
| N content (XPS) | 14.8 at% |
| C:N:O ratio | 58.3: 14.8: 26.9 |
| Fluorescence lifetime | 8.74 ns (biexponential) |
| Zeta potential (pH 7) | −18.3 mV |
Table text extracted from the original PDF; superscript letters are shown inline. The original table image is below.
View original table image
| Parameter | Value |
|---|---|
| Kₛᵥ | 3.37 × 10³ M⁻¹ |
| Linear range | 0.5-100 μM |
| R² | 0.9991 |
| LOD | 0.34 μM (19 μg/L) |
| LOQ | 1.13 μM (63 μg/L) |
| Response time | < 3 min |
Table text extracted from the original PDF; superscript letters are shown inline. The original table image is below.
View original table image
References
20 in the original paper- Hentze MW, Muckenthaler MU, Galy B, Camaschella C. Two to tango: regulation of mammalian iron metabolism. Cell. 2010;142(1):24-38.
- WHO. Guidelines for Drinking-water Quality. 4th ed. World Health Organization. 2011.
- Ingle JD Jr, Crouch SR. Spectrochemical Analysis. Prentice Hall. 1988.
- Wei H, Wang E. Nanomaterials with enzyme-like characteristics (nanozymes). Chem Soc Rev. 2013;42(14):6060-6093.
- Xu X, Ray R, Gu Y, Ploehn HJ, Gearheart L. Electrophoretic analysis and purification of fluorescent single-walled carbon nanotube fragments. J Am Chem Soc. 2004;126(40):12736-12737.
- Zhu S, Meng Q, Wang L, Zhang J, Song Y. Highly photoluminescent carbon dots for multicolor patterning. Angew Chem Int Ed. 2013;52(14):3953-3957.
- Shi W, Li X, Ma H. A tunable ratiometric pH sensor based on carbon nanodots. Angew Chem Int Ed. 2012;51(26):6432-6435.
- Qu S, Wang X, Lu Q, Liu X, Wang L. A biocompatible fluorescent ink based on water-soluble luminescent carbon nanodots. Angew Chem Int Ed. 2012;51(49):12215-12218.
- Lakowicz JR. Principles of Fluorescence Spectroscopy. 3rd ed. Springer. 2006.
- Guo Y, Wang Z, Shao H, Jiang X. Hydrothermal synthesis of highly fluorescent carbon nanoparticles. Carbon. 2013;52:583-589.
- Baker SN, Baker GA. Luminescent carbon nanodots: emergent nanolights. Angew Chem Int Ed. 2010;49(38):6726-6744.
- Dong Y, Shao J, Chen C, Li H, Wang R. Blue luminescent graphene quantum dots and graphene oxide. Carbon. 2012;50(12):4738-4743.
- Brouwer AM. Standards for photoluminescence quantum yield measurements in solution. Pure Appl Chem. 2011;83(12):2213-2228.
- Qu S, Chen H, Zheng X, Cao J, Liu X. Ratiometric fluorescent nanosensor for Fe³⁺ detection. Nanoscale. 2013;5(12):5514-5518.
- Currie LA. Nomenclature in evaluation of analytical methods. Pure Appl Chem. 1995;67(10):1699-1723.
- Schneider J, Reckmeier CJ, Xiong Y, von Seckendorff M, Susha AS. Molecular fluorescence in citric acidbased carbon dots. J Phys Chem C. 2017;121(3):20142022.
- Li H, Kang Z, Liu Y, Lee ST. Carbon nanodots: synthesis, properties and applications. J Mater Chem. 2012;22(46):24230-24253.
- Sun YP, Zhou B, Lin Y, Wang W, Fernando KA. Quantum-sized carbon dots for bright and colorful photoluminescence. J Am Chem Soc. 2006;128(24):7756-7757.
- Liu S, Tian J, Wang L, Zhang Y, Qin X. Hydrothermal treatment of grass: a green carbon source for International Journal of Advanced Chemistry Research https://www.chemistryjournals.net photoluminescent nanobelts. Adv Mater. 2012;24(15):2037-2041.
- Wang Y, Hu A. Carbon quantum dots: synthesis, properties and applications. J Mater Chem C. 2014;2(34):6921-6939.