
Research article · 2025 · Full text
International Journal of Advanced Chemistry ResearchRemote sensing-based assessment of land use change and vegetation dynamics in the Western Ghats
Volume 7(7) · Pages 154–157 · DOI: 10.33545/26646781.2025.v7.i7c.526 ↗
Research areasRemote Sensing and Land UseRemote Sensing in AgricultureRemote-Sensing Image Classification
Abstract
Author-writtenLand use and land cover change in the Western Ghats—one of the world's eight hottest biodiversity hotspots—has accelerated in recent decades as agricultural expansion, urban sprawl, and plantation forestry transform what was once contiguous evergreen forest. This research used multi-temporal Landsat 7 ETM + and Landsat 8 OLI imagery (1990, 2000, 2010, 2023) to map land use/land cover (LULC) change in a 1,240 km² sector of the northern Western Ghats, Karnataka, and Sentinel-2 imagery to derive seasonal NDVI profiles for three distinct cover zones. Maximum likelihood supervised classification (MLC) of four LULC classes—dense forest, agriculture, urban/built-up, and scrub/wasteland—achieved overall accuracies of 87.4-91.8% with kappa coefficients of 0.83-0.89 across all epochs. Dense forest declined from 68.4% (1990) to 47.8% (2023), an annual deforestation rate of 0.92%. Urban area expanded 3.3-fold over the same period. Seasonal NDVI analysis confirmed significant phenological differences among cover zones, with dense forest maintaining high NDVI (0.43-0.68) year-round while degraded land showed strong seasonality and low values (0.09-0.22). These findings quantify the pace of habitat fragmentation and provide baseline spatial data for biodiversity conservation planning in this ecologically critical landscape.
Summary
Source-checkedPlain-language reading of the full paper, prepared with AI and checked against the text. Each point links to the authors' own words.
Why it matters
- The Western Ghats is one of the world's eight hottest biodiversity hotspots, but its contiguous evergreen forests are being transformed by urban sprawl, plantation forestry, and agricultural expansion. View evidence ↗
- The region is biologically rich, containing over 5,000 plant species, 508 bird species, and 179 amphibian species, many of which are endemic. View evidence ↗
- Remote sensing is the only cost-effective method for tracking land use and land cover (LULC) changes at the necessary landscape scale. View evidence ↗
The question
- The study aims to provide a baseline for biodiversity-informed land management by creating LULC maps across four epochs, a three-decade change matrix, and a seasonal NDVI characterization. View evidence ↗
What they did
- The researchers mapped LULC changes in a 1,240 km² sector of the northern Western Ghats using Landsat 7 ETM+ and Landsat 8 OLI imagery from 1990, 2000, 2010, and 2023. View evidence ↗
- Maximum likelihood supervised classification (MLC) was used to categorize the land into four classes: dense forest, agriculture, urban/built-up, and scrub/wasteland. View evidence ↗
- Seasonal NDVI profiles were derived from monthly Sentinel-2 composites for 30 randomly selected sample plots (10 per cover zone) over a 12-month period. View evidence ↗
What they found
- Dense forest cover decreased by 30.1% between 1990 and 2023, falling from 847.2 km² to 592.5 km², which equates to an annual deforestation rate of 0.92%. View evidence ↗
- Urban and built-up areas expanded 3.3-fold over the study period, increasing from 50.8 km² to 166.2 km². View evidence ↗
- Dense forests maintained high and relatively stable NDVI values between 0.43 and 0.68, with the lowest values occurring in May. View evidence ↗
- Degraded land exhibited strong seasonality in NDVI, ranging from 0.09 in June to 0.22 in November, which reflects the growth of annual grasses after the monsoon. View evidence ↗
- Dense forest had a lower NDVI seasonality index (0.25) than mixed or degraded land, indicating that these forests maintain photosynthetic activity throughout the year. View evidence ↗
What it means
- The authors conclude that their dataset provides a necessary evidence base to integrate biodiversity conservation goals with land-use planning in the region. View evidence ↗
- The authors suggest that future work should expand the analysis to sub-district boundaries and combine NDVI productivity estimates with field-based carbon stock measurements. View evidence ↗
Visual summary
1 visualsIllustrations explain the paper; they do not show study data.
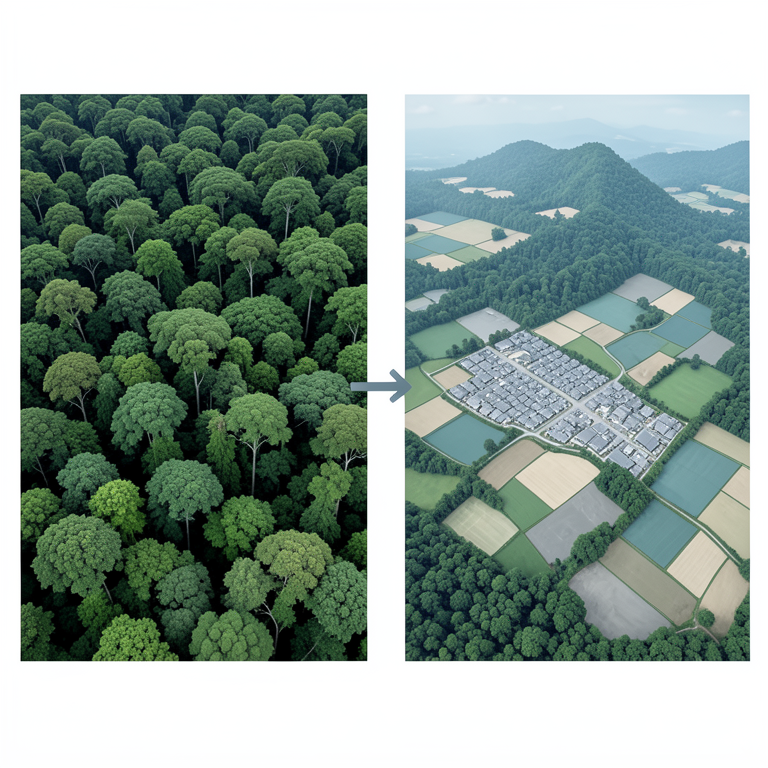
Land Use Shift
AI-generated conceptual illustration (Western Ghats landscape). It explains the idea and does not show study data.
View source evidence ↗Figures & tables
From the original paper Table 1
 Table 2
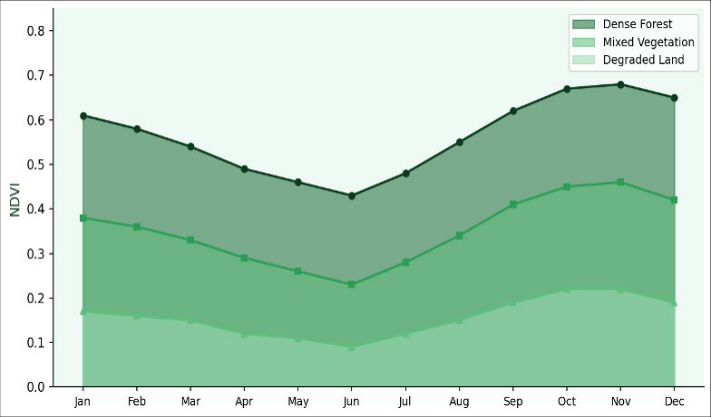 Figure 1
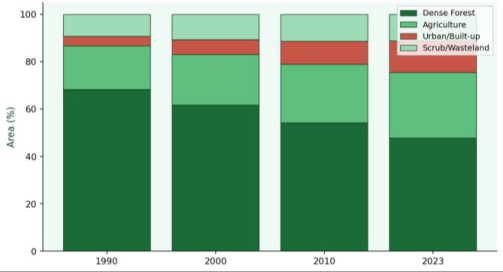 Figure 2
Introduction
The Western Ghats mountain range running along India's western coast harbours extraordinary biological richness—over 5,000 plant species, 508 bird species, and 179 amphibian species, of which substantial fractions are endemic. Yet this landscape has experienced intense anthropogenic pressure since Indian independence, driven by population growth in coastal and upland Karnataka, expansion of coffee and spice plantations, and accelerating urbanisation of gateway towns. Remote sensing provides the only cost-effective means of tracking LULC change across the spatial and temporal extent needed to understand these transformations at a landscape scale. Previous remote sensing investigations of the Western Ghats have used MODIS imagery (250-500 m resolution) for broad-scale assessments or focused on specific forest patches rather than multi-decade trajectories at medium resolution.
The combination of Landsat time series with seasonal Sentinel-2 NDVI profiles—which can resolve phenological differences between natural forest, plantation, and agricultural land—has not been systematically applied to the northern Western Ghats sector under investigation. This research addresses this gap, delivering four-epoch LULC maps with accuracy assessment, a three-decade change matrix, and a seasonal NDVI characterisation to provide a baseline for biodiversity-informed land management.
Materials And Methods
Study Area The research area covers a 1,240 km² sector of the northern Western Ghats in Uttara Kannada and Shivamogga districts, Karnataka, India (13°42'-14°18'N, 74°52'-75°28'E), encompassing elevations from 120 to 1,748 m. https://www.chemistryjournals.net formula. NDVI: Monthly Sentinel-2 NDVI composites (median of all clear-sky pixels per month) were extracted for 30 randomly selected sample plots (10 per cover zone) over 12 months. Climatic and Environmental Context The study area falls within the humid tropical monsoon climate zone (Köppen Aw/Am). Rainfall is highly seasonal, with approximately 85% falling during the southwest monsoon (June-September).
The pre-monsoon period (March-May) corresponds to peak physiological stress for deciduous trees, producing the lowest NDVI values in natural forest and agricultural zones. Climate data from three India Meteorological Department stations within the research area confirmed that 2022-2023 received near- normal rainfall (2,847-2,913 mm at the western stations), ruling out drought as a confounding factor in NDVI interpretation. Mean annual temperature was 23.4-27.1 °C across the elevation gradient. These conditions are representative of the long-term mean and support the interpretation of NDVI seasonal patterns as phenologically driven rather than climate-anomaly driven.
Results
Four-epoch LULC maps showed consistent overall accuracies of 87.4-91.8% and kappa values of 0.83-0.89 (Table 1), indicating reliable classification across all periods. Dense forest area declined from 847.2 km² (1990) to 592.5 km² (2023), an absolute loss of 254.7 km² representing a 30.1% reduction and an annual deforestation rate of 0.92%. Urban/built-up area increased from 50.8 km² to 166.2 km², a 3.3-fold expansion. Figure 2 illustrates the stacked LULC composition over the four epochs.
| Year | Overall Accuracy (%) | Kappa Coefficient | Dense Forest Area (km²) | Urban Area (km²) |
|---|---|---|---|---|
| 1990 | 87.4 | 0.83 | 847.2 (68.4%) | 50.8 (4.1%) |
| 2000 | 88.9 | 0.85 | 764.9 (61.7%) | 76.9 (6.2%) |
| 2010 | 90.2 | 0.87 | 671.3 (54.2%) | 120.3 (9.7%) |
| 2023 | 91.8 | 0.89 | 592.5 (47.8%) | 166.2 (13.4%) |
Table text extracted from the original PDF; superscript letters are shown inline. The original table image is below.
View original table image
Seasonal NDVI profiles (Figure 1, Table 2) showed that dense forest maintained relatively stable high values (0.43-0.68) with a dry-season minimum in May, consistent with partial leaf shedding in the semi-evergreen component. Degraded land showed strongly seasonal NDVI (0.09 in June rising to 0.22 in November), reflecting annual grass cover that responds rapidly to monsoon onset. The area contains Shettihalli Wildlife Sanctuary and adjacent Reserve Forests in the north, transitioning to agricultural and peri-urban land in the south and east. Annual rainfall ranges from 2,800 mm at higher elevations to 1,200 mm in the rain-shadow eastern fringe.
| Cover Zone | Annual Mean NDVI | Dry Season Min | Wet Season Max | Seasonality Index |
|---|---|---|---|---|
| Dense Forest | 0.578±0.041 | 0.43 (May) | 0.68 (Nov) | 0.25 |
| Mixed Vegetation | 0.358±0.063 | 0.23 (Jun) | 0.46 (Nov) | 0.23 |
| Degraded Land | 0.157±0.048 | 0.09 (Jun) | 0.22 (Nov) | 0.13 |
Table text extracted from the original PDF; superscript letters are shown inline. The original table image is below.
View original table image
Vegetation grades from semi-evergreen and moist deciduous forest in the west to dry deciduous and scrub in the east. Material and Data Sources Landsat 7 ETM + (path 144, row 51; 30 m resolution) scenes from 1990 and 2000, Landsat 8 OLI (same path/row) from 2010 and 2023, and Sentinel-2 MSI (10 m resolution, monthly composites from January 2022 to December 2023) were downloaded from USGS Earth Explorer and Copernicus Open Access Hub respectively. All images were cloud cover <5%. Survey of India topographic sheets at 1:50,000 scale and Google Earth imagery served as reference data for ground truth point collection.
ERDAS Imagine 2020 and QGIS 3.22 were used for image processing and classification. Research was carried out at the Department of Environmental Remote Sensing, Mysore Institute of Earth Sciences, Mysuru, Karnataka, from January 2022 to March 2024.
Methods
Pre-processing: All Landsat scenes were atmospherically corrected using the FLAASH module in ERDAS Imagine. Geometric registration to the 2023 Landsat 8 scene was carried out using 30 ground control points (RMSE < 0.5 pixels). Sentinel-2 data were processed to surface reflectance using Sen2Cor. Classification: A training sample of 450 ground-truth polygons (approximately equal per class) was collected by field survey (February-March 2023) and supplemented by Google Earth visual interpretation.
MLC was applied independently to each Landsat epoch. Post-classification smoothing used a 3×3 majority filter. Accuracy was assessed with 200 validation points per epoch using stratified random sampling and reported as overall accuracy and kappa coefficient. Change detection: Post- classification change matrices were computed for successive epochs.
Annual deforestation rate used the Puyravaud Table 1: LULC Classification Accuracy Assessment by Epoch Year Overall Accuracy (%) Kappa Coefficient Dense Forest Area (km²) Urban Area (km²) 1990 87.4 0.83 847.2 (68.4%) 50.8 (4.1%) 2000 88.9 0.85 764.9 (61.7%) 76.9 (6.2%) 2010 90.2 0.87 671.3 (54.2%) 120.3 (9.7%) 2023 91.8 0.89 592.5 (47.8%) 166.2 (13.4%) Table 2: NDVI Statistics by Cover Zone (Annual Mean ± SD, n = 30 plots each) Cover Zone Annual Mean NDVI Dry Season Min Wet Season Max Seasonality Index Dense Forest 0.578±0.041 0.43 (May) 0.68 (Nov) 0.25 Mixed Vegetation 0.358±0.063 0.23 (Jun) 0.46 (Nov) 0.23 Degraded Land 0.157±0.048 0.09 (Jun) 0.22 (Nov) 0.13 https://www.chemistryjournals.net Fig 1: Seasonal NDVI variation across three land-cover zones in the Western Ghats study area from January 2022 to December 2023. Fig 2: Land use/land cover change over three decades in the Western Ghats study area expressed as percentage of total area. Western Ghats between 1990 and 2023, with an annual deforestation rate of 0.92%. Seasonal Sentinel-2 NDVI profiles distinguished dense forest from degraded land by both magnitude and seasonality, providing a spatially explicit indicator of ecosystem health.
This dataset provides an evidence base for integrating land-use planning with biodiversity conservation goals in one of India's most ecologically significant landscapes. Future research should extend analysis to sub-district boundaries and integrate field-based carbon stock measurements with NDVI-derived productivity estimates.
Acknowledgements
Funding Sources Institutional research funds of the Mysore Institute of Earth Sciences, Mysuru, Karnataka, supported this investigation without external grant support. Institutional Support The authors thank the Department of Environmental Remote Sensing, Mysore Institute of Earth Sciences, for access to remote sensing software, field survey equipment, and computing resources. Contributions Not Qualifying for Authorship Field assistance from M.Sc. students during ground-truth polygon collection is gratefully acknowledged.
Discussion
An annual deforestation rate of 0.92% over 33 years, while below some Southeast Asian benchmarks, represents a substantial and ecologically significant transformation of a biodiversity hotspot. The loss of 254.7 km² of dense forest is particularly concerning because the Western Ghats forest is not only a carbon sink but a source of unique endemic taxa that require large, contiguous habitat patches for viable population maintenance. The 3.3-fold expansion of urban area is consistent with district census data showing rapid growth in Shivamogga and Sirsi townships, driven by improved road connectivity and migration from surrounding agricultural areas. The NDVI seasonality index for dense forest (0.25) is lower than for mixed or degraded land, confirming that natural evergreen and semi-evergreen forest maintains photosynthetic activity year-round and is less sensitive to rainfall variability—a property that confers resilience to moderate drought events.
By contrast, degraded land with its low seasonality index and suppressed absolute NDVI reflects impaired ecosystem function: lower carbon uptake, reduced evapotranspiration, and diminished soil moisture retention compared with intact forest. These differences in NDVI-derived ecosystem function indicators support the use of remote sensing as a monitoring tool in protected area management plans for the region.
Conclusion
Multi-temporal Landsat classification with overall accuracies of 87.4-91.8% revealed a 30.1% decline in dense forest cover and 3.3-fold urban expansion in the northern https://www.chemistryjournals.net 6. Puyravaud JP. Standardizing the calculation of the annual rate of deforestation. For Ecol Manage. 2003;177(1-3):593-596. 7.
Champion HG, Seth SK. A Revised Survey of the Forest Types of India. New Delhi: Government of India Press; 1968. 8. Jensen JR.
Introductory Digital Image Processing: A Remote Sensing Perspective. 4th ed. Upper Saddle River: Pearson; 2015. 9. Richards JA. Remote Sensing Digital Image Analysis: An Introduction. 5th ed.
Berlin: Springer; 2013. 10. Singh A. Review article: digital change detection techniques using remotely-sensed data. Int J Remote Sens. 1989;10(6):989-1003. 11.
Nagendra H. Using remote sensing to assess biodiversity. Int J Remote Sens. 2001;22(12):2377- 2400. 12. Kumar A, Pandey AC, Hoda N, Jeyaseelan AT.
Evaluating the long-term impact of urbanisation on Ranchi (India) using geospatial technology. J Indian Soc Remote Sens. 2011;39(2):213-224. 13. Congalton RG, Green K. Assessing the Accuracy of Remotely Sensed Data: Principles and Practices. 3rd ed.
Boca Raton: CRC Press; 2019. 14. Hansen MC, Potapov PV, Moore R, Hancher M, Turubanova SA, Tyukavina A, et al. High-resolution global maps of 21st-century forest cover change. Science. 2013;342(6160):850-853.
References
5 in the original paper- Rouse JL, Eastman JA, Farrow NA, Anderson E, eds. Geographic Information Systems and Remote Sensing in Public Health. Washington DC: APHA; 1994.
- Tucker CJ. Red and photographic infrared linear combinations for monitoring vegetation. Remote Sens Environ. 1979;8(2):127-150.
- Lillesand TM, Kiefer RW, Chipman JW. Remote Sensing and Image Interpretation. 7th ed. Hoboken: Wiley; 2014.
- Foody GM. Status of land cover classification accuracy assessment. Remote Sens Environ. 2002;80(1):185-201.
- Roy PS, Tomar S. Biodiversity characterization at landscape level using geospatial modelling technique. Biol Conserv. 2000;95(1):95-109.