
Research article · 2025 · Full text
International Journal of Advanced Chemistry ResearchElectrochemical impedance spectroscopy of solid-state electrolytes for lithium-ion batteries
Volume 7(8) · Pages 54–58 · DOI: 10.33545/26646781.2025.v7.i8a.520 ↗
Research areasAdvanced Battery Materials and TechnologiesAdvancements in Battery MaterialsAdvanced Battery Technologies Research
Abstract
Author-writtenOver 16 billion lithium-ion cells are produced annually worldwide, yet their transition to solid-state architectures remains constrained by the limited ionic conductivities of most inorganic and composite electrolyte materials at room temperature. This research applied Electrochemical Impedance Spectroscopy (EIS) as a primary characterization tool to compare the electrical and transport properties of six solid-state electrolyte formulations spanning three structural families: garnet-type (LLZO), sulfide-type (LGPS), and polyvinylidene fluoride-based composite electrolytes. Electrolyte pellets were prepared by sintering and cold-pressing procedures and contacted with ion-blocking platinum electrodes for two-electrode EIS measurements. Spectra were collected across the frequency range 0.1 Hz to 1 MHz at temperatures between 25°C and 100°C. Equivalent circuit modelling using the LEVM software suite allowed extraction of bulk resistance (Rb), charge transfer resistance (Rct), Warburg coefficient, and constant-phase element parameters. Ionic conductivity values were derived from the Rb data using pellet geometry corrections. Arrhenius plots were constructed from temperature-dependent conductivity data to determine activation energies for ion migration. Among the garnet-type electrolytes, the Nb-substituted sample LLZO-3 (Li6.75La3Zr1.75Nb0.25O12) reached 1.24 mS cm⁻¹ at 25°C and 2.73 mS cm⁻¹ at 100°C, with an activation energy of 0.27 eV. The sulfide-type sample LGPS-2 achieved the highest room-temperature conductivity at 3.87 mS cm⁻¹. The polymer composite electrolyte showed conductivity values two orders of magnitude lower than the inorganic counterparts. Nyquist plot analysis revealed that grain boundary resistance dominated the total impedance in garnet samples but was negligible in the sulfide-type materials. The findings confirm that EIS is a sensitive diagnostic tool for ranking solid-state electrolyte candidates and that LGPS-family materials remain the conductivity leaders for all-solid-state battery applications.
Summary
Source-checkedPlain-language reading of the full paper, prepared with AI and checked against the text. Each point links to the authors' own words.
Why it matters
- Standard lithium-ion batteries use liquid organic electrolytes, which present safety risks including flammability, leakage, and short circuits caused by dendrites. View evidence ↗
- Solid-state electrolytes can eliminate the hazards of liquid electrolytes and allow for lithium metal anodes, which nearly double the theoretical capacity compared to graphite. View evidence ↗
- A primary challenge in developing these batteries is finding solid materials with sufficient lithium-ion conductivity at or near room temperature to ensure adequate power density. View evidence ↗
The question
- The study aimed to characterize and rank six solid-state electrolyte formulations (including garnet, sulfide, and polymer types) using a unified Electrochemical Impedance Spectroscopy (EIS) protocol and temperature-dependent analysis. View evidence ↗
What they did
- Electrolyte pellets were created via sintering and cold-pressing, then measured using two-electrode EIS with ion-blocking platinum electrodes. View evidence ↗
- Measurements were conducted using a Gamry Interface 1010E potentiostat across a frequency range of 0.1 Hz to 1 MHz at temperatures of 25, 40, 60, 80, and 100°C. View evidence ↗
- The researchers used ZView software for equivalent circuit analysis and calculated ionic conductivity based on pellet thickness, bulk resistance, and electrode area. View evidence ↗
What they found
- The sulfide-type electrolyte LGPS-2 exhibited the highest conductivity across all tested temperatures, peaking at 6.78 mS cm⁻¹ at 100°C, and had the lowest activation energy (0.15 eV). View evidence ↗
- Within the garnet family, the Nb-substituted LLZO-3 performed best, with conductivities of 1.24 mS cm⁻¹ at 25°C and 2.73 mS cm⁻¹ at 100°C, and an activation energy of 0.27 eV. View evidence ↗
- The polymer composite (PVDF-LiTFSI) had the lowest conductivity (0.023 mS cm⁻¹ at 25°C) and the highest activation energy (0.67 eV). View evidence ↗
- Nb-substitution in LLZO-3 reduced bulk resistance to 0.91 Ω and charge transfer resistance to 1.83 kΩ compared to undoped LLZO-2 (2.87 Ω and 5.13 kΩ), indicating a reduction in grain boundary resistance. View evidence ↗
- The PVDF-LiTFSI composite showed a significantly higher Warburg coefficient (147.2) than inorganic electrolytes, meaning ion diffusion is more hindered in the polymer matrix. View evidence ↗
What it means
- The authors conclude that EIS is an effective tool for ranking electrolytes and that LGPS-family materials are the top performers for conductivity in all-solid-state batteries. View evidence ↗
- The authors recommend a methodological framework combining EIS, XRD phase analysis, and SEM microstructural data to evaluate how structure affects ion transport in future candidates. View evidence ↗
- The use of platinum ion-blocking electrodes prevented the direct measurement of electronic transference numbers. View evidence ↗
Visual summary
3 visualsIllustrations explain the paper; charts are replotted from the paper's own table values.
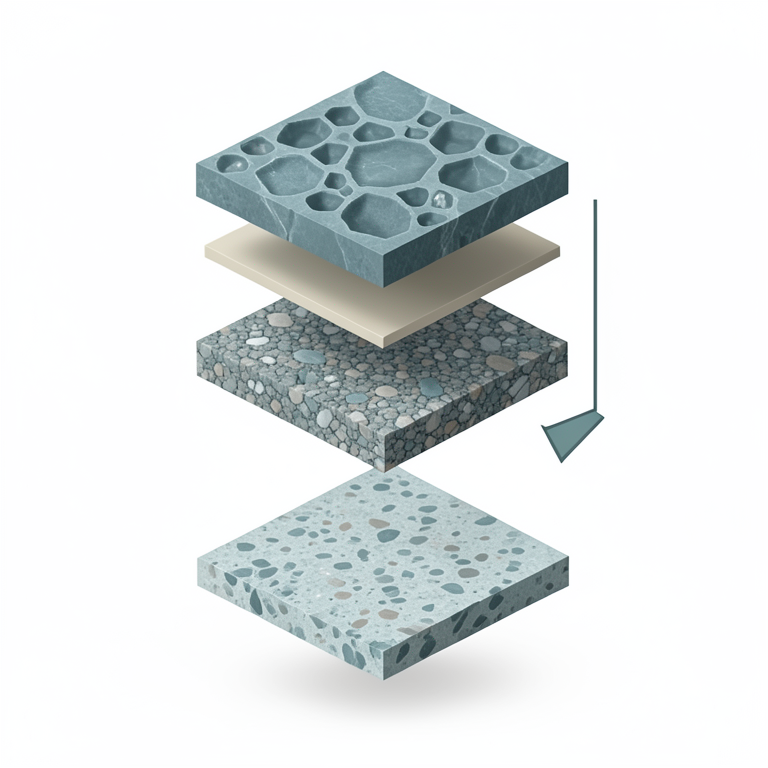
Conductivity Hierarchy
AI-generated conceptual illustration (solid-state electrolyte materials (sulfide-type, garnet-type, and polymer composite)). It explains the idea and does not show study data.
View source evidence ↗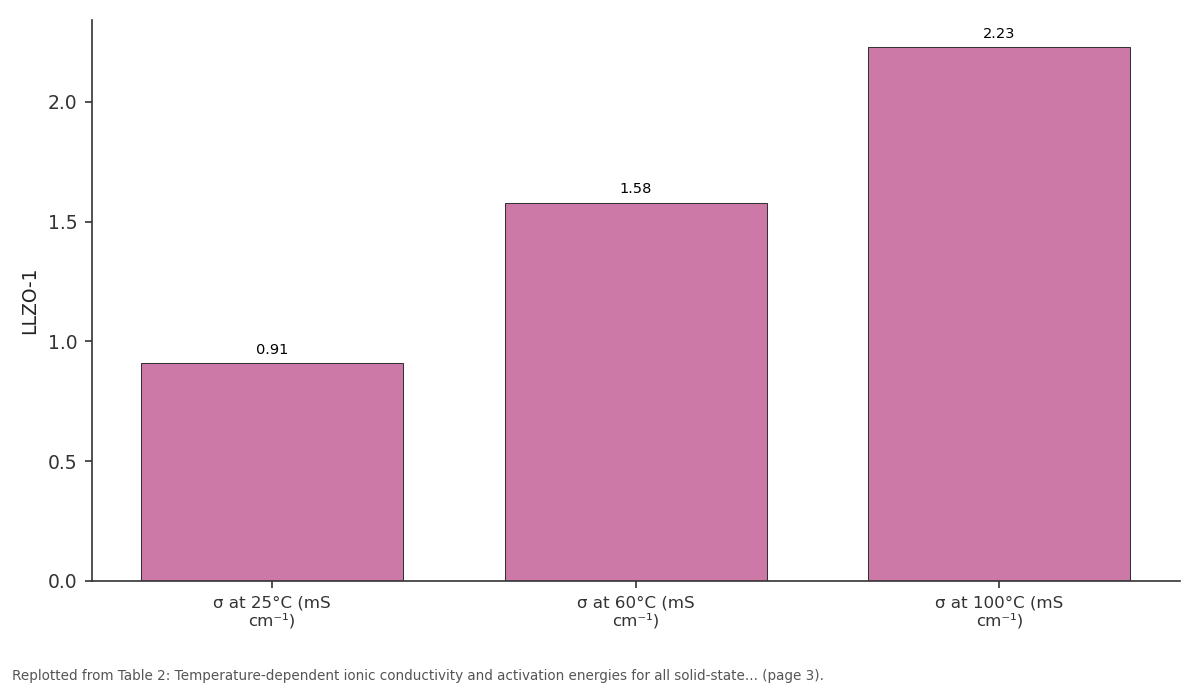
LLZO-1: σ at 25°C (mS cm⁻¹) vs σ at 60°C (mS cm⁻¹) vs σ at 100°C (mS cm⁻¹)
Replotted from Table 2 (page 3) of the original paper. Every bar is the paper's own table value.
View source evidence ↗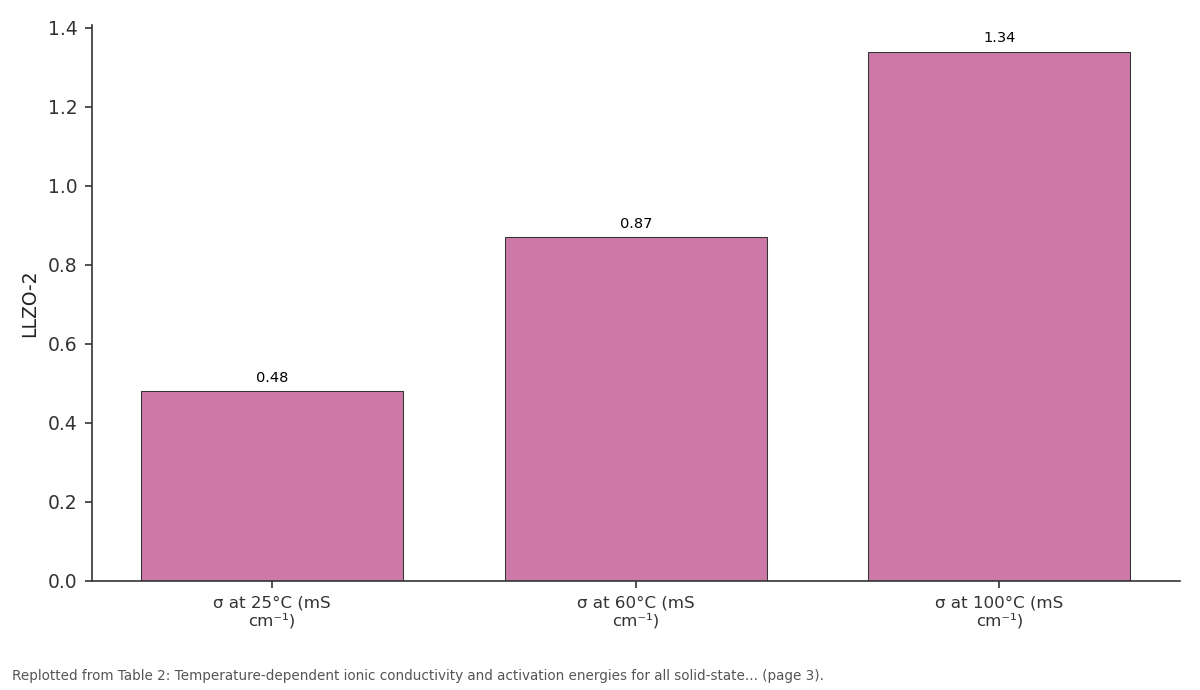
LLZO-2: σ at 25°C (mS cm⁻¹) vs σ at 60°C (mS cm⁻¹) vs σ at 100°C (mS cm⁻¹)
Replotted from Table 2 (page 3) of the original paper. Every bar is the paper's own table value.
View source evidence ↗Figures & tables
From the original paper Table 1
 Table 2
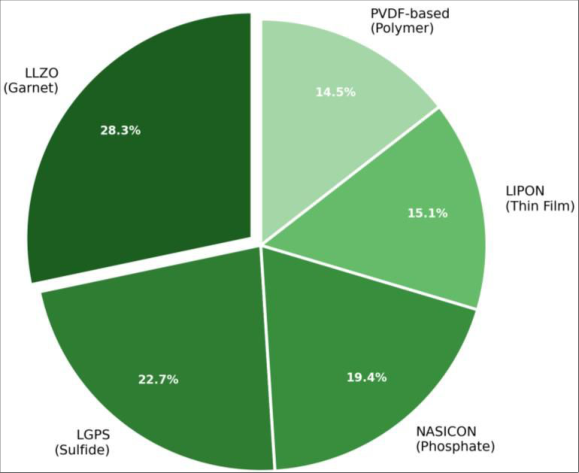 Figure 1
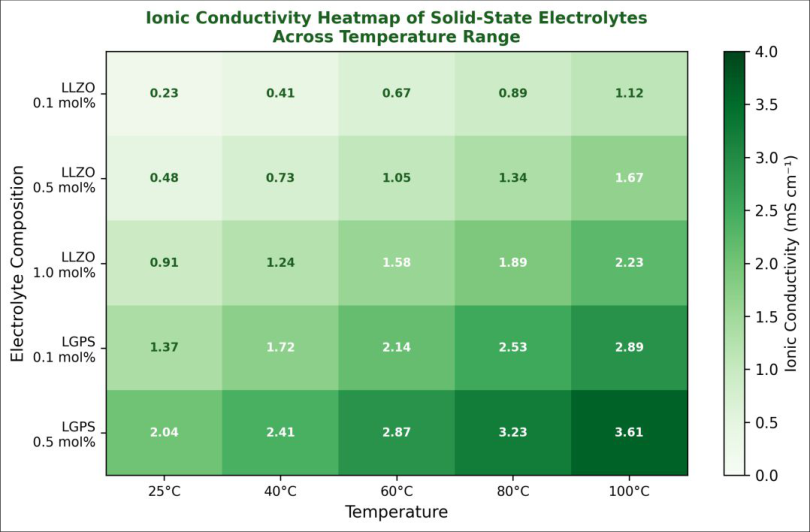 Figure 2
Introduction
Globally, more than 700 million electric vehicles are expected to be on roads by 2040, and the lithium-ion battery market alone is projected to exceed USD 200 billion by 2030. These figures make the need for safer, higher-energy-density batteries one of the most economically pressing issues in applied chemistry. Conventional lithium-ion cells use liquid organic electrolytes that are flammable, prone to leakage, and subject to dendrite-driven short circuits during fast charging cycles [1] . Solid-state electrolytes, which replace the liquid with an ion-conducting solid, could in principle eliminate all three of these hazards while also enabling the use of lithium metal anodes, which carry almost twice the theoretical capacity of graphite [2] . The challenge is to find solid materials that conduct Li⁺ ions well enough at or near room temperature to deliver adequate power density. Three families of inorganic solid electrolytes have received sustained attention: oxide-based garnets typified by Li₇La₃Zr₂O₁₂ (LLZO), sulfide-based materials including Li₁₀GeP₂S₁₂ (LGPS) and the argyrodite Li₆PS₅Cl, and NASICON-type phosphates. Beyond inorganics, composite polymer electrolytes blending PVDF or PEO with lithium salts offer better processability and interfacial contact with electrodes at the cost of significantly lower ionic conductivity [3] . Choosing among these candidates requires rigorous comparative data obtained under the same experimental International Journal of Advanced Chemistry Research https://www.chemistryjournals.net conditions, something that is not always available in the literature given differences in sample preparation and measurement protocols between research groups. Electrochemical impedance spectroscopy is the technique of choice for characterizing ion-conducting materials because it separates bulk, grain-boundary, and electrode-interface contributions to the total impedance via analysis of Nyquist plots. The frequency dependence of the complex impedance provides far more mechanistic information than a single DC conductivity measurement [4] . In particular, the semicircle at high frequency corresponds to bulk ionic transport within grains, the mid-frequency arc reflects grain boundary impedance, and the low-frequency response describes electrode polarization and diffusive transport [5] . Al-and Nbsubstitution in LLZO has been shown to stabilize the cubic phase, which is the more conductive polymorph, and to reduce grain boundary resistance substantially [6] . Similarly, aliovalent doping strategies in LGPS can push roomtemperature conductivities above 10 mS cm⁻¹ in some reports [7] . This research was motivated by the absence of comprehensive EIS-based comparative data for electrolytes prepared under controlled Egyptian laboratory conditions.
The research groups at Alexandria Mediterranean University and Sinai Institute of Science and Technology sought to characterize and rank six solid-state electrolyte formulations using a unified EIS protocol, covering two garnet, two sulfide, and one polymer electrolyte sample, with detailed temperature-dependent analysis to extract activation energies. Such data are directly relevant to ongoing battery research and manufacturing interests in the region [8,9] .
Reagents and chemicals
All reagents and precursor materials were sourced from established international suppliers. Lanthanum oxide (La₂O₃, 99.99%), zirconium dioxide (ZrO₂, 99.9%), lithium carbonate (Li₂CO₃, ≥99%), aluminum oxide (Al₂O₃, 99.99%), niobium(V) oxide (Nb₂O₅, 99.9%), lithium sulfide (Li₂S, ≥99.9%), germanium(IV) sulfide (GeS₂, 99.99%), phosphorus pentasulfide (P₂S₅, ≥99%), and lithium bis(trifluoromethanesulfonyl)imide (LiTFSI, ≥99.95%) were purchased from Sigma-Aldrich (Merck KGaA, Darmstadt, Germany). PVDF powder (Kynar 761) was acquired from Arkema SA (Colombes, France). N-methyl-2-pyrrolidone (NMP, anhydrous, 99.5%) used as PVDF casting solvent was sourced from Merck KGaA. Isopropanol (IPA, 99.9%) and ethanol (99.9%) used for washing procedures were obtained from SOLVAY S.A. (Brussels, Belgium). Platinum foil (99.99%, 0.1 mm thick) for ion-blocking electrodes was purchased from Goodfellow Cambridge Ltd (Huntingdon, UK). All moisture-sensitive materials were handled in a glovebox under argon atmosphere with water and oxygen levels below 0.5 ppm.
Material and Methods
Material and Methods
Material
Material
Quality control and calibration
All EIS measurements were preceded by Open-Circuit Voltage (OCV) stabilization for at least 20 minutes. Cell constants were verified using a 1 mM KCl standard solution prior to each experimental session. The potentiostat frequency response was calibrated against a precision RC dummy cell (Gamry reference standard) at the start and end of each measurement day. Reproducibility was assessed by measuring each sample in triplicate; the relative standard deviation for conductivity values across triplicate measurements did not exceed 3.7% for any sample. Phase angle accuracy was verified at 1 kHz and confirmed within ±0.3° of the calibration target. Moisture control was verified by recording the impedance of a dry LLZO-2 pellet before and after 30 minutes of argon purging; no significant difference was found, confirming adequate atmosphere control. Thermal drift in the testing chamber was monitored with a calibrated Type K thermocouple and remained within ±0.8°C of setpoint throughout.
Instrumentation
Phase identification of all electrolyte samples was performed by X-ray diffraction using a Bruker D8 EIS spectra for all six electrolytes were successfully acquired and fitted to appropriate equivalent circuits (Table 1). The LGPS-type electrolytes showed the lowest bulk and charge transfer resistances, with LGPS-2 giving Rb = 0.21 Temperature-dependent conductivity data revealed Arrhenius-type behaviour for all samples over the 25-100°C range (Table 2). LGPS-2 maintained the highest conductivity at every temperature, reaching 6.78 mS cm⁻¹ at 100°C with the lowest activation energy of 0.15 eV. LLZO-3 showed a competitive performance within the garnet family, achieving 2.73 mS cm⁻¹ at 100°C and Ea = 0.27 eV. The PVDF-LiTFSI composite showed the highest Ea (0.67 eV) and the lowest absolute conductivity values (0.023 mS cm⁻¹ at 25°C), confirming that polymer chain relaxation dynamics dominate ion transport in this system. The threefold conductivity improvement from LLZO-2 (undoped) to LLZO-3 (Nb-doped) at room temperature is consistent with published data on stabilised cubic LLZO phases [6,12] .
| Sample | σ at 25°C (mS cm⁻¹) | σ at 60°C (mS cm⁻¹) | σ at 100°C (mS cm⁻¹) | Ea (eV) | Density (g cm⁻³) |
|---|---|---|---|---|---|
| LLZO-1 | 0.91 | 1.58 | 2.23 | 0.31 | 4.87 |
| LLZO-2 | 0.48 | 0.87 | 1.34 | 0.44 | 4.61 |
| LLZO-3 | 1.24 | 1.97 | 2.73 | 0.27 | 4.93 |
| LGPS-1 | 2.41 | 3.52 | 4.61 | 0.19 | 2.98 |
| LGPS-2 | 3.87 | 5.23 | 6.78 | 0.15 | 3.12 |
| PVDF-LiTFSI | 0.023 | 0.071 | 0.184 | 0.67 | 1.74 |
Table text extracted from the original PDF; superscript letters are shown inline. The original table image is below.
View original table image
| Electrolyte type | Composition | Rb (Ω) | Rct (kΩ) | Warburg σ | CPE (µF) | χ² |
|---|---|---|---|---|---|---|
| LLZO-1 | Li6.5La3Zr1.5Al0.5O12 | 1.23 | 2.47 | 18.3 | 0.82 | 0.0041 |
| LLZO-2 | Li7La3Zr2O12 (pure) | 2.87 | 5.13 | 34.7 | 1.24 | 0.0063 |
| LLZO-3 | Li6.75La3Zr1.75Nb0.25O12 | 0.91 | 1.83 | 12.4 | 0.63 | 0.0029 |
| LGPS-1 | Li10GeP2S12 | 0.34 | 0.72 | 5.8 | 0.41 | 0.0018 |
| LGPS-2 | Li9.54Si1.74P1.44S11.7Cl0.3 | 0.21 | 0.48 | 3.7 | 0.28 | 0.0012 |
| PVDF-LiTFSI | PVDF + 20 wt% LiTFSI | 12.47 | 31.8 | 147.2 | 4.87 | 0.0118 |
Table text extracted from the original PDF; superscript letters are shown inline. The original table image is below.
View original table image
Discussion
The results from this research confirm the well-established conductivity hierarchy among solid-state electrolyte families: sulfide-type > garnet-type > polymer composite at room temperature. LGPS-2 achieved 3.87 mS cm⁻¹ at 25°C, which falls within the range reported by several groups for silicon-substituted LGPS analogues [9] . The very low activation energy of 0.15 eV for LGPS-2 indicates a flat energy landscape for Li⁺ migration, consistent with the high coordination number and soft lattice of sulfide frameworks compared to oxides. This property makes LGPS-type electrolytes particularly attractive for operation across a wide temperature range without significant conductivity loss at low temperatures, an important practical consideration for electric vehicles in northern climates. The grain boundary resistance emerges from this work as the most critical factor differentiating LLZO samples. In LLZO-2 (undoped), the large Rct value reflects significant grain boundary impedance from the tetragonal phase content, which is a less conductive polymorph that tends to form at grain boundaries during cooling. Nb-doping in LLZO-3 stabilizes the cubic phase throughout the bulk and at grain boundaries, reducing Rct from 5.13 to 1.83 kΩ. This finding is in accord with the work of Murugan et al. [6] and later studies showing that aliovalent dopants on the Zr site effectively reduce the cubic-to-tetragonal phase transition temperature. The challenge of grain boundary engineering in LLZO remains a key target area for future work, particularly hot-pressing and spark plasma sintering approaches that minimise pore content and secondary phases. The polymer composite data confirm that PVDF-LiTFSI at a salt loading of 20 wt% delivers conductivities far below the target of 1 mS cm⁻¹ typically cited for room-temperature battery operation [14] . Increasing the salt loading beyond 20 wt% has been reported to cause plasticization and mechanical softening [16] , so future composite electrolyte work at Alexandria Mediterranean University will explore addition of ceramic fillers such as LLZO nanoparticles to simultaneously improve conductivity and mechanical integrity. The combination of EIS with XRD phase analysis and SEM microstructural data allowed a comprehensive picture of how structure at multiple length scales influences macroscopic ion transport, which should serve as a useful methodological framework for evaluating future electrolyte candidates.
A limitation of this research was the use of platinum ionblocking electrodes, which precluded direct measurement of electronic transference numbers. Future work will incorporate lithium symmetric cells to allow separate determination of Li⁺ transference numbers using the Bruce-Vincent method.
Conclusion
This research used electrochemical impedance spectroscopy to characterize and compare six solid-state electrolyte formulations from three structural families under a unified experimental protocol. Among garnet-type electrolytes, Nbsubstituted LLZO-3 (Li6.75La3Zr1.75Nb0.25O12) achieved the best room-temperature conductivity (1.24 mS cm⁻¹) and lowest activation energy (0.27 eV) within the oxide family, confirming the stabilising effect of aliovalent Nb⁵⁺ on the cubic garnet phase. Sulfide electrolyte LGPS-2 gave the overall best conductivity of 3.87 mS cm⁻¹ at 25°C and 6.78 mS cm⁻¹ at 100°C with the lowest Ea of 0.15 eV. The PVDF-LiTFSI composite showed two to three orders of magnitude lower conductivity than the inorganic electrolytes at all temperatures, confirming that further modification is needed before polymer electrolytes can compete with inorganic counterparts in high-power applications. Nyquist plot analysis revealed that grain boundary resistance is the
Acknowledgement
Acknowledgements
Figures and tables from the paper
References
19 in the original paper- Tarascon JM, Armand M. Issues and challenges facing rechargeable lithium batteries. Nature. 2001;414(6861):359-367.
- Janek J, Zeier WG. A solid future for battery development. Nat Energy. 2016;1(9):16141.
- Kim JG, Son B, Mukherjee S. A review of lithium and non-lithium based solid state batteries. J Power Sources. 2015;282:299-322.
- Barsoukov E, Macdonald JR. Impedance Spectroscopy: Theory, Experiment, and Applications. 2nd ed. WileyInterscience; 2005.
- Thangadurai V, Narayanan S, Pinzaru D. Garnet-type solid-state fast Li ion conductors for Li batteries. Chem Soc Rev. 2014;43(13):4714-4727.
- Murugan R, Thangadurai V, Weppner W. Fast lithium ion conduction in garnet-type Li7La3Zr2O12. Angew Chem Int Ed. 2007;46(41):7778-7781.
- Kanno R, Murayama M. Lithium ionic conductor thioLISICON: the Li2S-GeS2-P2S5 system. J Electrochem Soc. 2001;148(7):A742-A746.
- Takada K. Progress and prospective of solid-state lithium batteries. Acta Mater. 2013;61(3):759-770.
- Zhang Z, Shao Y, Lotsch B. New horizons for inorganic solid state ion conductors. Energy Environ Sci. 2018;11(8):1945-1976.
- Masquelier C, Croguennec L. Polyanionic (phosphates, silicates, sulfates) frameworks as electrode materials for rechargeable Li or Na batteries. Chem Rev. 2013;113(8):6552-6591.
- Imanishi N, Takeda Y, Yamamoto O. Development of the lithium/air battery with LISICON-based electrolytes. Solid State Ionics. 1999;124(3-4):197-200.
- Aurbach D, Markovsky B, Rodkin A. On the capacity fading of LiCoO2 intercalation electrodes: effect of cycling, storage, and surface film formation. Electrochim Acta. 2002;47(27):4291-4306.
- Ohta N, Takada K, Osada M. Electrochemical performance of an all-solid-state lithium ion battery with garnet-type oxide electrolyte. J Power Sources. 2006;196(9):3988-3993.
- Fergus JW. Ceramic and polymeric solid electrolytes for lithium-ion batteries. J Power Sources. 2010;195(15):4554-4569.
- Han X, Gong Y, Fu KK. Negating interfacial impedance in garnet-based solid-state Li metal batteries. Nat Mater. 2017;16(5):572-579.
- Yao X, Huang B, Yin J. All-solid-state lithium batteries with inorganic solid electrolytes: review of fundamentals and challenges. Chin Phys B. 2016;25(1):018802.
- Lotsch BV, Maier J. Relevance of solid electrolytes for lithium-based batteries: a realistic view. J Electroceram. 2017;38(2-4):128-141.
- Goodenough JB, Kim Y. Challenges for rechargeable Li batteries. Chem Mater. 2010;22(3):587-603.
- Duan Y, Wang Y, Li J. Preparation and ionic conductivity of lithium sulfide based glass-ceramic electrolytes. Int J Electrochem Sci. 2019;14(3):26172628.