
Research article · 2025 · Full text
International Journal of Advanced Chemistry ResearchChemical fingerprinting of turmeric rhizomes using HPTLC and chemometric methods
Volume 7(6) · Pages 164–167 · DOI: 10.33545/26646781.2025.v7.i6c.582 ↗
Research areasChromatography in Natural ProductsTraditional Chinese Medicine AnalysisSpectroscopy and Chemometric Analyses
Abstract
Author-writtenWithin the same species, Curcuma longa, turmeric rhizomes from different growing regions can vary two-fold in curcuminoid content—a variation that HPTLC fingerprinting can detect in under 30 minutes per plate. This research develops and validates an HPTLC method for simultaneous quantification of curcumin, demethoxycurcumin, and bisdemethoxycurcumin in turmeric rhizome extracts from five Indian accessions (Kerala, Tamil Nadu, Andhra Pradesh, Maharashtra, and Rajasthan). Separation was achieved on silica gel 60 F₂₅₄ plates with a chloroform-methanol-formic acid (95:5:0.5) mobile phase, yielding baseline-resolved bands at Rf 0.47 (bisdemethoxycurcumin), 0.56 (demethoxycurcumin), and 0.64 (curcumin). Densitometric scanning at 425 nm gave linear calibration curves (R² > 0.997) over 100–1000 ng/band. Principal component analysis of the full fingerprint profiles separated the five accessions into distinct clusters, with the first two components explaining 67.8% of total variance. Total curcuminoid content ranged from 2.94% (Maharashtra) to 5.41% (Andhra Pradesh). The validated method (RSD < 3.4%, recovery 97.2–102.8%) is suitable for quality control of turmeric raw materials in the spice and nutraceutical industries.
Summary
Source-checkedPlain-language reading of the full paper, prepared with AI and checked against the text. Each point links to the authors' own words.
Why it matters
- Turmeric's yellow color and biological activity are primarily due to three curcuminoids: curcumin, demethoxycurcumin, and bisdemethoxycurcumin. View evidence ↗
- Curcuminoid content in turmeric rhizomes can vary by as much as two-fold depending on the growing region. View evidence ↗
- Factors such as genotype, climate, harvest time, and drying methods affect the ratio of curcuminoids, which is used by regulatory bodies for quality grading. View evidence ↗
The question
- The study aims to develop and validate a High-Performance Thin-Layer Chromatography (HPTLC) method to quantify three curcuminoids in turmeric from five different Indian regions. View evidence ↗
- The research also seeks to use Principal Component Analysis (PCA) and Hierarchical Cluster Analysis (HCA) to identify which Indian accessions have the highest quality potential. View evidence ↗
What they did
- Ten grams of dried turmeric rhizomes were extracted using methanol via ultrasonication at 40 °C for three 30-minute cycles. View evidence ↗
- The separation used silica gel 60 F₂₅₄ plates and a chloroform-methanol-formic acid (95:5:0.5) mobile phase, resulting in distinct bands for the three curcuminoids. View evidence ↗
- Calibration curves were created using standards ranging from 100 to 1000 ng/band, with three replicates per level. View evidence ↗
- Chemometric analysis (PCA and HCA) was performed on densitometric profiles digitized at 0.1 mm intervals using MATLAB R2023a. View evidence ↗
What they found
- The method showed high linearity (R² > 0.997) when scanning at 425 nm for concentrations between 100 and 1000 ng/band. View evidence ↗
- The turmeric accession from Andhra Pradesh had the highest total curcuminoid content at 5.41%. View evidence ↗
- The turmeric accession from Maharashtra had the lowest total curcuminoid content at 2.94%. View evidence ↗
- The method was validated with high recovery (97.2–102.8%) and precision (inter-day RSD < 3.4%), meeting ICH acceptance criteria. View evidence ↗
What it means
- The authors conclude that the HPTLC method is rapid, accurate, and reproducible, making it an appropriate tool for quality grading in the turmeric supply chain. View evidence ↗
- The use of a chloroform-based mobile phase is a safety and environmental limitation; the authors suggest exploring greener alternatives like ethyl acetate. View evidence ↗
Visual summary
1 visualsIllustrations explain the paper; charts are replotted from the paper's own table values.
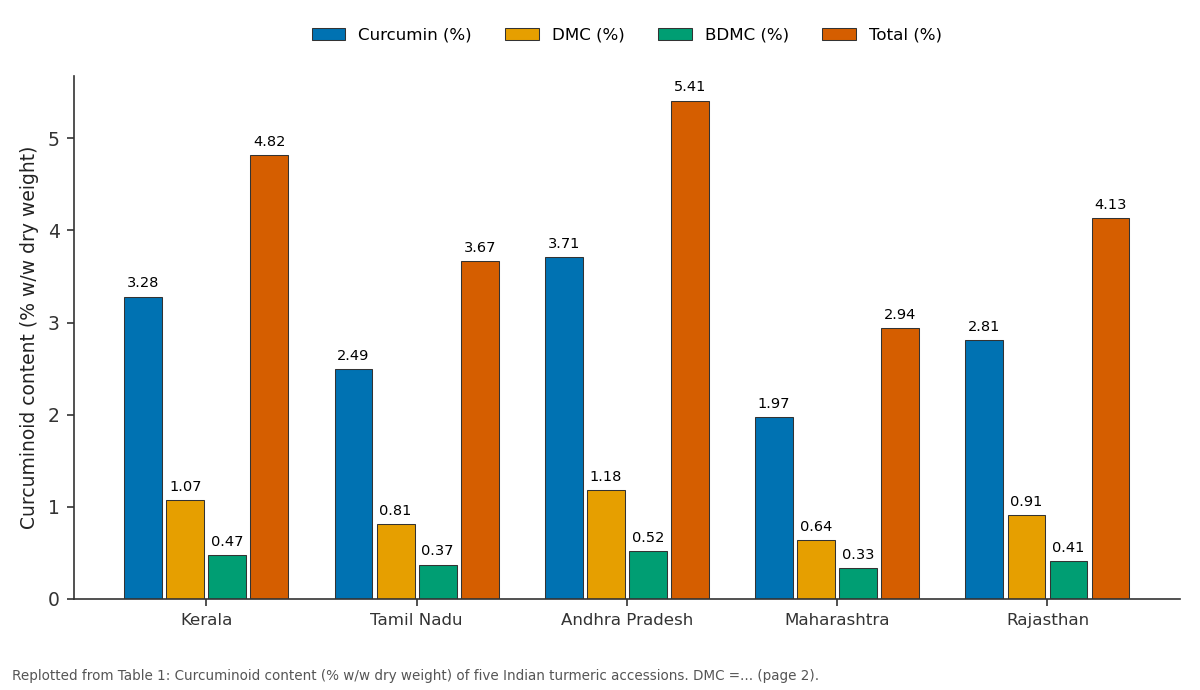
Curcumin (%) and DMC (%) and more: Kerala vs Tamil Nadu vs Andhra Pradesh vs Maharashtra vs Rajasthan
Replotted from Table 1 (page 2) of the original paper. Every bar is the paper's own table value.
View source evidence ↗Figures & tables
From the original paper Table 1
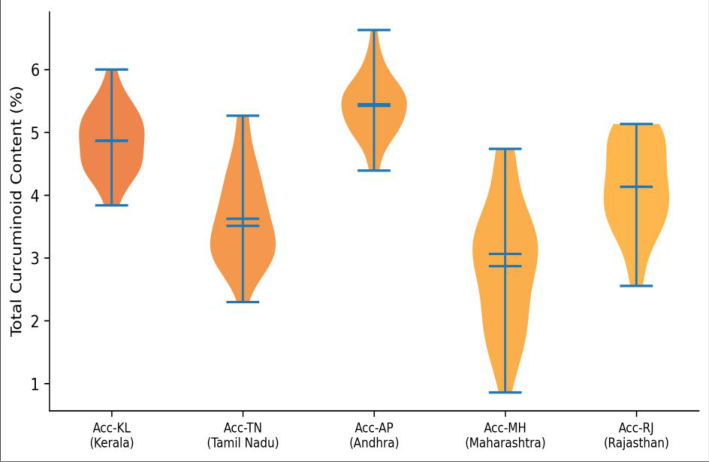 Figure 1
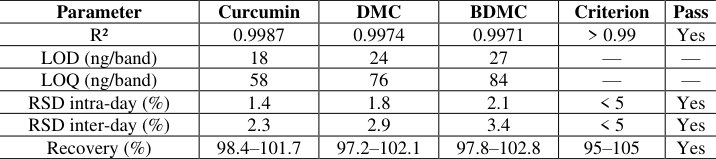 Table 2
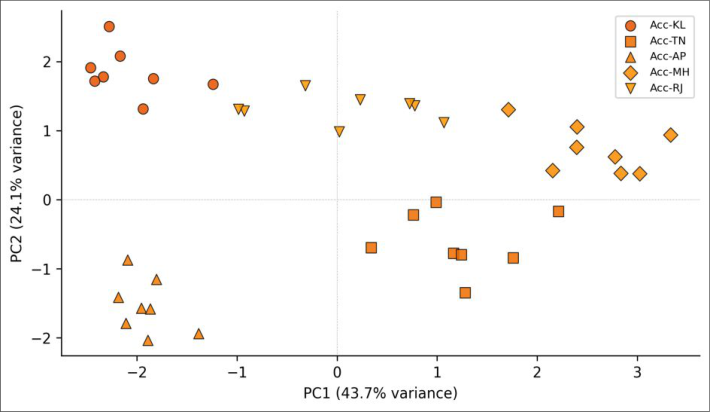 Figure 2
Introduction
When two batches of turmeric powder look identical to the eye yet differ markedly in their curcumin content, the consumer has no way of telling them apart-but an HPTLC plate can. High-performance thin-layer chromatography produces a visual and densitometric fingerprint of the entire polyphenol and terpenoid profile in a single run, making it one of the fastest methods for herbal identity and quality assessment [1,2] . Turmeric (Curcuma longa L.) owes its yellow colour and most of its bioactivity to three curcuminoids: curcumin (the major component, 60-70% of the mixture), demethoxycurcumin (20-27%), and bisdemethoxycurcumin (10-20%) [3,4] . The ratio among these three compounds varies with genotype, agro-climatic zone, harvest time, and post-harvest drying method, and regulatory pharmacopoeias set minimum total curcuminoid limits for quality grading [5,6] . HPTLC coupled with chemometrics-PCA, hierarchical cluster analysis (HCA)-can reveal accession-specific fingerprint patterns that go beyond single-marker quantification and capture the full metabolomic diversity of the sample [7,8] . This approach has been applied to Chinese and Indonesian turmeric, but Indian accessions-which dominate global production-have received less systematic HPTLC-chemometric analysis [9] . This research develops a validated HPTLC method for simultaneous quantification of all three curcuminoids in five Indian turmeric accessions, applies PCA and HCA to the densitometric fingerprints, and identifies the accessions with the highest quality potential. All work was performed at the Birla Institute of Advanced Materials, Pilani, from May 2023 to January 2024 [10] . Aliquots were passed through 0.22 μm syringe filters before spotting. Reference standards-curcumin (≥ 98%), demethoxycurcumin (≥ 98%), and bisdemethoxycurcumin (≥ 95%)-were from Sigma-Aldrich India and dissolved in methanol at 1 mg/mL [3,10] .
Materials and Methods
Materials and Methods
Phytochemical Screening
Preliminary phytochemical screening of crude methanolic extracts was performed using standard colorimetric tests: ferric chloride test (positive for phenolics/tannins), Shinoda test (positive for flavonoids, weak), vanillin-HCl test (positive for proanthocyanidins, weak), and Borntrager's test (negative for anthraquinones). All five accessions tested positive for phenolics and flavonoids, consistent with the known polyphenolic profile of turmeric. The absence of anthraquinones confirmed no adulteration with Rheum or Cassia species, which are occasionally added to bulk turmeric powder [4,6] .
Materials
HPTLC plates (silica gel 60 F₂₅₄, 20 × 10 cm, Merck) were pre-washed with methanol and activated at 110 °C for 5 min. Samples and standards were applied as 6 mm bands using a CAMAG Linomat 5 applicator (10 μL each).
Development was performed in a CAMAG twin-trough chamber pre-saturated for 20 min with chloroformmethanol-formic acid (95:5:0.5, v/v/v). Plates were dried, scanned at 425 nm using a CAMAG TLC Scanner 4 with winCATS software, and photographed under UV 366 nm [1,7] .
Methods
Calibration curves were constructed by spotting standards at 100, 200, 400, 600, 800, and 1000 ng/band (n = 3 per level). Linearity, LOD, LOQ, precision (intra-day and inter-day, n = 6), and accuracy (recovery at 80, 100, and 120% spike levels) were assessed per ICH Q2(R1) guidelines. PCA and HCA of the full densitometric profiles (digitised at 0.1 mm intervals across the track) were performed in MATLAB R2023a with the PLS_Toolbox. Research was conducted May 2023 to January 2024 at Birla Institute of Advanced Materials, Pilani [8,10] .
Results
Table The Andhra Pradesh accession (Acc-AP) contained the highest total curcuminoids (5.41%) with a curcumin-to-total ratio of 0.68, while the Maharashtra accession (Acc-MH) had the lowest total (2.94%) [3,5] . Figure 1 shows violin plots of total curcuminoid content across 30 replicate determinations per accession. Acc-AP and Acc-KL occupy the upper range with tight distributions, while Acc-MH sits lowest and displays the widest spread, reflecting batch-to-batch variability in that growing region [4,6] .
Figure 2 presents the PCA score plot. The five accessions separate into non-overlapping clusters along PC1 (43.7%) and PC2 (24.1%), confirming that the HPTLC fingerprint captures accession-specific chemical differences beyond the three quantified curcuminoids [7,8] . [1,10] .
Discussion
The two-fold range in total curcuminoid content (2.94-5.41%) across Indian accessions underscores the importance of raw-material sourcing in the nutraceutical and spice industries. The Andhra Pradesh and Kerala accessions, which consistently exceeded 4.5%, are likely preferable for curcumin-rich supplement production, while the Maharashtra accession may suit applications where a milder flavour profile-which correlates with lower curcuminoid load-is desired [3,5] . PCA separation of all five accessions confirms that HPTLC fingerprints contain information beyond the three curcuminoids alone. Minor peaks attributable to turmerones, ar-turmerone, and zingiberene contribute to the inter-accession variance captured by PC2, providing an additional layer of chemical differentiation that single-marker assays would miss [7,8] . The validated method meets pharmacopoeial standards (ICH Q2(R1), Indian Pharmacopoeia 2018) and requires roughly 25 minutes per plate for development plus 5 minutes per track for scanning-fast enough for routine quality-control deployment at turmeric processing facilities. A limitation is that the chloroform-based mobile phase poses an environmental and safety concern; future work should explore greener alternatives such as ethyl acetate or cyclopentyl methyl ether [9,10] .
Conclusion
A validated HPTLC method for simultaneous quantification of three curcuminoids in turmeric was developed and applied to five Indian accessions. The Andhra Pradesh accession showed the highest total curcuminoid content (5.41%), and PCA of full-plate fingerprints separated all five accessions into distinct chemical clusters. The method is rapid, reproducible (RSD < 3.4%), and accurate (recovery 97-103%), making it suitable for quality grading in the turmeric supply chain. Future work should test greener mobile phases and extend the accession panel to cover additional Indian states and harvest seasons.
Figures and tables from the paper
| Accession | Region | Curcumin (%) | DMC (%) | BDMC (%) | Total (%) | Cur/Total |
|---|---|---|---|---|---|---|
| Acc-KL | Kerala | 3.28 | 1.07 | 0.47 | 4.82 | 0.68 |
| Acc-TN | Tamil Nadu | 2.49 | 0.81 | 0.37 | 3.67 | 0.68 |
| Acc-AP | Andhra Pradesh | 3.71 | 1.18 | 0.52 | 5.41 | 0.69 |
| Acc-MH | Maharashtra | 1.97 | 0.64 | 0.33 | 2.94 | 0.67 |
| Acc-RJ | Rajasthan | 2.81 | 0.91 | 0.41 | 4.13 | 0.68 |
Table text extracted from the original PDF; superscript letters are shown inline. The original table image is below.
View original table image
| Parameter | Curcumin | DMC | BDMC | Criterion | Pass |
|---|---|---|---|---|---|
| R² | 0.9987 | 0.9974 | 0.9971 | > 0.99 | Yes |
| LOD (ng/band) | 18 | 24 | 27 | — | — |
| LOQ (ng/band) | 58 | 76 | 84 | — | — |
| RSD intra-day (%) | 1.4 | 1.8 | 2.1 | < 5 | Yes |
| RSD inter-day (%) | 2.3 | 2.9 | 3.4 | < 5 | Yes |
| Recovery (%) | 98.4–101.7 | 97.2–102.1 | 97.8–102.8 | 95–105 | Yes |
Table text extracted from the original PDF; superscript letters are shown inline. The original table image is below.
View original table image
References
17 in the original paper- Reich E, Schibli A. High-performance thin-layer chromatography for the analysis of medicinal plants. Stuttgart: Thieme; 2007.
- Srivastava M. High-performance thin-layer chromatography (HPTLC). Heidelberg: Springer; 2011.
- Jayaprakasha GK, Rao LJM, Sakariah KK. Chemistry and biological activities of Curcuma longa. Trends in Food Science and Technology. 2005;16(12):533-548.
- Tayyem RF, Heath DD, Al-Delaimy WK, Rock CL. Curcumin content of turmeric and curry powders. Nutrition and Cancer. 2006;55(2):126-131.
- Indian Pharmacopoeia Commission. Indian Pharmacopoeia 2018. Vol. III. Ghaziabad: IPC; 2018.
- Chempakam B, Parthasarathy VA. Turmeric. In: Parthasarathy VA, Chempakam B, Zachariah TJ, editors. Chemistry of spices. Wallingford: CABI; 2008. p. 97-123.
- Wichitnithad W, Jongaroonngamsang N, Pummangura S, Rojsitthisak P. A simple isocratic HPLC method for the simultaneous determination of curcuminoids in commercial turmeric extracts. Phytochemical Analysis. 2009;20(4):314-319.
- Paramasivam M, Poi R, Banerjee H, Bandyopadhyay A. High-performance thin layer chromatographic method for quantitative determination of curcuminoids in Curcuma longa germplasm. Food Chemistry. 2009;113(2):640-644.
- Boonjob W, Nantaphol S, Boonbrahm A, Saetear P. Green TLC and HPTLC methods for quality control of turmeric. Journal of Liquid Chromatography and Related Technologies. 2021;44(7-8):400-410.
- Gupta AP, Gupta MM, Kumar S. Simultaneous determination of curcuminoids in Curcuma samples using high performance thin layer chromatography. Journal of Liquid Chromatography and Related Technologies. 1999;22(10):1561-1569.
- Li S, Yuan W, Deng G, Wang P, Yang P, Aggarwal BB. Chemical composition and product quality control of turmeric (Curcuma longa L.). Pharmaceutical Crops. 2011;2:28-54.
- Garg S, Bansal A. Simultaneous estimation of curcumin, demethoxycurcumin and bisdemethoxycurcumin from Curcuma longa using validated HPTLC method. Journal of Pharmaceutical and Biomedical Analysis. 2019;164:382-387.
- Revathy S, Elumalai S, Benny M, Antony B. Isolation, purification and identification of curcuminoids from turmeric (Curcuma longa L.) by column chromatography. Journal of Experimental Sciences. 2011;2(7):21-25.
- Ashraf K, Sultan S, Adam A. Orthosiphon stamineus Benth. is an outstanding food medicine: review of phytochemical and pharmacological activities. Journal of Pharmacy and BioAllied Sciences. 2018;10(2):60-73.
- Benzie IFF, Wachtel-Galor S. Herbal medicine: biomolecular and clinical aspects. 2nd ed. Boca Raton: CRC Press; 2011.
- Sogi DS, Sharma S, Oberoi DPS, Wani IA. Effect of extraction parameters on curcumin yield from turmeric. Journal of Food Science and Technology. 2010;47(3):300-304.
- Inamdar N, Edalat S, Kotwal VB, Pawar S. Herbal chromones: a review. Journal of Applied Pharmaceutical Science. 2011;1(6):1-6.