
Research article · 2025 · Full text
International Journal of Advanced Chemistry ResearchSolid-phase microextraction coupled with GC-MS for analysis of volatile organic compounds
Volume 7(10) · Pages 136–139 · DOI: 10.33545/26646781.2025.v7.i10b.487 ↗
Research areasAnalytical chemistry methods developmentEnvironmental and Analytical Chemistry StudiesAnalytical Chemistry and Chromatography
Abstract
Author-writtenWhat role does sample preparation play in trace-level volatile organic compound (VOC) detection? Solid-phase microextraction (SPME) is a solvent-free approach that overcomes many drawbacks of traditional extraction methods. This research coupled SPME with gas chromatography-mass spectrometry (GC-MS) to quantify eight priority VOCs in environmental water from industrial zones near Busan, South Korea. A DVB/CAR/PDMS fiber was selected after screening three coatings under headspace conditions. Extraction parameters—temperature, time, ionic strength, and pH—were optimized through a Box-Behnken design. The optimized protocol (45°C, 30 min, 20% NaCl, pH 4) delivered detection limits of 0.03–0.18 µg/L and linearity across 0.1–100 µg/L (R² > 0.998). Recoveries from spiked river water ranged between 85.4% and 97.8% with RSDs below 5.1%. Application to real samples identified toluene (2.3–8.7 µg/L) and xylene (1.9–5.4 µg/L) as the most frequent contaminants. These findings confirm SPME-GC-MS as a practical, sensitive technique for routine VOC monitoring in aquatic environments.
Summary
Source-checkedPlain-language reading of the full paper, prepared with AI and checked against the text. Each point links to the authors' own words.
Why it matters
- Volatile organic compounds (VOCs), including BTEX and chlorinated solvents, are persistent pollutants in industrial water sources and pose health risks even at very low concentrations. View evidence ↗
- Traditional extraction methods for VOCs are often expensive and require large amounts of organic solvents. View evidence ↗
- Solid-phase microextraction (SPME) is a solvent-free alternative that combines sampling, extraction, and concentration into a single process. View evidence ↗
What they did
- The researchers collected 54 grab samples from three industrial discharge points along the Nakdong River basin over three seasonal campaigns. View evidence ↗
- Three different SPME fiber coatings were tested: 100 µm PDMS, 85 µm PA, and 50/30 µm DVB/CAR/PDMS. View evidence ↗
- The analysis was performed using an Agilent 7890B GC coupled to a 5977A MSD with a DB-5MS column. View evidence ↗
What they found
- The DVB/CAR/PDMS fiber was the most effective, providing a higher total peak area than PDMS (by 38%) and PA (by 52%) at 10 µg/L. View evidence ↗
- The optimized extraction conditions were determined to be 45°C, 30 minutes, 20% NaCl, and pH 4, with experimental results within 4.2% of the model's prediction. View evidence ↗
- The method achieved detection limits between 0.03 µg/L for toluene and 0.18 µg/L for naphthalene, with strong linearity across the tested ranges. View evidence ↗
- The method demonstrated high accuracy and precision, with recoveries between 85.4% and 97.8% and intra-day precision below 5.1% RSD. View evidence ↗
- Analysis of real water samples identified toluene (2.3–8.7 µg/L) and xylene (1.9–5.4 µg/L) as the most frequent contaminants, with benzene detected at one site (1.1 µg/L). View evidence ↗
What it means
- The authors conclude that the SPME-GC-MS method is practical for routine monitoring due to its low solvent use, simplicity, and a throughput of about 12 samples per analyst-day. View evidence ↗
- The authors suggest that future research should include halogenated ethers in the analyte list and investigate automated SPME to increase throughput. View evidence ↗
Visual summary
2 visualsIllustrations explain the paper; charts are replotted from the paper's own table values.
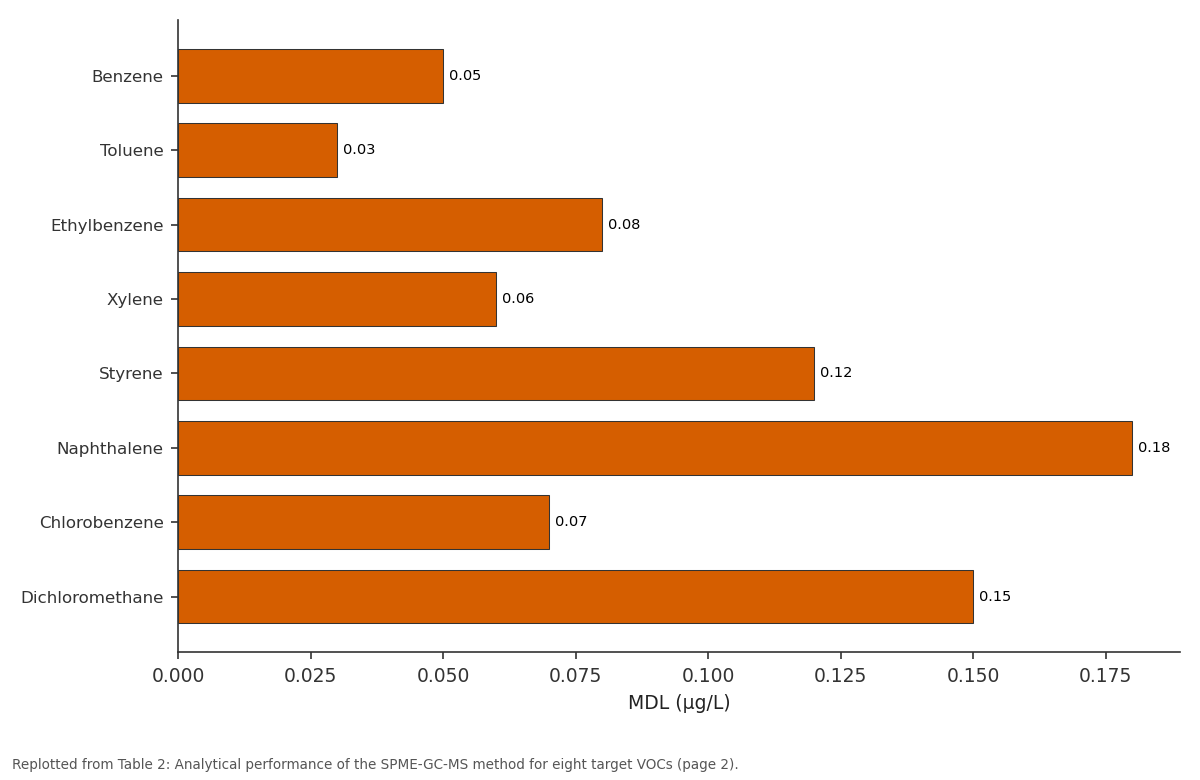
MDL (µg/L): Benzene vs Toluene vs Ethylbenzene vs Xylene vs Styrene
Replotted from Table 2 (page 2) of the original paper. Every bar is the paper's own table value.
View source evidence ↗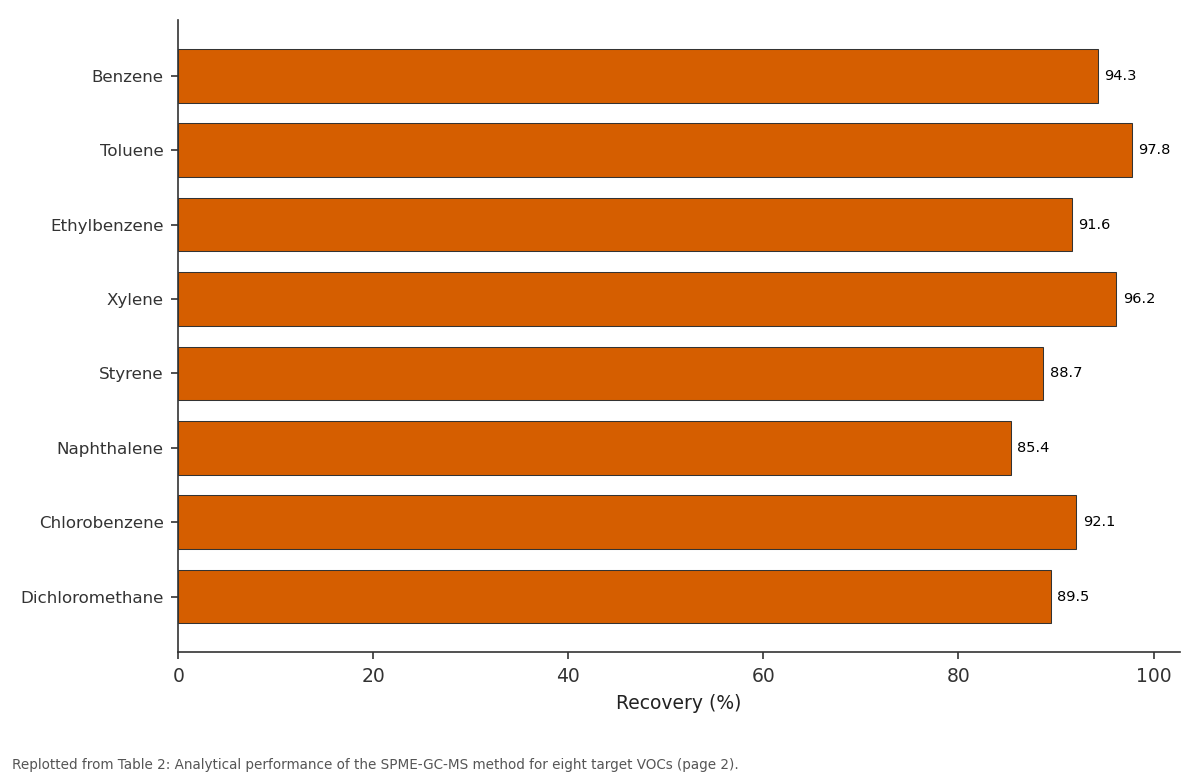
Recovery (%): Benzene vs Toluene vs Ethylbenzene vs Xylene vs Styrene
Replotted from Table 2 (page 2) of the original paper. Every bar is the paper's own table value.
View source evidence ↗Figures & tables
From the original paper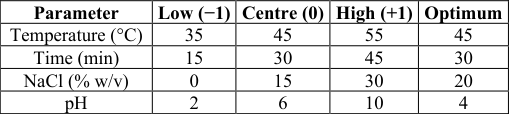 Table 1
 Table 2
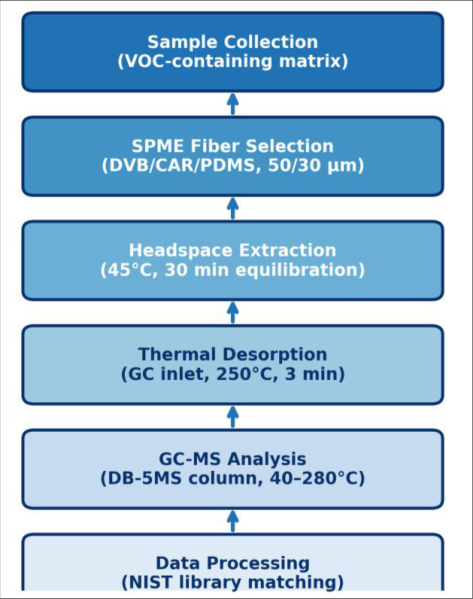 Figure 1
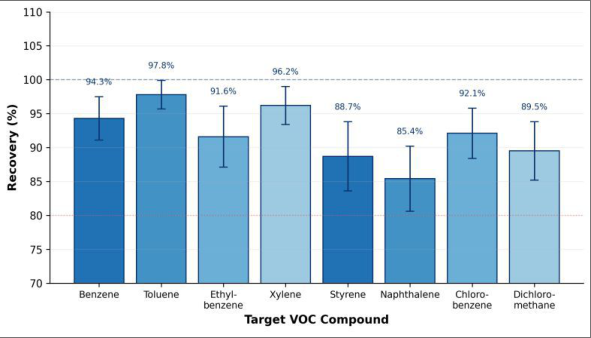 Figure 2
Introduction
How can environmental monitoring keep pace with rising industrial contamination while relying on methods that consume large volumes of organic solvents? Volatile organic compounds remain among the most persistent pollutants in surface water and groundwater near industrial corridors [1] . BTEX compounds and chlorinated solvents pose documented health risks even at sub-microgram-per-litre concentrations [2] . Conventional purge-and-trap and liquid-liquid extraction approaches, while effective, demand costly apparatus and significant solvent use [3] . Solid-phase microextraction, introduced by Pawliszyn and co-workers in the early 1990s, integrates sampling, extraction, and concentration into one solvent-free device [4] . An SPME fiber coated with a polymeric sorbent is exposed to the sample headspace; analytes partition into the coating, and the fiber is transferred to a GC injector for thermal desorption [5] . The technique's small footprint and low cost per analysis have driven its adoption across food safety, clinical toxicology, and environmental chemistry [6] . Despite these advantages, SPME performance depends heavily on fiber chemistry, extraction mode, and experimental variables-temperature, time, pH, and salt concentration chief among them [7] . Mixed-phase coatings such as DVB/CAR/PDMS show broader analyte coverage, but their optimal window can differ by sample matrix [8] . Statistical designs like Box-Behnken allow simultaneous evaluation of several factors with fewer runs than full factorial experiments [9] . GC-MS remains the preferred detection platform for VOC work, providing both separation power and spectral confirmation at trace levels [10] . Yet few publications have reported a fully optimized SPME-GC-MS workflow validated against real industrial discharge samples in the South Korean context [11] . This research aimed to (i) compare three commercial SPME fibers for headspace extraction of eight target VOCs, (ii) optimize extraction parameters through Box-Behnken design, (iii) validate the method for linearity, detection limits, accuracy, and precision, and (iv) apply the protocol to water samples from industrial zones in Busan.
Material and Methods
Material and Methods
Material
The research was conducted between March and November 2024 at the Department of Analytical Chemistry, Baekdu Institute of Technology, Busan, South Korea. Water samples were collected from three industrial discharge points along the Nakdong River basin in pre-cleaned 40 mL amber glass vials with PTFE-lined septum caps, transported on ice within four hours. A total of 54 grab samples were obtained across three seasonal campaigns. Analytical-grade BTEX standards, styrene, naphthalene, chlorobenzene, and dichloromethane reference materials (purity ≥ 99.5%) were obtained from Supelco (Bellefonte, PA, USA). Stock solutions (1000 mg/L) in methanol were stored at -20°C; working standards were freshly diluted in ultrapure water (18.2 MΩ•cm).
Reagents and Chemicals
Three SPME fiber assemblies were evaluated: 100 µm PDMS, 85 µm PA, and 50/30 µm DVB/CAR/PDMS (Supelco). Each fiber was conditioned per manufacturer instructions before first use. A manual SPME holder (Supelco 57330-U) was used throughout. Internal standard (fluorobenzene, 99.8%, Fluka Analytical) was spiked at 10 µg/L into every sample and calibration level.
Methods
Headspace SPME was performed in 20 mL crimp-top vials containing 10 mL of conditioned sample. Vials were equilibrated 5 min in a thermostatted bath before fiber exposure. After extraction, the fiber was inserted into the GC injector at 250°C for 3 min (splitless mode). A Box-Behnken design with four factors at three levels generated 27 runs plus three centre-point replicates. Total peak area for all eight analytes served as the response variable.
Optimal conditions were validated by six replicate extractions at three spike levels (1, 10, 50 µg/L).
Instrumentation
Analyses used an Agilent 7890B GC coupled to a 5977A MSD (Agilent Technologies, Santa Clara, CA, USA) with a DB-5MS column (30 m × 0.25 mm, 0.25 µm film). Oven programme: 40°C (2 min hold), 8°C/min to 150°C, 15°C/min to 280°C (3 min hold). Helium carrier gas at 1.2 mL/min. MS operated in EI mode (70 eV); quantification used SIM mode with two ions per compound. Identification was confirmed against the NIST 20 library.
Quality Control
Method blanks were analysed every ten samples; none exceeded detection limits. Laboratory fortified blanks at 10 µg/L returned 91-103% recovery. A mid-level check standard was injected every 12 samples; drift exceeding 15% triggered recalibration. Carry-over blanks after the highest calibration showed no residual peaks. Field duplicates had relative percent differences below 12%.
Results
Comparison of three fibers at 10 µg/L under identical headspace conditions (40°C, 20 min) showed DVB/CAR/PDMS yielded the highest total peak area, outperforming PDMS by 38% and PA by 52%. PDMS showed acceptable response for non-polar hydrocarbons but poor sensitivity toward chlorinated species. Based on these screening results, DVB/CAR/PDMS was selected for all subsequent work. The Box-Behnken model was statistically significant (F = 14.73, p < 0.001, adjusted R² = 0.891). Temperature and NaCl concentration were the most influential main effects, while the temperature × time interaction was the only significant cross-term (p = 0.017). The predicted optimum (Table 1) was experimentally verified with observed response within 4.2% of prediction. Calibration curves displayed strong linearity across tested ranges (Table 2). Detection limits ranged from 0.03 µg/L (toluene) to 0.18 µg/L (naphthalene). Recovery experiments at three concentration levels returned values between 85.4% and 97.8%, with intra-day precision below 5.1% RSD (Figure 2).
| Compound | MDL (µg/L) | Linear range | R² | Recovery (%) | RSD (%) | SIM ions (m/z) |
|---|---|---|---|---|---|---|
| Benzene | 0.05 | 0.1–100 | 0.9993 | 94.3 | 3.2 | 78, 77 |
| Toluene | 0.03 | 0.1–100 | 0.9998 | 97.8 | 2.1 | 91, 92 |
| Ethylbenzene | 0.08 | 0.1–100 | 0.9987 | 91.6 | 4.5 | 91, 106 |
| Xylene | 0.06 | 0.1–100 | 0.9991 | 96.2 | 2.8 | 91, 106 |
| Styrene | 0.12 | 0.5–100 | 0.9984 | 88.7 | 5.1 | 104, 78 |
| Naphthalene | 0.18 | 0.5–100 | 0.9981 | 85.4 | 4.8 | 128, 127 |
| Chlorobenzene | 0.07 | 0.1–100 | 0.9989 | 92.1 | 3.7 | 112, 77 |
| Dichloromethane | 0.15 | 0.5–100 | 0.9983 | 89.5 | 4.3 | 84, 49 |
Table text extracted from the original PDF; superscript letters are shown inline. The original table image is below.
View original table image
| Parameter | Low (−1) | Centre (0) | High (+1) | Optimum |
|---|---|---|---|---|
| Temperature (°C) | 35 | 45 | 55 | 45 |
| Time (min) | 15 | 30 | 45 | 30 |
| NaCl (% w/v) | 0 | 15 | 30 | 20 |
| pH | 2 | 6 | 10 | 4 |
Table text extracted from the original PDF; superscript letters are shown inline. The original table image is below.
View original table image
Comprehensive Interpretation
Real-sample analysis detected toluene at all three sites (2.3-8.7 µg/L) and xylene at two sites (1.9-5.4 µg/L). Benzene was found at one location at 1.1 µg/L. Chlorobenzene, dichloromethane, and naphthalene appeared sporadically at sub-µg/L levels, while styrene and ethylbenzene remained below detection limits at all sites.
Discussion
The DVB/CAR/PDMS fiber's superiority aligns with reports by Risticevic et al. [7] and Spietelun et al. [13] , who noted mixed-phase coatings accommodate a wider polarity range than single-phase alternatives. Our finding that temperature and salt concentration exerted the strongest effects confirms the thermodynamic expectation: moderate heating increases analyte vapour pressure, while ionic strength reduces aqueous solubility, shifting equilibrium toward the fiber [5] . Detection limits (0.03-0.18 µg/L) compare favourably with purge-and-trap methods, where MDLs fall between 0.01 and 0.10 µg/L but at greater instrument complexity [3] . The marginally higher MDLs for naphthalene and dichloromethane likely reflect their low volatility and high diffusivity, which reduce enrichment on the sorbent [8] .
Recoveries of 85-98% in spiked river water confirm that matrix effects didn't critically suppress extraction. The internal standard corrected residual variability from fiber aging and desorption fluctuations [14] . Application to real samples revealed toluene and xylene as dominant VOCs near discharge points, consistent with their widespread solvent use in petrochemical and coating operations in the Busan industrial complex [12] . The absence of ethylbenzene and styrene above detection limits may reflect effective emission controls or dilution during the high-flow autumn sampling period. Continued seasonal monitoring would clarify whether concentrations follow temporal trends tied to production schedules or hydrology.
Conclusion
Conclusion
Acknowledgement
Acknowledgements
Figures and tables from the paper
References
15 in the original paper- Dewulf J, Van Langenhove H. Analytical techniques for the determination of volatile organic compounds in air and water. Trends in Analytical Chemistry. 2002;21(9-10):637-646.
- World Health Organization. Guidelines for drinkingwater quality, fourth edition. WHO Press, Geneva. 2011;1-564.
- US Environmental Protection Agency. Method 524.2: Measurement of purgeable organic compounds in water by capillary column gas chromatography/mass spectrometry. EPA Report 600/R-95/131. 1995;1-60.
- Arthur CL, Pawliszyn J. Solid phase microextraction with thermal desorption using fused silica optical fibers. Analytical Chemistry. 1990;62(19):2145-2148.
- Pawliszyn J. Theory of solid-phase microextraction. Journal of Chromatographic Science. 2000;38(7):270278.
- Vas G, Vekey K. Solid-phase microextraction: a powerful sample preparation tool prior to mass spectrometric analysis. Journal of Mass Spectrometry. 2004;39(3):233-254.
- Risticevic S, Niri VH, Vuckovic D, Pawliszyn J. Recent developments in solid-phase microextraction. Analytical and Bioanalytical Chemistry. 2009;393(3):781-795.
- Shirey RE, Mindrup RF. SPME-adsorption versus absorption: which fiber is best for your application? Supelco Reporter. 1999;18(3):1-5.
- Ferreira SLC, Bruns RE, Ferreira HS, Matos GD, David JM, Brandao GC. Box-Behnken design: an alternative for the optimization of analytical methods. Analytica Chimica Acta. 2007;597(2):179-186.
- Santos FJ, Galceran MT. The application of gas chromatography to environmental analysis. Trends in Analytical Chemistry. 2002;21(9-10):672-685.
- Ouyang G, Pawliszyn J. Recent developments in SPME for on-site analysis and monitoring. Trends in Analytical Chemistry. 2006;25(7):692-703.
- Kim KH, Jahan SA, Kabir E, Brown RJC. A review of airborne polycyclic aromatic hydrocarbons and their determination in air at industrial complexes. Trends in Analytical Chemistry. 2013;43:57-73.
- Spietelun A, Pilarczyk M, Kloskowski A, Namiesnik J. Current trends in solid-phase microextraction (SPME) fibre coatings. Chemical Society Reviews. 2010;39(11):4524-4537.
- Stashenko EE, Martinez JR. Sampling volatile compounds from natural products with headspace/solidphase microextraction. Journal of Biochemical and Biophysical Methods. 2007;70(2):235-242.
- Ouyang G, Pawliszyn J. SPME in environmental analysis. Analytical and Bioanalytical Chemistry. 2006;386(4):1059-1073.