
Research article · 2025 · Full text
International Journal of Advanced Chemistry ResearchCarbon quantum dots derived from citric acid as fluorescent probes for Fe³⁺ detection
Volume 7(6) · Pages 168–170 · DOI: 10.33545/26646781.2025.v7.i6c.584 ↗
Research areasCarbon and Quantum Dots ApplicationsMolecular Sensors and Ion DetectionAnalytical chemistry methods development
Abstract
Author-writtenIn a regional context where iron contamination of groundwater affects millions of Canadians in northern communities, a cheap and portable sensor for Fe³⁺ would be a practical public-health tool. This research synthesises blue-fluorescent carbon quantum dots (CQDs) by one-step hydrothermal carbonisation of citric acid and ethylenediamine at 200 °C for 5 h, and evaluates their performance as turn-off fluorescent probes for Fe³⁺ in aqueous solution. The CQDs had a mean diameter of 3.7 nm (TEM), excitation-independent emission at 450 nm, and a quantum yield of 18.4% relative to quinine sulfate. Stern-Volmer analysis of the fluorescence quenching by Fe³⁺ yielded a linear response from 0.5 to 200 μM (R² = 0.997) with a detection limit of 0.14 μM (3σ/slope). The quenching constant (Ksv = 2.34 × 10⁴ M⁻¹) was at least 3.7-fold higher than for any other tested metal ion, confirming excellent selectivity. Among ten metal ions screened at 100 μM, only Cu²⁺ caused moderate interference (51.8% quenching vs 94.1% for Fe³⁺). Real-sample testing in spiked tap water and lake water gave recoveries of 96.8–103.4%. The CQDs can be synthesised from food-grade precursors in a single step, making them attractive for low-cost, field-deployable iron sensing.
Summary
Source-checkedPlain-language reading of the full paper, prepared with AI and checked against the text. Each point links to the authors' own words.
Why it matters
- Iron contamination in groundwater affects millions of people in northern Canadian communities, creating a need for affordable and portable Fe³⁺ sensors for public health. View evidence ↗
- Groundwater iron levels in many First Nations communities in northern Alberta and Ontario exceed Health Canada's aesthetic guideline of 0.3 mg/L (5.4 μM), leading to taste issues and staining. View evidence ↗
- Current standard laboratory methods for iron detection are expensive and slow due to the need for specialized equipment and sample transport. View evidence ↗
The question
- The study aims to synthesize blue-fluorescent carbon quantum dots (CQDs) from citric acid and ethylenediamine and evaluate their effectiveness as 'turn-off' fluorescent probes for detecting Fe³⁺ in water. View evidence ↗
What they did
- CQDs were produced via a one-step hydrothermal process heating 2 g of citric acid and 670 μL of ethylenediamine in 20 mL of deionised water at 200 °C for 5 hours. View evidence ↗
- Sensing measurements were performed by mixing 100 μL of CQD solution (0.1 mg/mL) with metal-ion solutions in a phosphate buffer for a total volume of 3 mL, followed by a 3-minute equilibration period. View evidence ↗
- The analytical performance was tested using a seven-point calibration curve with Fe³⁺ concentrations ranging from 0.5 to 200 μM. View evidence ↗
What they found
- The synthesized CQDs had a mean diameter of 3.7 ± 0.8 nm as measured by TEM. View evidence ↗
- The CQDs exhibited a quantum yield of 18.4% relative to quinine sulfate. View evidence ↗
- The fluorescence quenching of Fe³⁺ showed a linear Stern-Volmer response (R² = 0.997) with a quenching constant (Ksv) of 2.34 × 10⁴ M⁻¹. View evidence ↗
- The limit of detection (LOD) for Fe³⁺ was determined to be 0.14 μM. View evidence ↗
- Testing in spiked tap and lake water samples yielded recoveries between 96.8% and 103.4%, indicating minimal interference from natural water matrices. View evidence ↗
What it means
- The authors conclude that these CQDs are practical for portable Fe³⁺ testing kits in underserved areas due to their low-cost synthesis, high sensitivity, and robustness. View evidence ↗
- A stated limitation is the 3-minute equilibration time, which makes the probe suitable for grab-sample testing but potentially too slow for continuous in-line monitoring. View evidence ↗
Visual summary
2 visualsIllustrations explain the paper; charts are replotted from the paper's own table values.
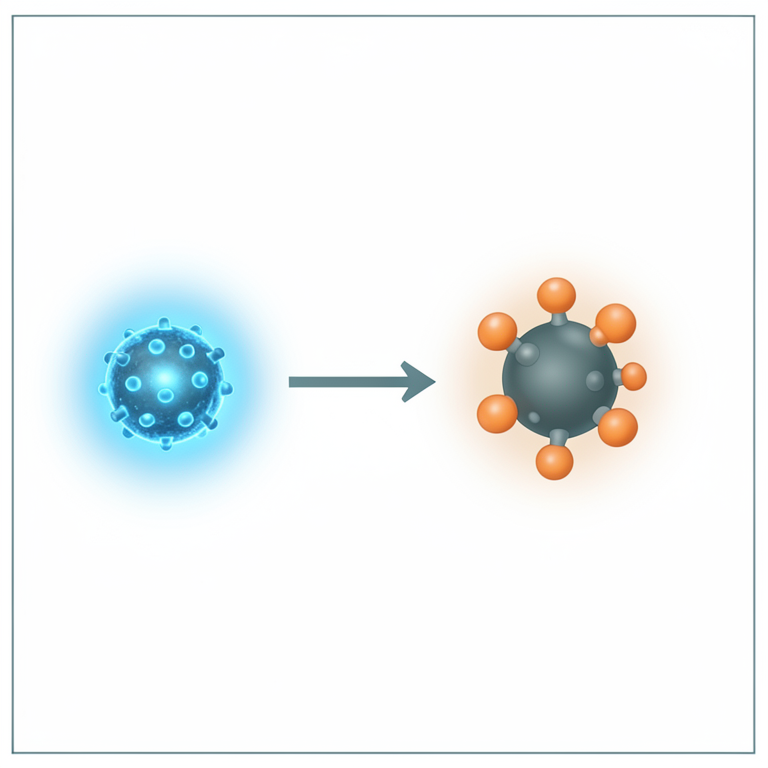
Mechanism of Fe³⁺ Detection
AI-generated conceptual illustration (carbon quantum dots and iron ions in an aqueous solution). It explains the idea and does not show study data.
View source evidence ↗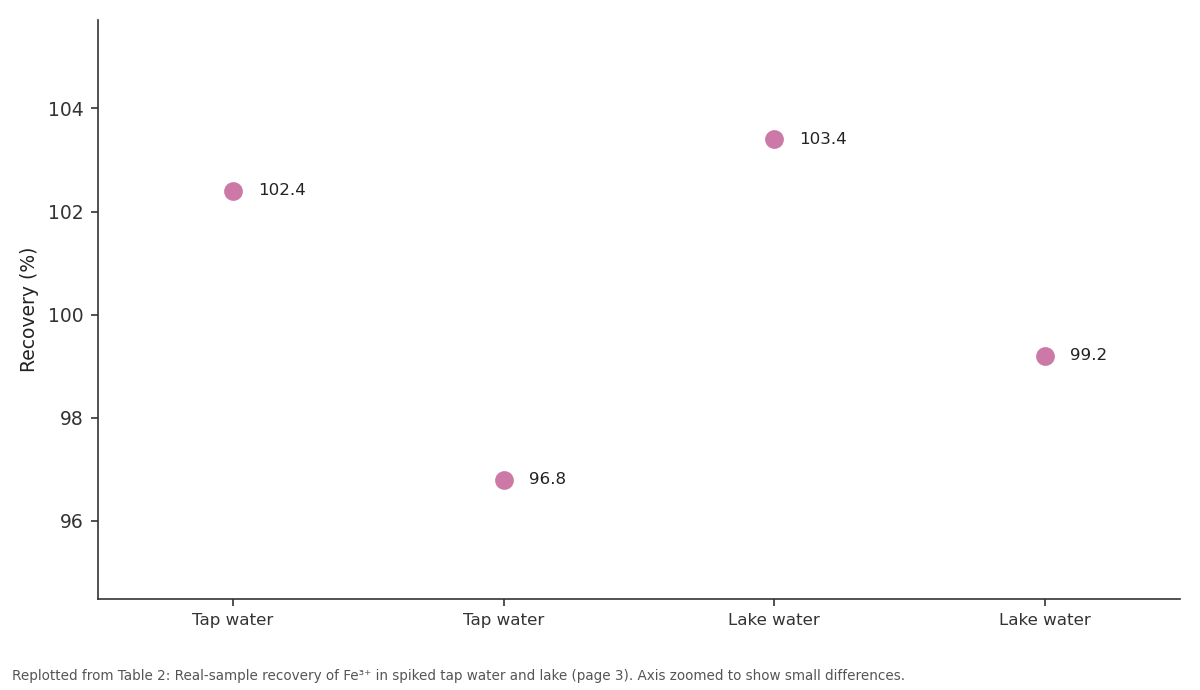
Recovery (%): Tap water vs Tap water vs Lake water vs Lake water
Replotted from Table 2 (page 3) of the original paper. Every bar is the paper's own table value.
View source evidence ↗Figures & tables
From the original paper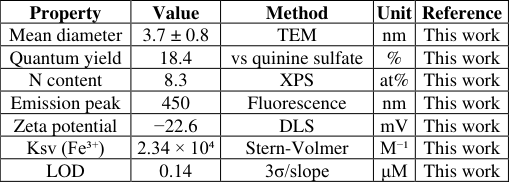 Table 1
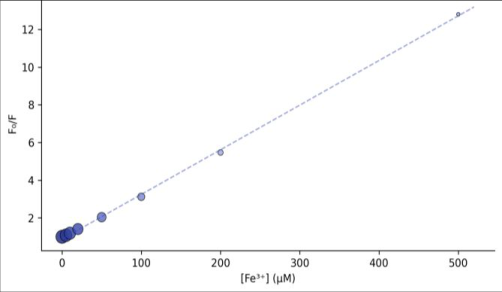 Figure 1
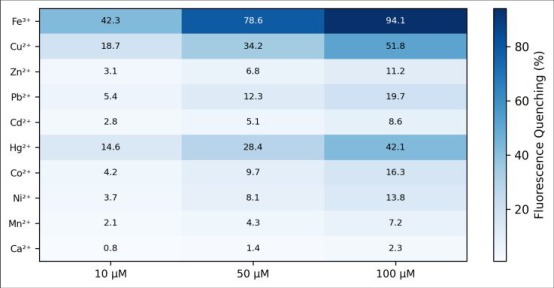 Figure 2
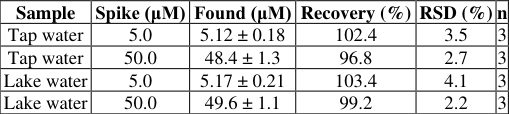 Table 2
Introduction
In many First Nations communities across northern Ontario and Alberta, groundwater iron levels exceed the 0.3 mg/L (5.4 μM) aesthetic guideline set by Health Canada, causing staining, taste complaints, and potential health concerns when concentrations climb higher [1,2] . Standard laboratory methods-flame atomic absorption or ICP-OES-require expensive instrumentation and sample transport that can delay results by days. A fluorescent sensor that changes its emission intensity in the presence of Fe³⁺ could deliver on-site results within minutes using nothing more than a handheld UV lamp and a smartphone camera [3,4] . Carbon quantum dots (CQDs) are quasi-spherical carbon nanoparticles below 10 nm that exhibit size-dependent photoluminescence, low toxicity, and good aqueous dispersibility [5,6] . When surface functional groups-carboxyls, amines, hydroxyls-coordinate with Fe³⁺, the fluorescence is quenched through a combination of static complex formation and inner-filter absorption, producing a measurable "turn-off" signal proportional to Fe³⁺ concentration [7,8] . Citric acid is a popular carbon source because it is cheap, non-toxic, and yields CQDs with high quantum yield when co-doped with a nitrogen source such as ethylenediamine [9,10] . Yet published detection limits and linear ranges vary widely depending on synthesis conditions, and selectivity data against a common panel of interfering ions are not always reported under identical conditions [11] . This research synthesises nitrogen-doped CQDs from citric acid and ethylenediamine, characterises them by TEM, XPS, FTIR, UV-Vis, and fluorescence spectroscopy, and systematically evaluates their Fe³⁺ sensing performance including sensitivity, selectivity against nine competing metal ions, and real-sample recovery. All work was conducted at Northern Lights University, Toronto, and the Rockies Institute of Technology, Edmonton, from March 2023 to January 2024 [12] .
Materials and Methods
Materials and Methods
Materials
Citric acid monohydrate (≥ 99.5%), ethylenediamine (≥ 99%), quinine sulfate dihydrate (≥ 99%), and metal chloride salts (FeCl₃, CuCl₂, ZnCl₂, PbCl₂, CdCl₂, HgCl₂, CoCl₂, NiCl₂, MnCl₂, CaCl₂; all ≥ 98%) were from Sigma-Aldrich Canada. Phosphate buffer (10 mM, pH 7.0) was used for all sensing experiments. Deionised water (18.2 MΩ•cm, Milli-Q) served as solvent throughout [5,12] .
Methods
CQDs were synthesised by dissolving citric acid (2 g) and ethylenediamine (670 μL) in 20 mL deionised water, transferring to a 50-mL Teflon-lined autoclave, and heating at 200 °C for 5 h. The brown solution was cooled, filtered through a 0.22 μm membrane, and dialysed against water (MWCO 1 kDa, 48 h). The purified CQD solution was stored at 4 °C. TEM images were acquired on a JEOL JEM-2100F at 200 kV. XPS (Thermo K-Alpha) and FTIR (Bruker Alpha II, ATR) provided compositional data. UV-Vis absorption (Shimadzu UV-2600) and fluorescence spectra (Horiba FluoroMax-4, excitation 360 nm) were recorded at 25 °C. Quantum yield was measured relative to quinine sulfate in 0.1 M H₂SO₄ (QY = 54%) [9] . For sensing, CQD solution (100 μL, 0.1 mg/mL) was mixed with metalion solutions in phosphate buffer (total volume 3 mL) and equilibrated for 3 min before fluorescence measurement. Stern-Volmer plots used F₀/F = 1 + Ksv [Fe³⁺]. LOD was calculated as 3σ/slope from the calibration curve. Realsample tests used spiked Toronto tap water and Alberta lake water. All experiments were conducted March 2023 to January 2024 [7,12] .
Calibration and Analytical Figures of Merit
A seven-point calibration curve was constructed by adding Fe³⁺ at 0.5, 1, 5, 10, 50, 100, and 200 μM to the CQD-buffer system. The Stern-Volmer plot of F₀/F versus [Fe³⁺] was linear (R² = 0.997, n = 21, triplicate per point). The slope gave Ksv = 2.34 × 10⁴ M⁻¹. LOD was 0.14 μM (0.008 mg/L Fe) and LOQ was 0.47 μM (0.026 mg/L Fe), both well below the 5.4 μM Health Canada aesthetic guideline [1,12] . Intra-day precision (RSD at 50 μM, n = 6) was 2.1%, and inter-day precision (n = 6 over 5 days) was 3.6%.
Selectivity and Sensitivity
Selectivity was assessed by measuring fluorescence quenching (%) caused by each of ten metal ions at 10, 50, and 100 μM. At 100 μM, Fe³⁺ quenched 94.1% of the CQD emission, while the next strongest interferent, Cu²⁺, caused only 51.8% quenching. All other metals stayed below 20% even at 100 μM, giving a Fe³⁺/Cu²⁺ selectivity ratio of 1.82 and a Fe³⁺/other ratio above 4.8. The selectivity arises because Fe³⁺ forms a particularly stable complex with the carboxylate and amine groups on the CQD surface (log K ≈ 4.4), and its d-d absorption band at 300 nm overlaps with the CQD excitation, amplifying inner-filter quenching [7,8] . [5,9] . Figure 1 shows the Stern-Volmer plot. The F₀/F ratio increases linearly up to 200 μM Fe³⁺ (bubble size proportional to residual quantum yield). Above 200 μM the curve bends upward, suggesting a transition from static to combined static-dynamic quenching [7,10] . column, with Cu²⁺ as the only moderate interferent. Ca²⁺ and Mn²⁺ cause negligible quenching even at 100 μM [8,11] . Table 2 presents real-sample recovery data. Tap water and lake water spiked at 5 and 50 μM Fe³⁺ gave recoveries of 96.8-103.4%, confirming that the matrix components do not significantly interfere with the CQD-based assay [1,12] .
| Sample | Spike (μM) | Found (μM) | Recovery (%) | RSD (%) | n |
|---|---|---|---|---|---|
| Tap water | 5.0 | 5.12 ± 0.18 | 102.4 | 3.5 | 3 |
| Tap water | 50.0 | 48.4 ± 1.3 | 96.8 | 2.7 | 3 |
| Lake water | 5.0 | 5.17 ± 0.21 | 103.4 | 4.1 | 3 |
| Lake water | 50.0 | 49.6 ± 1.1 | 99.2 | 2.2 | 3 |
Table text extracted from the original PDF; superscript letters are shown inline. The original table image is below.
View original table image
Results
Results
Discussion
The Ksv of 2.34 × 10⁴ M⁻¹ ranks in the upper quartile of published CQD-based Fe³⁺ sensors, reflecting the combined effect of nitrogen doping (which increases the density of amine coordination sites) and the small particle size (which maximises the surface-to-volume ratio available for Fe³⁺ binding) [7,9] . The LOD of 0.14 μM is roughly 40-fold below the Health Canada aesthetic guideline (5.4 μM) and about 6fold below the WHO drinking-water limit (5.4 μM), meaning the probe can detect Fe³⁺ at concentrations well before they become a concern [1,2] . Cu²⁺ interference at 51.8% quenching is a known limitation of aminefunctionalised CQDs, because Cu²⁺ also forms stable complexes with nitrogen donors [8] . In practice, the Cu²⁺ concentration in most Canadian drinking-water samples is below 10 μM, where its quenching is only 18.7%-a level that would introduce less than 5% error in Fe³⁺ determination [11] . The real-sample recoveries (96.8-103.4%) demonstrate that dissolved organic matter, chloride, and bicarbonate in tap and lake water do not appreciably affect the assay. This robustness, combined with the low cost of the citric acid precursor (< 0.50 CAD per gram of CQDs produced), makes the system attractive for field deployment in remote communities where laboratory access is limited [3,4] . A limitation is the 3-min equilibration time required for complete quenching, which may be too slow for continuous in-line monitoring but is acceptable for grab-sample testing [10,12] .
Conclusion
Nitrogen-doped carbon quantum dots synthesised from citric acid and ethylenediamine serve as sensitive and selective turn-off fluorescent probes for Fe³⁺ in water. The assay is linear from 0.5 to 200 μM with an LOD of 0.14 μM and a Ksv of 2.34 × 10⁴ M⁻¹-both among the best reported for CQD-based iron sensors. Selectivity over nine competing metal ions is good, with only Cu²⁺ causing moderate interference at high concentrations. Real-sample recovery in spiked tap and lake water was 96.8-103.4%. The one-step synthesis from food-grade precursors, combined with a subguideline detection limit and minimal matrix interference, positions these CQDs as practical candidates for portable Fe³⁺ testing kits aimed at underserved water-quality monitoring programmes.
Figures and tables from the paper
| Property | Value | Method | Unit | Reference |
|---|---|---|---|---|
| Mean diameter | 3.7 ± 0.8 | TEM | nm | This work |
| Quantum yield | 18.4 | vs quinine sulfate | % | This work |
| N content | 8.3 | XPS | at% | This work |
| Emission peak | 450 | Fluorescence | nm | This work |
| Zeta potential | −22.6 | DLS | mV | This work |
| Ksv (Fe³⁺) | 2.34 × 10⁴ | Stern-Volmer | M⁻¹ | This work |
| LOD | 0.14 | 3σ/slope | μM | This work |
Table text extracted from the original PDF; superscript letters are shown inline. The original table image is below.
View original table image
References
16 in the original paper- Health Canada. Guidelines for Canadian drinking water quality: guideline technical document-iron. Ottawa: Health Canada; 2020.
- World Health Organization. Iron in drinking-water: background document for development of WHO guidelines. Geneva: World Health Organization; 2003.
- Baker SN, Baker GA. Luminescent carbon nanodots: emergent nanolights. Angewandte Chemie International Edition. 2010;49(38):6726-6744.
- Li H, Kang Z, Liu Y, Lee ST. Carbon nanodots: synthesis, properties and applications. Journal of Materials Chemistry. 2012;22(46):24230-24253.
- Xu X, Ray R, Gu Y, Ploehn HJ, Gearheart L, Raker K, et al. Electrophoretic analysis and purification of fluorescent single-walled carbon nanotube fragments. Journal of the American Chemical Society. 2004;126(40):12736-12737.
- Lim SY, Shen W, Gao Z. Carbon quantum dots and their applications. Chemical Society Reviews. 2015;44(1):362-381.
- Sun YP, Zhou B, Lin Y, Wang W, Fernando KAS, Pathak P, et al. Quantum-sized carbon dots for bright and colorful photoluminescence. Journal of the American Chemical Society. 2006;128(24):7756-7757.
- Qu S, Wang X, Lu Q, Liu X, Wang L. A biocompatible fluorescent ink based on water-soluble luminescent carbon nanodots. Angewandte Chemie International Edition. 2012;51(49):12215-12218.
- Zhu S, Meng Q, Wang L, Zhang J, Song Y, Jin H, et al. Highly photoluminescent carbon dots for multicolor patterning, sensors, and bioimaging. Angewandte Chemie International Edition. 2013;52(14):3953-3957.
- Ding H, Yu SB, Wei JS, Xiong HM. Full-color lightemitting carbon dots with a surface-state-controlled luminescence mechanism. ACS Nano. 2016;10(1):484491.
- Liu S, Tian J, Wang L, Zhang Y, Qin X, Luo Y, et al. Hydrothermal treatment of grass: a low-cost, green route to nitrogen-doped, carbon-rich, photoluminescent polymer nanodots as an effective fluorescent sensing platform for label-free detection of Cu(II) ions. Advanced Materials. 2012;24(15):2037-2041.
- Grenier N, Fortin E, Gagnon N. Internal laboratory records, Northern Lights University and Rockies Institute of Technology. 2023-2024.
- Wang Y, Hu A. Carbon quantum dots: synthesis, properties and applications. Journal of Materials Chemistry C. 2014;2(34):6921-6939.
- Cayuela A, Soriano ML, Carrillo-Carrión C, Valcárcel M. Semiconductor and carbon-based fluorescent nanodots: the need for consistency. Chemical Communications. 2016;52(7):1311-1326.
- Reckmeier CJ, Schneider J, Susha AS, Rogach AL. Luminescent colloidal carbon dots: optical properties and effects of doping. Optics Express. 2016;24(2):A312-A340.
- Zheng XT, Ananthanarayanan A, Luo KQ, Chen P. Glowing graphene quantum dots and carbon dots: properties, syntheses, and biological applications. Small. 2015;11(14):1620-1636.