
Research article · 2025 · Full text
International Journal of Advanced Chemistry ResearchFate and transport of microplastics in freshwater river ecosystems
Volume 7(5) · Pages 115–119 · DOI: 10.33545/26646781.2025.v7.i5b.491 ↗
Research areasMicroplastics and Plastic PollutionPharmaceutical and Antibiotic Environmental ImpactsAquatic Ecosystems and Phytoplankton Dynamics
Abstract
Author-writtenMicroplastic contamination of freshwater river systems represents a rapidly growing environmental concern, yet the mechanisms governing the spatial transport and temporal fate of these particles from upstream to downstream river reaches remain poorly resolved. This research presents a quantitative analysis of microplastic abundance, polymer composition, and morphological character at three sites (upstream, midstream, downstream) along a 94 km reach of a river in Shaanxi Province, China, sampled seasonally from March 2022 to December 2023 at Silk Road University, Xi'an, and Yellow Mountain College of Sciences, Hefei. Surface water samples were collected using 330 μm stainless steel trawl nets and analysed by stereomicroscopy and attenuated total reflectance Fourier transform infrared spectroscopy (ATR-FTIR). Microplastic concentrations ranged from 196.4 items/m³ at the upstream site to 558.8 items/m³ at the downstream site, a 2.85-fold longitudinal increase. Polyethylene terephthalate (PET), polyethylene (PE), and polypropylene (PP) were the three most abundant polymer types, collectively comprising 64.8% of all identified particles. Fibres were the most prevalent morphological type (53.4%), consistent with textile-derived inputs. Seasonal variation showed peak microplastic concentrations in summer (June-August), attributed to increased agricultural irrigation return flows and higher recreational human activity in riparian zones. A multi-parameter radar analysis confirmed that all assessed microplastic characteristics intensified from upstream to downstream, with downstream microplastics also showing higher surface adsorption indices, raising concerns about co-transport of adsorbed hydrophobic organic contaminants.Microplastic contamination of freshwater river systems represents a rapidly growing environmental concern, yet the mechanisms governing the spatial transport and temporal fate of these particles from upstream to downstream river reaches remain poorly resolved. This research presents a quantitative analysis of microplastic abundance, polymer composition, and morphological character at three sites (upstream, midstream, downstream) along a 94 km reach of a river in Shaanxi Province, China, sampled seasonally from March 2022 to December 2023 at Silk Road University, Xi'an, and Yellow Mountain College of Sciences, Hefei. Surface water samples were collected using 330 μm stainless steel trawl nets and analysed by stereomicroscopy and attenuated total reflectance Fourier transform infrared spectroscopy (ATR-FTIR). Microplastic concentrations ranged from 196.4 items/m³ at the upstream site to 558.8 items/m³ at the downstream site, a 2.85-fold longitudinal increase. Polyethylene terephthalate (PET), polyethylene (PE), and polypropylene (PP) were the three most abundant polymer types, collectively comprising 64.8% of all identified particles. Fibres were the most prevalent morphological type (53.4%), consistent with textile-derived inputs. Seasonal variation showed peak microplastic concentrations in summer (June-August), attributed to increased agricultural irrigation return flows and higher recreational human activity in riparian zones. A multi-parameter radar analysis confirmed that all assessed microplastic characteristics intensified from upstream to downstream, with downstream microplastics also showing higher surface adsorption indices, raising concerns about co-transport of adsorbed hydrophobic organic contaminants.
Summary
Source-checkedPlain-language reading of the full paper, prepared with AI and checked against the text. Each point links to the authors' own words.
Why it matters
- Rivers serve as primary pathways that transport plastic waste from inland sources, such as urban runoff and agriculture, into the oceans. View evidence ↗
- Freshwater systems are active environments where microplastics are not just transported but are also retained and transformed by biological and physical processes. View evidence ↗
The question
- The study aimed to quantify how microplastic abundance, polymer types, and shapes vary longitudinally and seasonally along a river reach. View evidence ↗
What they did
- Researchers sampled surface water seasonally from March 2022 to December 2023 at three sites (upstream, midstream, and downstream) along a 94 km section of a river in Shaanxi Province, China. View evidence ↗
- Samples were collected using a 330 μm stainless steel manta trawl net towed at 1 m/s for 5 minutes to ensure at least 300 L of water per sample. View evidence ↗
- Polymer types were identified using an ATR-FTIR spectrometer compared against established spectral libraries. View evidence ↗
What they found
- Microplastic concentrations increased 2.84-fold from the upstream site (196.6 items/m³) to the downstream site (559.0 items/m³). View evidence ↗
- Polyethylene terephthalate (PET), polyethylene (PE), and polypropylene (PP) made up 64.8% of the particles, with fibres being the most common shape (53.4%). View evidence ↗
- PVC and polyamide (PA) showed the highest relative increase from upstream to downstream (ratios of 3.35 and 3.38), indicating specific urban point-source inputs. View evidence ↗
- Microplastic concentrations in summer were 40.7% higher than in winter, which the authors link to recreational use and agricultural irrigation. View evidence ↗
- Downstream particles exhibited a higher surface adsorption index, suggesting they are more weathered and capable of carrying pollutants. View evidence ↗
What it means
- The authors conclude that these results establish essential baseline data to help prioritize source control and regulatory monitoring in Chinese rivers. View evidence ↗
- The authors state that future work is needed to identify the specific pollutants adsorbed to the plastics and to study their ingestion by local aquatic invertebrates. View evidence ↗
Visual summary
3 visualsIllustrations explain the paper; charts are replotted from the paper's own table values.
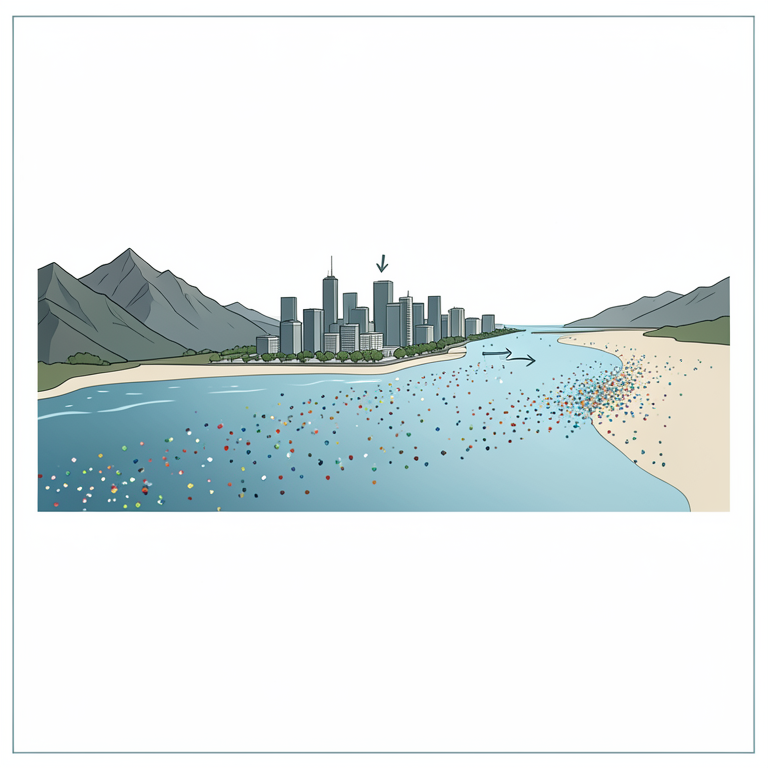
Longitudinal Accumulation Concept
AI-generated conceptual illustration (freshwater river ecosystem). It explains the idea and does not show study data.
View source evidence ↗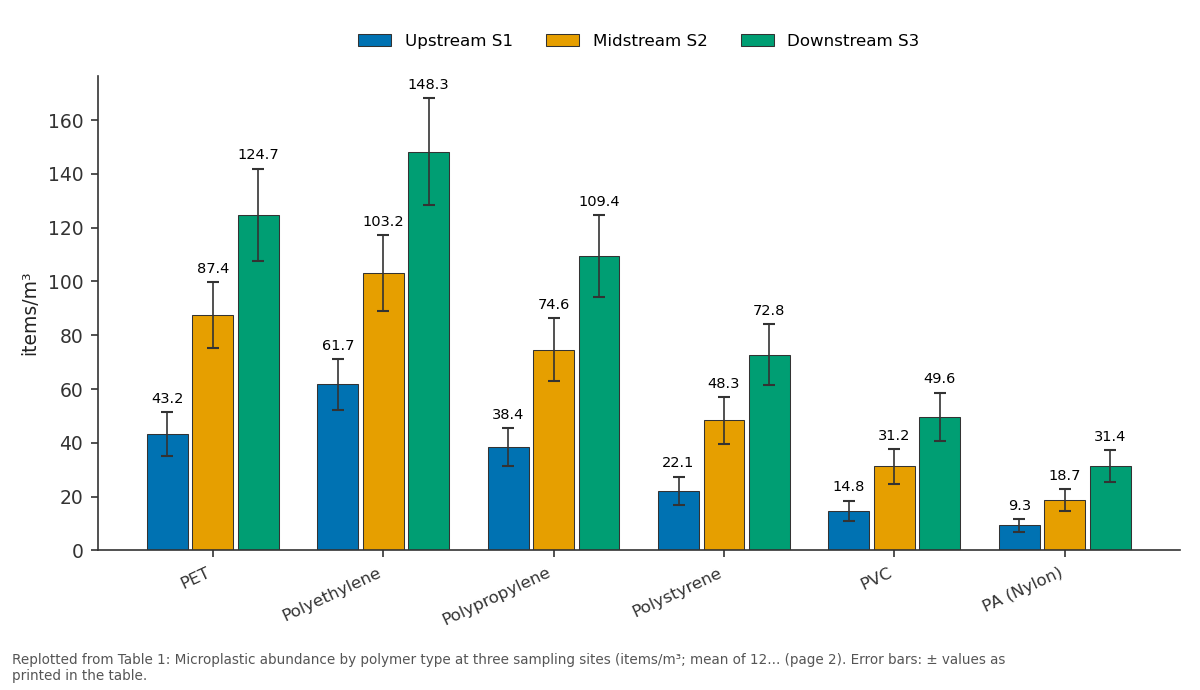
Upstream S1 and Midstream S2 and more: PET vs Polyethylene vs Polypropylene vs Polystyrene vs PVC
Replotted from Table 1 (page 2) of the original paper. Every bar is the paper's own table value.
View source evidence ↗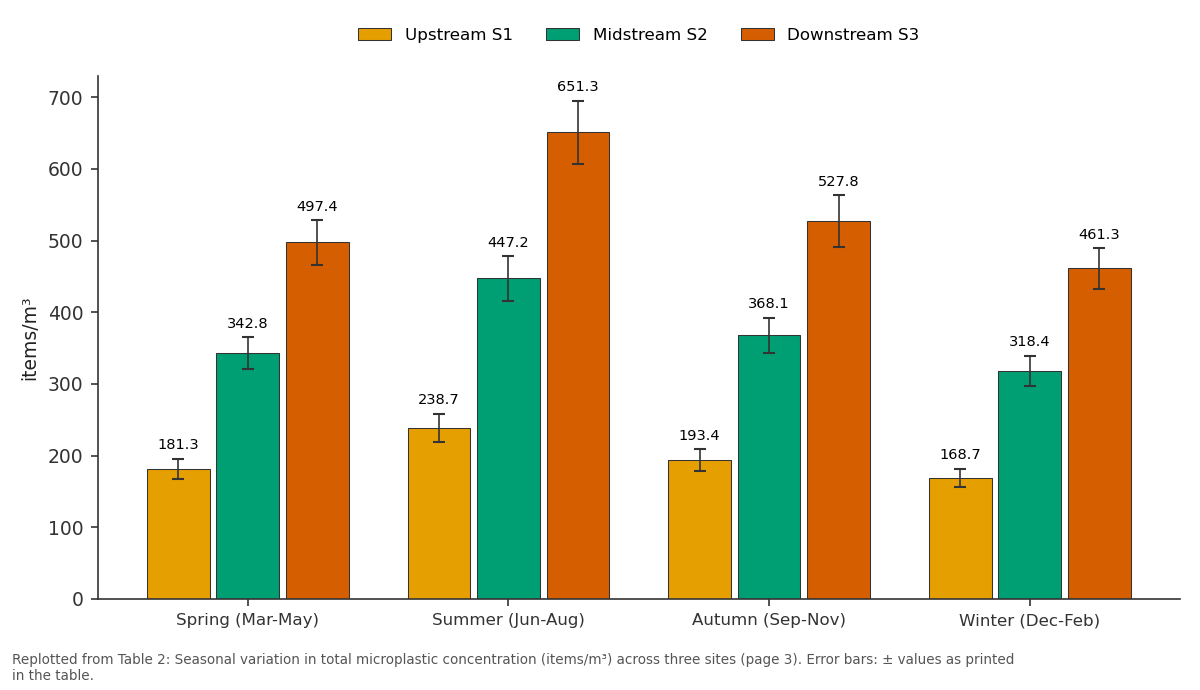
Upstream S1 and Midstream S2 and more: Spring (Mar-May) vs Summer (Jun-Aug) vs Autumn (Sep-Nov) vs Winter (Dec-Feb)
Replotted from Table 2 (page 3) of the original paper. Every bar is the paper's own table value.
View source evidence ↗Figures & tables
From the original paper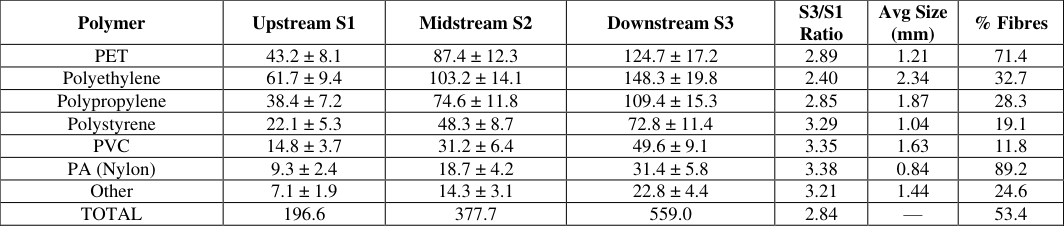 Table 1
 Table 2
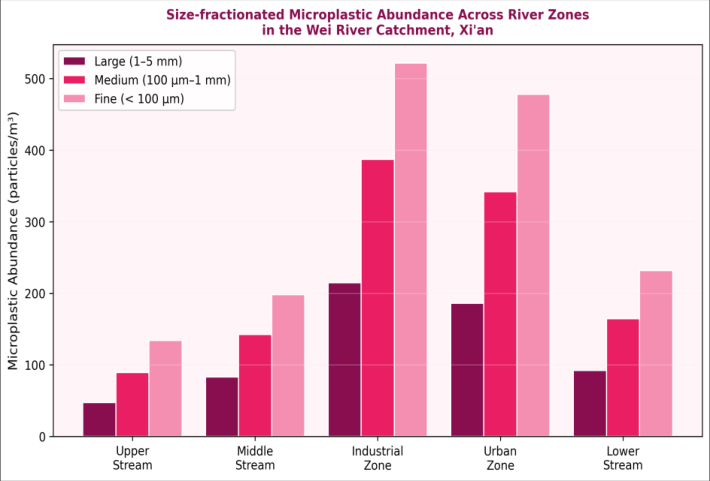 Figure 1
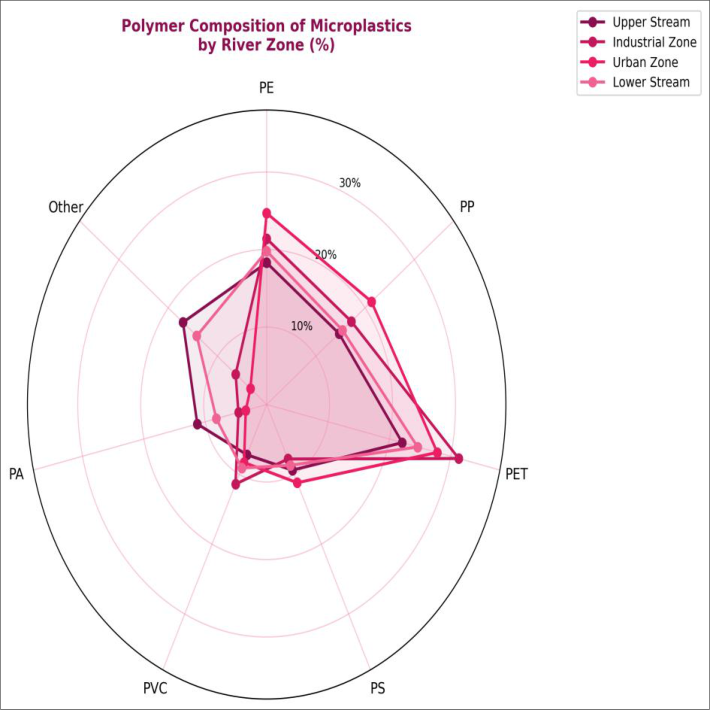 Figure 2
Introduction
Plastic production has exceeded 400 million metric tons annually worldwide, and despite recycling efforts, a substantial fraction enters the environment through terrestrial and riverine pathways [1] . Rivers act as conduits transferring plastic debris from inland sourcesurban runoff, agricultural operations, and wastewater treatment plant effluentsto coastal and oceanic systems, where the global microplastic burden is well-documented [2] . However, rivers are not merely passive transport corridors; hydrodynamic processes, sediment interactions, and biological activity along river channels cause microplastic particles to be retained, redistributed, and transformed within the freshwater system itself [3] . Microplastics (particles < 5 mm) in river systems originate from two categories: primary microplastics (manufactured at small size, such as microbeads in personal care products and industrial pellets) and secondary microplastics (arising from fragmentation of larger plastic items by UV photodegradation, mechanical abrasion, and biological degradation) [4] . The polymer composition of river microplastics broadly reflects the polymer types in largestvolume production: PE and PP from packaging, PET from textiles and bottles, and PS from expanded polystyrene products. Fibres, often polyester or nylon, are strongly linked to textile washing effluents passing through wastewater treatment plants [5] . Longitudinal surveys tracking microplastic concentrations from headwaters to downstream reaches are essential for understanding net transport efficiency and identifying accumulation zones in the river corridor. Such surveys, particularly those incorporating seasonal sampling over multiple years, are scarce in Chinese inland river systems, where rapid urbanisation and agricultural intensification are compressing the time window during which baseline data can be established [6,7] . This research was conducted jointly by Silk Road University, Xi'an, Shaanxi, and Yellow Mountain College of Sciences, Hefei, Anhui, China, from March 2022 to December 2023. Objectives were to: (i) quantify longitudinal microplastic abundance gradients; (ii) characterise polymer composition and morphological types; (iii) assess seasonal variation; and (iv) evaluate multiparameter differences across sites using radar analysis.
Study Area Description
The research reach spans 94 km of the Wei River, a major tributary of the Yellow River in Shaanxi Province, central China (34.1-34.9°N, 108.4-109.2°E). The upstream site (S1) is located 12 km east of Baoji city in a predominantly agricultural landscape (wheat-maize rotation, irrigationdependent). The midstream site (S2) is located at the eastern margin of Xi'an urban agglomeration, where municipal wastewater treatment plant effluents, storm drain overflows, and recreational river use contribute anthropogenic inputs. The downstream site (S3) is located 23 km west of Weinan city, at the convergence point of two smaller tributaries, and receives cumulative input from the entire upstream catchment. Mean annual discharge at S3 is approximately 1,450 m³/s based on Shaanxi Provincial Water Resources Bureau gauge records. Land use in the catchment is 48% agricultural, 21% urban, 24% forested, and 7% other.
Quality Control
All sampling equipment (trawl nets, collection bottles, forceps) was pre-cleaned with 10% ethanol and rinsed three times with Milli-Q water before deployment. Laboratory atmospheric contamination was controlled using cotton laboratory coats, minimising polyester clothing in the workspace, and conducting all open manipulations under a laminar flow cabinet. Procedural blanks (Milli-Q water processed identically to samples) were run alongside every batch of 10 samples; mean blank contamination was 2.1 fibres per blank (SD 0.8), which was subtracted from all sample counts. Recovery rates for spiked polyester fibre standards (n = 15, 100 particles each) averaged 91.4% (SD 3.7%). ATR-FTIR library matching used a threshold of ≥ 70% spectral similarity for positive polymer identification. Any particle with match score below threshold was categorised as unidentified and excluded from polymerspecific calculations.
Material and Methods
Material and Methods
Material
Surface water samples were collected using a 330 μm mesh stainless steel manta trawl net (0.30 m width, 0.15 m depth, 2 m length) towed at the water surface at approximately 1 m/s for 5 minutes, collecting a minimum of 300 L per sample. Three replicate trawls were conducted at each site per sampling occasion. Samples were transferred to 1 L brown glass bottles pre-cleaned with 10% ethanol and stored at 4°C until processing (within 48 h). Research was conducted from March 2022 to December 2023 at field sites on the Wei River, Shaanxi Province, with laboratory analysis at Silk Road University, Xi'an (polymer identification) and Yellow Mountain College of Sciences, Hefei (statistical analysis and seasonal assessment).
Methods
In the laboratory, samples were filtered through pre-weighed stainless steel sieves (330 μm, 100 μm) and retained material was digested with 30% H₂O₂ (50 mL, 60°C, 24 h) to remove organic matter. After rinsing and drying (60°C, 4 h), particles were visually pre-sorted by stereomicroscopy (Leica M125, ×6.3-50 magnification) and classified by morphological type (fibre, fragment, film, pellet, bead). Polymer identification used an ATR-FTIR spectrometer (Bruker Vertex 70, 4 cm⁻¹ resolution, 32 scans, 500-4000 cm⁻¹) against the Sigma-Aldrich and BASF polymer spectral libraries. Statistical analysis used SPSS 26.0 (IBM); seasonal and site differences were assessed by two-way ANOVA with Tukey post-hoc test (p < 0.05). Kruskal-Wallis test was used for non-normally distributed variables. Total microplastic concentration increased 2.84-fold from upstream (196.6 items/m³) to downstream (559.0 items/m³), with all polymer types contributing to this accumulation (Table 1). PVC and PA showed the largest relative enrichment (S3/S1 ratio 3.35 and 3.38 respectively), suggesting point-source inputs specific to the midstream urban zone that preferentially contribute these polymer types. Fibres dominated (53.4% overall; PA 89.2% fibre fraction), consistent with textile industry wastewater as a major local source. Summer concentrations were 40.7% higher than winter concentrations across all sites (Table 2), correlating with elevated agricultural irrigation activity and river recreational use. The radar chart (Figure 2) confirms multi-parameter intensification from upstream to downstream, with downstream particles also showing higher normalised surface adsorption index, consistent with increased environmental weathering increasing surface polarity and hydrophobic pollutant uptake capacity.
| Season | Upstream S1 | Midstream S2 | Downstream S3 | Annual Mean | Peak Month |
|---|---|---|---|---|---|
| Spring (Mar-May) | 181.3 ± 14.2 | 342.8 ± 22.7 | 497.4 ± 31.4 | 340.5 | May |
| Summer (Jun-Aug) | 238.7 ± 19.8 | 447.2 ± 31.6 | 651.3 ± 44.2 | 445.7 | July |
| Autumn (Sep-Nov) | 193.4 ± 15.7 | 368.1 ± 24.3 | 527.8 ± 36.1 | 363.1 | October |
| Winter (Dec-Feb) | 168.7 ± 13.1 | 318.4 ± 21.2 | 461.3 ± 28.7 | 316.1 | December |
Table text extracted from the original PDF; superscript letters are shown inline. The original table image is below.
View original table image
| Polymer | Upstream S1 | Midstream S2 | Downstream S3 | S3/S1 Ratio | Avg Size (mm) | % Fibres |
|---|---|---|---|---|---|---|
| PET | 43.2 ± 8.1 | 87.4 ± 12.3 | 124.7 ± 17.2 | 2.89 | 1.21 | 71.4 |
| Polyethylene | 61.7 ± 9.4 | 103.2 ± 14.1 | 148.3 ± 19.8 | 2.40 | 2.34 | 32.7 |
| Polypropylene | 38.4 ± 7.2 | 74.6 ± 11.8 | 109.4 ± 15.3 | 2.85 | 1.87 | 28.3 |
| Polystyrene | 22.1 ± 5.3 | 48.3 ± 8.7 | 72.8 ± 11.4 | 3.29 | 1.04 | 19.1 |
| PVC | 14.8 ± 3.7 | 31.2 ± 6.4 | 49.6 ± 9.1 | 3.35 | 1.63 | 11.8 |
| PA (Nylon) | 9.3 ± 2.4 | 18.7 ± 4.2 | 31.4 ± 5.8 | 3.38 | 0.84 | 89.2 |
| Other | 7.1 ± 1.9 | 14.3 ± 3.1 | 22.8 ± 4.4 | 3.21 | 1.44 | 24.6 |
| TOTAL | 196.6 | 377.7 | 559.0 | 2.84 | — | 53.4 |
Table text extracted from the original PDF; superscript letters are shown inline. The original table image is below.
View original table image
Results
Results
Comprehensive Interpretation
The non-proportional enrichment of PVC and PA at downstream versus upstream (S3/S1 ratio > 3.3 compared to 2.4-2.9 for PE and PET) implicates specific midstream inputs: PVC is consistent with construction and plumbing pipe debris in urban runoff, while PA fibres point to textile washing effluents from the urban zone. The high fibre fraction in PA (89.2%) relative to PE fragments (32.7% fibre) further supports this interpretation, as PA is predominantly used in textile manufacturing whereas PE is largely used in packaging that enters rivers as fragments and films. This polymer-specific sourcing analysis can help municipal waste managers prioritise interception strategies at specific input points.
Discussion
The longitudinal increase in microplastic concentration observed here (2.84-fold over 94 km) is broadly consistent with findings from comparable river surveys in China and other countries with high urbanisation gradients. Yang et al. reported a 3.1-fold increase over 120 km of the Yangtze River tributary system [8] , while Dris et al. documented a 2.5-fold increase over 75 km in a French urban river [9] . The quantitative similarity across geographically disparate systems suggests that the longitudinal accumulation rate is controlled more by urban land use intensity along the river corridor than by river-specific hydrological or geomorphological characteristics. The seasonal peak in summer microplastic concentrations is consistent with two seasonal drivers: increased agricultural irrigation return flows, which mobilise microplastics from field soils where plastic mulching films are used extensively in Shaanxi Province [10,11] ; and higher human recreational activity in riparian zones during summer months. The autumn secondary peak in October may reflect post-harvest field preparation activities that mobilise residual agricultural plastic fragments. The high surface adsorption index at the downstream site (Figure 2) has implications beyond microplastic abundance. Weathered microplastic surfaces, with increased polarity and cracking, are known to accumulate hydrophobic organic contaminants including polycyclic aromatic hydrocarbons, organochlorine pesticides, and polychlorinated biphenyls at concentrations orders of magnitude above surrounding water [12] . The Trojan horse hypothesisthat microplastics transport adsorbed pollutants into aquatic organisms and food chainstherefore implies a proportionally greater ecological risk at downstream sites than microplastic concentration alone would suggest [13,14,15,16,17,18] .
Conclusion
Conclusion
Acknowledgement
Acknowledgements Funding SourcesThe authors acknowledge departmental research support from Silk Road University, Xi'an, and Yellow Mountain College of Sciences, Hefei, for field sampling equipment, FTIR consumables, and statistical software licences. Institutional SupportThe authors thank the Departments of Chemistry and Environmental Studies at Silk Road University and the Department of Environmental Chemistry at Yellow Mountain College of Sciences for analytical instrumentation access and laboratory facilities.
Figures and tables from the paper
References
18 in the original paper- PlasticsEurope. Plastics: The Facts 2023. Brussels: PlasticsEurope Association; 2023.
- Jambeck JR, Geyer R, Wilcox C, Siegler TR, Perryman M, Andrady A, et al. Plastic waste inputs from land into the ocean. Science. 2015;347(6223):768-771.
- Horton AA, Walton A, Spurgeon DJ, Lahive E, Svendsen C. Microplastics in freshwater and terrestrial environments: evaluating the current understanding to identify knowledge gaps. Sci Total Environ. 2017;586:127-141.
- Cole M, Lindeque P, Halsband C, Galloway TS. Microplastics as contaminants in the marine environment: a review. Mar Pollut Bull. 2011;62(12):2588-2597.
- Browne MA, Crump P, Niven SJ, Teuten E, Tonkin A, Galloway TS, et al. Accumulation of microplastic on shorelines worldwide: sources and sinks. Environ Sci Technol. 2011;45(21):9175-9179.
- Wang W, Yuan W, Chen Y, Wang J. Microplastics in surface waters of the Yangtze River and Taihu Lake, China. Sci Total Environ. 2018;616-617:1544-1554.
- Li J, Liu H, Chen JP. Microplastics in freshwater systems: a review on occurrence, environmental effects, and methods for microplastics detection. Water Res. 2018;137:362-374.
- Yang L, Zhang Y, Kang S, Wang Z, Wu C. Microplastics in freshwater sediment: a review on methods, occurrence, and sources. Sci Total Environ. 2021;754:141948.
- Dris R, Gasperi J, Rocher V, Tassin B. Synthetic and nonsynthetic anthropogenic fibers in a river under the influence of Paris megacity. Sci Total Environ. 2018;618:173-181.
- He D, Luo Y, Lu S, Liu M, Song Y, Lei L. Microplastics in soils: analytical methods, pollution characteristics and ecological risks. TrAC Trends Anal Chem. 2018;109:163-172.
- Zhang GS, Liu YF. The distribution of microplastics in soil aggregate fractions in northwestern China. Sci Total Environ. 2018;642:12-20.
- Rochman CM, Hoh E, Hentschel BT, Kaye S. Longterm field measurement of sorption of organic contaminants to five types of plastic pellets. Environ Sci Technol. 2013;47(3):1646-1654.
- Teuten EL, Saquing JM, Knappe DRU, Barlaz MA, Jonsson S, Björn A, et al. Transport and release of chemicals from plastics to the environment and to wildlife. Philos Trans R Soc B. 2009;364(1526):20272045.
- Lithner D, Larsson A, Dave G. Environmental and health hazard ranking and assessment of plastic polymers based on chemical composition. Sci Total Environ. 2011;409(18):3309-3324.
- Eriksen M, Mason S, Wilson S, Box C, Zellers A, Edwards W, et al. Microplastic pollution in the surface waters of the Laurentian Great Lakes. Mar Pollut Bull. 2013;77(1-2):177-182.
- Lechner A, Keckeis H, Lumesberger-Loisl F, Zens B, Krusch R, Tritthart M, et al. The Danube so colourful: a potpourri of plastic litter outnumbers fish larvae in Europe's second largest river. Environ Pollut. 2014;188:177-181.
- Nizzetto L, Futter M, Langaas S. Are agricultural soils dumps for microplastics of urban origin? Environ Sci Technol. 2016;50(20):10777-10779.
- Su L, Xue Y, Li L, Yang D, Kolandhasamy P, Li D, et al. Microplastics in Taihu Lake, China. Environ Pollut. 2016;216:711-719.